Algebra 1 5-8 Mixed Review: Graphing Absolute Value Functions
star
star
star
star
star
Last updated over 4 years ago
9 Nsɛmmisa

40
F.IF.6
F.LE.1.b

10
5
5

Review Lesson 5-7:
Use the data from the table to graph the 4 points and create a scatter plot.
Graph a trend line (or the line of best fit) on the same coordinate plane as the scatter plot.
Zoom and pan your graph to establish an appropriate viewing window.

Review Lesson 5-7:
Use the data from the table to graph the 4 points and create a scatter plot.
Graph a trend line (or the line of best fit) on the same coordinate plane as the scatter plot.
Zoom and pan your graph to establish an appropriate viewing window.
Review Lesson 5-3: Graph the equations on the same coordinate plane using the colors indicated for each.
Be sure to include relevant graph detail: label axes, indicate units on both axes, and use arrows to represent end behavior, as appropriate.
Vocabulary Review: Compare the absolute values using the symbols on the left.
>
=
<
|3| _?_ |-3|
|-3| _?_ |-1|
|9| _?_ |-10|
|-9| _?_ |8|
Vocabulary Review: The absolute value of a number is a measure of the distance from 0 to that number on the number line.
Vocabulary Review: The absolute value of a number is always the opposite of that number.
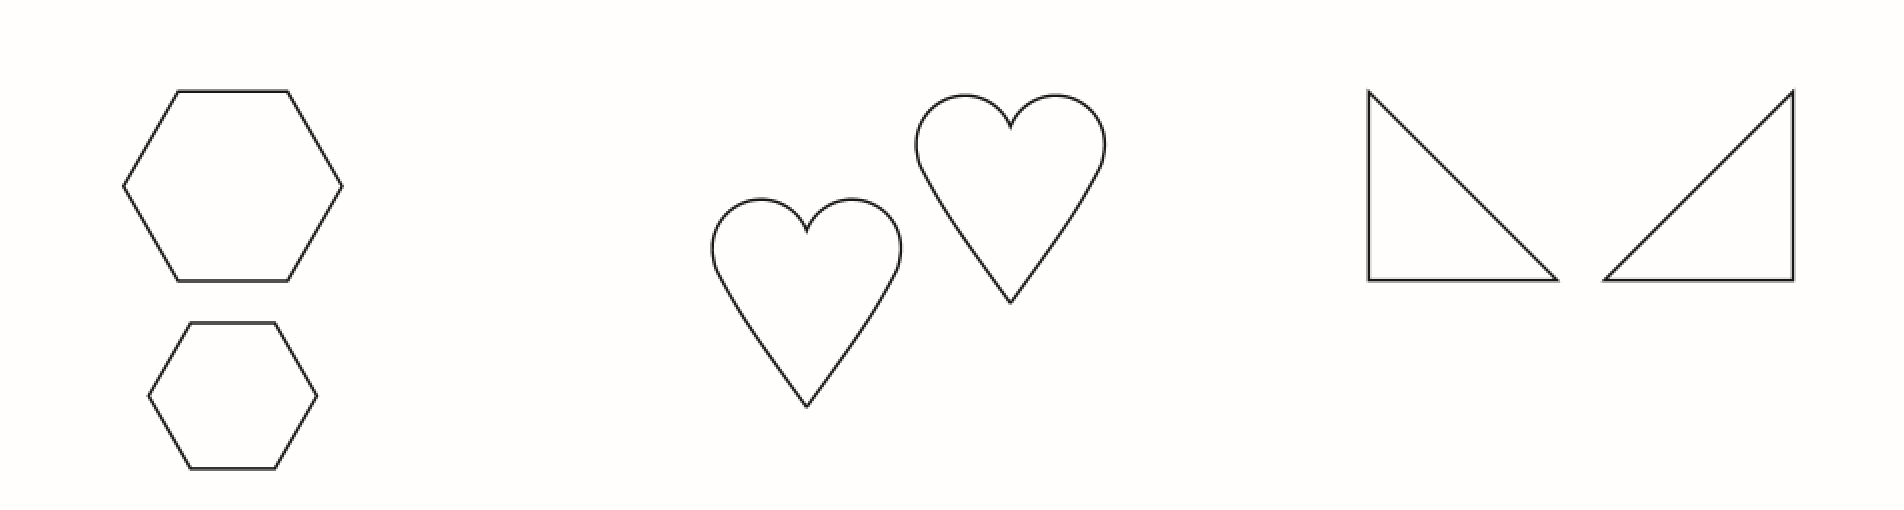
Use Your Vocabulary: Classify the pair of figures.
Use Your Vocabulary: Classify the pair of figures.
Use Your Vocabulary: Classify the pair of figures.
