6.6.A.04 -Creating a Histogram– Exit Ticket
star
star
star
star
star
Posljednje ažuriranje over 4 years ago
3 questions
10
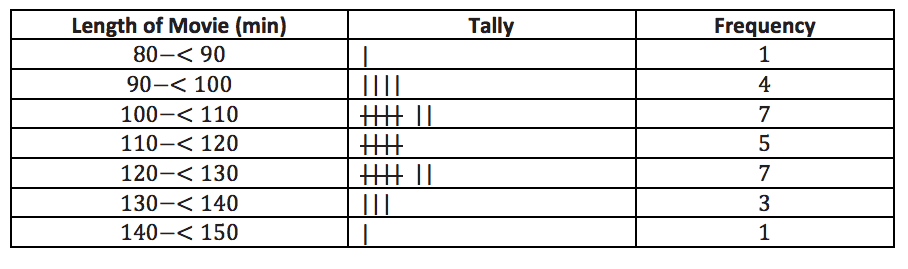
Construct a histogram for the length of movies data.
Construct a histogram for the length of movies data.
10
10
Construct a histogram for the length of movies data.
Describe the shape of the histogram.
What does the shape tell you about the length of movies?