7.5.D.22 - Using Sample Data to Compare the Means of Two or More Populations – Exit Ticket
star
star
star
star
star
Last updated over 4 years ago
3 Nsɛmmisa
10
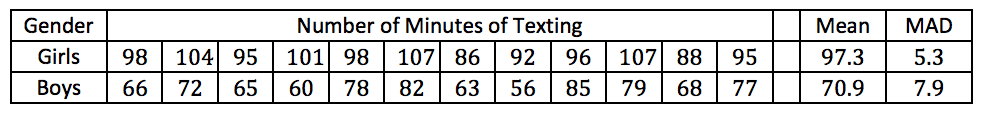
Draw dot plots for the two data sets using the same numerical scales. Discuss
the amount of overlap between the two dot plots that you drew and what it may
mean in the context of the problem.
Draw dot plots for the two data sets using the same numerical scales. Discuss the amount of overlap between the two dot plots that you drew and what it may mean in the context of the problem.
10
10