7.5.C.20 - Estimating a Population Proportion – Exit Ticket
star
star
star
star
star
Last updated over 4 years ago
2 Nsɛmmisa
10
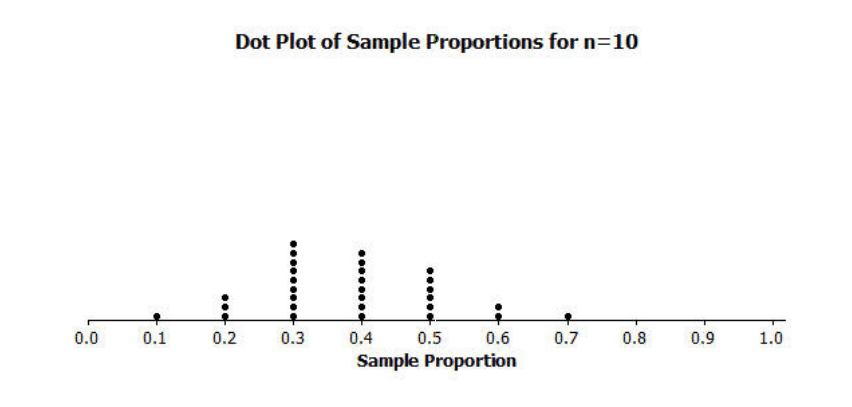
There are three dots above 0.2. What does each dot represent in terms of this
scenario?
There are three dots above 0.2. What does each dot represent in terms of this scenario?
10
Based on the dot plot, do you think the proportion of the middle school students
at this school who like pop music is 0.6? Explain why or why not.
Based on the dot plot, do you think the proportion of the middle school students at this school who like pop music is 0.6? Explain why or why not.