Log in
Sign up for FREE
arrow_back
Library

1.3.D.11 - Collect, sort, and organize data, then ask and answer questions about the number of data points – Exit Ticket

star
star
star
star
star
Last updated about 4 years ago
3 questions
A class collected the information in the chart below. Students asked each other: Among stuffed animals, toy cars, and blocks, which is your favorite toy? Then, they organized the information in this chart.
10
10
10
Question 1
1.

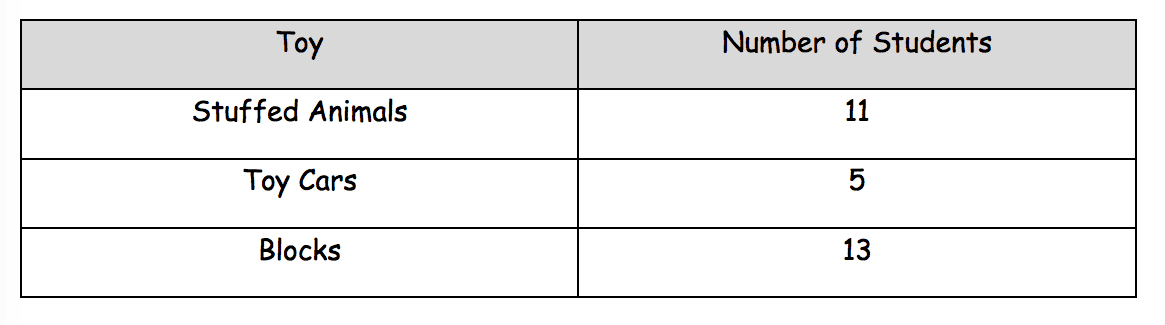
How many students chose toy cars?

Question 2
2.

How many more students chose blocks than stuffed animals?

Question 3
3.

How many students would need to choose toy cars to equal the number of students who chose blocks?

From EngageNY.org of the New York State Education Department. Grade 1 Mathematics Module 3, Topic D, Lesson 11. Internet. Available from https://www.engageny.org/resource/grade-1-mathemat...; accessed 10/Nov/2015.