2.7.A.4 - Draw a Bar Graph to Represent a Given Data Set – Exit Ticket
star
star
star
star
star
Posljednje ažuriranje over 4 years ago
3 questions
10
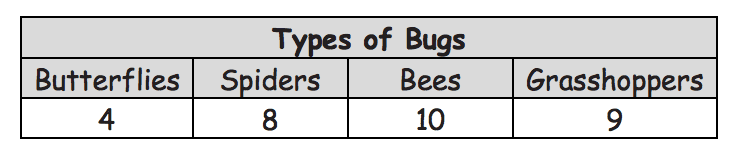
Complete the bar graph using the table with the types of bugs Jeremy counted in
his backyard.
Complete the bar graph using the table with the types of bugs Jeremy counted in his backyard.
10
How many more spiders and grasshoppers were counted than bees and butterflies?
How many more spiders and grasshoppers were counted than bees and butterflies?
10