2.7.A.2 - Draw and Label a Picture Graph to Represent Data with up to Four Categories – Exit Ticket

By Formative Library
starstarstarstarstarstarstarstarstarstar
Last updated over 2 years ago
4 Questions
Use the data provided on the table below to answer questions 1-4.
10
1.
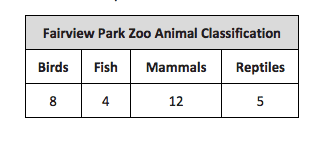
Use the grid paper to create a picture graph below using data provided in the table above.
10
2.
How many more animals are mammals than birds? _
10
3.
How many more animals are mammals and reptiles than birds and fish?
10
4.
How many fewer animals are fish than birds?
From EngageNY.org of the New York State Education Department. Grade 2 Mathematics Module 7, Topic A, Lesson 2. Internet. Available from https://www.engageny.org/resource/grade-2-mathemat...; accessed 29/Mar/2016.