Twa kɔ nsɛm atitiriw so
Log in
Sign up for FREE
arrow_back
Laabri

2021 (June): NY Regents - Earth Science

star
star
star
star
star
Last updated 5 months ago
85 Nsɛmmisa

From the New York State Education Department. The University of the State of New York Regents High School Examination Physical Setting Earth Science v202. Internet. Available from https://www.nysedregents.org/EarthScience/621/esci-v202-exam.pdf; accessed 3, May, 2023.

1
KI.1.PI.1.1i
1
KI.1.PI.1.2a
1
KI.1.PI.1.2b
1
KI.1.PI.1.2b
1
KI.1.PI.1.1e
1
KI.1.PI.1.1f
1
KI.1.PI.1.1i
1
KI.1.PI.1.1h
1
KI.2.PI.2.1v
1
KI.1.PI.1.1a
1
KI.2.PI.2.1f
1
KI.2.PI.2.1h
1
KI.2.PI.2.1c
1
KI.2.PI.2.1g
1
KI.2.PI.2.1h
1
KI.2.PI.2.2c
1
KI.2.PI.2.2a
1
KI.2.PI.2.2d
1
KI.1.PI.1.2j
1
KI.1.PI.1.2j
1
KI.2.PI.2.1w
1
KI.2.PI.2.1b
1
KI.2.PI.2.1j
1
KI.2.PI.2.1j
1
KI.2.PI.2.1n
1
KI.2.PI.2.1j
1
KI.2.PI.2.1n
1
KI.2.PI.2.1v
1
KI.3.PI.3.1b
1
KI.3.PI.3.1c
1
KI.1.PI.1.2j
1
KI.2.PI.2.1u

Directions (36–50): For each statement or question, choose the word or expression that, of those given, best completes the statement or answers the question. Some questions may require the use of the 2011 Edition Reference Tables for Physical Setting/Earth Science. Record your answers on your separate answer sheet.

Directions (51–65): Record your answers in the spaces provided in your answer booklet. Some questions may require the use of the 2011 Edition Reference Tables for Physical Setting/Earth Science.

Directions (66–85): Record your answers in the spaces provided in your answer booklet. Some questions may require the use of the 2011 Edition Reference Tables for Physical Setting/Earth Science.

Asemmisa {{asɛmmisaAhyɛnsode}}
1.

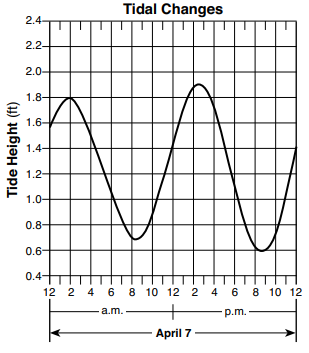
The graph below shows changing ocean tide heights in feet (ft) on April 7 for a coastal location.

The next high tide will occur on April 8 at approximately

Asemmisa {{asɛmmisaAhyɛnsode}}
2.

Scientists who proposed the Big Bang Theory were attempting to explain

Asemmisa {{asɛmmisaAhyɛnsode}}
3.

Which star type has a surface temperature of 4000 K and a luminosity 1000 times greater than the Sun?

Asemmisa {{asɛmmisaAhyɛnsode}}
4.

The red shift in light from stars located in very distant galaxies suggests that these stars are

Asemmisa {{asɛmmisaAhyɛnsode}}
5.

A Foucault pendulum provides evidence that Earth

Asemmisa {{asɛmmisaAhyɛnsode}}
6.

How many days during one year is the Sun directly overhead at noon in New York City?

Asemmisa {{asɛmmisaAhyɛnsode}}
7.

Approximately which percentage of Earth’s surface is exposed above water?

Asemmisa {{asɛmmisaAhyɛnsode}}
8.

On June 21, an observer in New York State will see the Sun set

Asemmisa {{asɛmmisaAhyɛnsode}}
9.

Compared to a well-sorted sample of larger-sized particles, a well-sorted sample of smaller-sized particles has greater

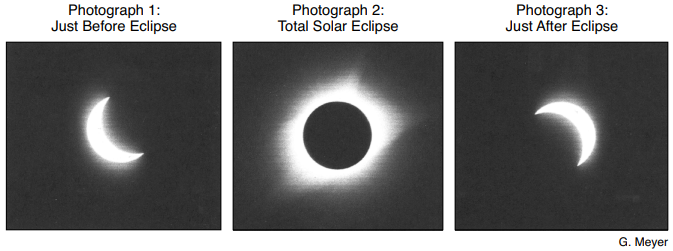
The photographs below show two celestial objects just before, during, and just after a total solar eclipse as viewed by an observer located in Kingston, Tennessee, on August 21, 2017.

1
Asemmisa {{asɛmmisaAhyɛnsode}}
10.

Which diagram represents the location of the Moon in its orbit at the time that each of these three photographs (1, 2, and 3) were taken? (Diagrams are not drawn to scale.)

KI.1.PI.1.1a
Asemmisa {{asɛmmisaAhyɛnsode}}
11.

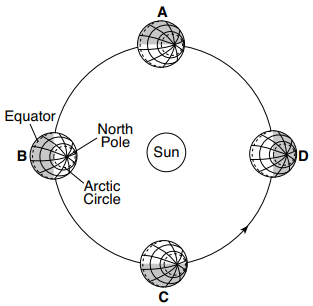
The diagram below represents Earth in four positions, labeled A, B, C, and D, in its orbit around the Sun on the first day of each season.

Between which two consecutive positions is the summer season occurring in the Northern Hemisphere?

Asemmisa {{asɛmmisaAhyɛnsode}}
12.

Which atmospheric conditions occur when the dry-bulb temperature is 30°C and the difference between the dry-bulb temperature and wet-bulb temperature is 1°C?

Asemmisa {{asɛmmisaAhyɛnsode}}
13.

Which precaution is most appropriate during a blizzard?

Asemmisa {{asɛmmisaAhyɛnsode}}
14.

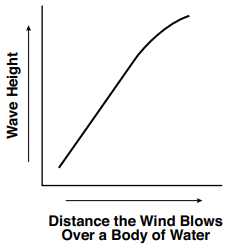
The graph below shows the relationship between the distance that wind blows over a body of water and the height of the waves that are generated.

A west wind blowing with the same velocity would generate the highest waves along the shoreline at

Asemmisa {{asɛmmisaAhyɛnsode}}
15.

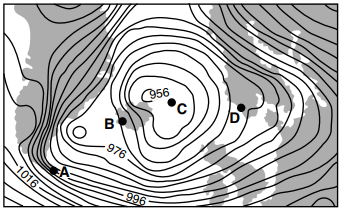
The weather map below shows a storm centered north of Iceland. Points A, B, C, and D indicate locations on Earth’s surface. Isobars are labeled in millibars.

Which location was probably experiencing the highest wind speed?

Asemmisa {{asɛmmisaAhyɛnsode}}
16.

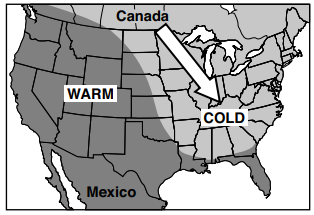
The map below shows a cold, arctic air mass that moved southeast from Canada to cover most of the eastern half of the United States during January 2010.

Which shift caused this flow of cold air out of Canada?

Asemmisa {{asɛmmisaAhyɛnsode}}
17.

Which surface ocean current cools the climate of the western coastline of South America?

Asemmisa {{asɛmmisaAhyɛnsode}}
18.

When equal masses of ice and liquid water receive the same amount of energy, without a change in state, the ice changes temperature faster than the liquid water does because the

Asemmisa {{asɛmmisaAhyɛnsode}}
19.

El Niño is a condition associated with a buildup of unusually warm water along the western coast of South America. Which changes in air temperature and precipitation usually occur in that region during El Niño?

Asemmisa {{asɛmmisaAhyɛnsode}}
20.

Which conclusion can be drawn from the pattern of fossils found in Earth’s rock record?

Asemmisa {{asɛmmisaAhyɛnsode}}
21.

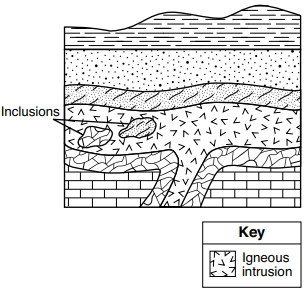
The geologic cross section below represents a portion of Earth’s crust. The rock layers have not been overturned.

The inclusions were most likely broken off from their original rock layers

Asemmisa {{asɛmmisaAhyɛnsode}}
22.

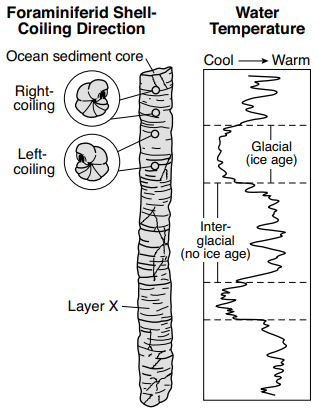
While studying sediments deposited during and after the last ice age, scientists discovered that foraminiferid shells coil in different directions when they grow under different temperature conditions, as shown in the diagram below.

Foraminiferid shells found in layer X most likely coiled to the

Asemmisa {{asɛmmisaAhyɛnsode}}
23.

Approximately how many million years ago (mya) was the amount of Earth’s total landmass located south of the equator the greatest?

Asemmisa {{asɛmmisaAhyɛnsode}}
24.

Which layer of Earth’s interior is inferred to be composed of solid iron and nickel?

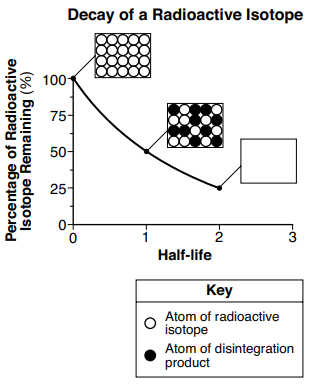
The graph below shows the rate of decay of a radioactive isotope through two half-lives. Each box shows the ratio of atoms of the radioactive isotope to atoms of the disintegration product. The box at two half-lives has been left blank.

1
Asemmisa {{asɛmmisaAhyɛnsode}}
25.

Which box best represents the ratio of these atoms at two half-lives?

KI.1.PI.1.2j
Asemmisa {{asɛmmisaAhyɛnsode}}
26.

The first S-wave reaches a seismic station 22 minutes after an earthquake occurred. How long did it take the first P-wave to reach the same seismic station?

Asemmisa {{asɛmmisaAhyɛnsode}}
27.

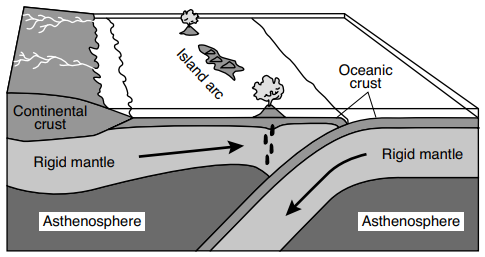
The block diagram below represents the formation of an island arc near a plate boundary.

An island arc is located near the boundary between which two tectonic plates?

Asemmisa {{asɛmmisaAhyɛnsode}}
28.

Which table correctly matches the average density and composition of continental and oceanic crusts?

Asemmisa {{asɛmmisaAhyɛnsode}}
29.

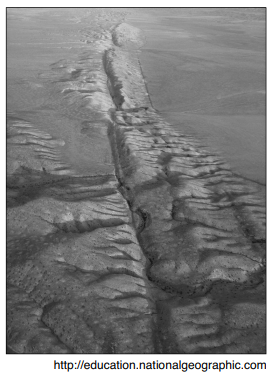
The photograph below shows a portion of the San Andreas Fault in the western United States.

The San Andreas Fault is an example of a

Asemmisa {{asɛmmisaAhyɛnsode}}
30.

What is the minimum stream velocity necessary to transport a quartz particle that is 0.1 centimeter in diameter in a stream?

Asemmisa {{asɛmmisaAhyɛnsode}}
31.

Scoria is a type of rock that forms most directly from the process of

Asemmisa {{asɛmmisaAhyɛnsode}}
32.

The element silicon (Si) is used in the production of cell phones. Which mineral could be a possible source of this silicon?

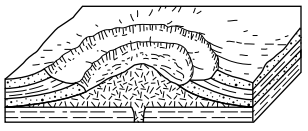
The block diagram below shows a portion of a deeply eroded dome landscape.

1
Asemmisa {{asɛmmisaAhyɛnsode}}
33.

Which map shows the stream pattern that probably formed on the surface of this landscape?

KI.2.PI.2.1r
Asemmisa {{asɛmmisaAhyɛnsode}}
34.

Which two New York State locations have surface bedrock of similar ages?

Asemmisa {{asɛmmisaAhyɛnsode}}
35.

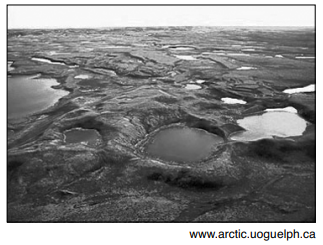
The aerial photograph below shows small, circular bodies of water surrounded by sediment in an area that was once covered by glaciers.

These bodies of water are known as

Base your answers to questions 36 and 37 on the diagram below and on your knowledge of Earth science. The diagram represents the elliptical orbit for one planet in our solar system. The two foci of the orbit are shown as the Sun and F2.

1
Asemmisa {{asɛmmisaAhyɛnsode}}
36.

Which condition would produce an orbit with a greater eccentricity?

KI.1.PI.1.1b
1
KI.1.PI.1.1a

Base your answers to questions 38 and 39 on the diagram below and on your knowledge of Earth science. The diagram represents a simplified model of the incoming (solar) and outgoing (terrestrial) electromagnetic radiation of Earth’s energy budget.

1
Asemmisa {{asɛmmisaAhyɛnsode}}
38.

Which color and texture of Earth materials absorbs the greatest amount of short-wave radiation from the Sun?

KI.2.PI.2.2a
1
KI.2.PI.2.2a

Base your answers to questions 40 and 41 on the passage and map below and on your knowledge of Earth science. The map shows a portion of Southeast Asia.

Southeast Asia Monsoons

The Southeast Asia monsoons are seasonal shifts in the direction of regional planetary winds. These shifts are related to the movement of air pressure belts as the Sun’s vertical ray changes latitude. In the late spring, winds begin to blow from the southwest, bringing moisture from the Gulf of Thailand across Southeast Asia. Rainfall reaches a peak in July and August. This moisture is partially blocked by the Annamite Mountains, located along the border between Vietnam and Laos. Therefore, the rainfall in central Vietnam is somewhat less during these months. In September, the winds reverse direction and begin to flow from the northeast across the Gulf of Tonkin and South China Sea. This wind shift begins the season of heavy rainfall in central Vietnam that continues for months.

1
Asemmisa {{asɛmmisaAhyɛnsode}}
40.

Heavy rains occur in Cambodia and Thailand when the moist air brought by the monsoon

KI.2.PI.2.1i
1
KI.2.PI.2.1i

Base your answers to questions 42 and 43 on the diagram below and on your knowledge of Earth science. The diagram represents one position of Earth in its orbit around the Sun and 12 constellations that can be seen in the night sky by an observer in New York State at different times of the year. The approximate locations of the constellations in relation to Earth’s orbit are shown. Point A represents another position in Earth’s orbit.

1
Asemmisa {{asɛmmisaAhyɛnsode}}
42.

When Earth is located in the orbital position shown on the diagram, which constellation is visible to an observer in New York State at midnight?

KI.1.PI.1.1g
1
KI.1.PI.1.1f

Base your answers to questions 44 through 47 on the cross sections below and on your knowledge of Earth science. The cross sections represent three widely spaced rock outcrops labeled A, B, and C. Line XY represents a fault. Overturning has not occurred.

1
KI.2.PI.2.1w
1
KI.1.PI.1.2j
1
KI.1.PI.1.2j
1
KI.1.PI.1.2j

Base your answers to questions 48 through 50 on the diagram below and on your knowledge of Earth science. The diagram represents an erosional-depositional system in an arid environment, and indicates the processes occurring at various locations within the atmosphere and on the land surface. The box labeled X identifies one sand dune. Arrows represent the movement of particles.

1
KI.2.PI.2.1t
1
KI.2.PI.2.1v
1
KI.2.PI.2.1u

Base your answers to questions 51 through 53 on the passage below and on your knowledge of Earth science.

Waimea Canyon

Waimea Canyon is located on the west side of the island of Kauai, Hawaii. Waimea Canyon has been referred to as the “Grand Canyon of the Pacific.” But unlike the Grand Canyon, which was carved through horizontal layers of sedimentary rocks, Waimea Canyon was cut through basalt. The formation of this igneous rock began about 4 million years ago. Numerous lava flows followed as magma rose from deep within Earth. The canyon then was formed over time by erosional agents, causing deep, V-shaped valleys that exposed the basalt layers along the canyon walls.

Over time, the composition of the basalt, where it was exposed at the surface, was changed due to oxidation (rusting) of iron-bearing minerals, such as pyroxene and olivine. The result is a canyon with red rocks and soils.

1
Asemmisa {{asɛmmisaAhyɛnsode}}
51.

Identify the epoch during which the first basalt lava flows occurred on Kauai.

Epoch

KI.2.PI.2.1m
1
Asemmisa {{asɛmmisaAhyɛnsode}}
52.

Identify the dominant agent of erosion that carved Waimea Canyon.

KI.2.PI.2.1t
1
Asemmisa {{asɛmmisaAhyɛnsode}}
53.

In addition to pyroxene and olivine, identify the name of one other mineral commonly found in basalt that could oxidize to produce red soils.

KI.2.PI.2.1s

Base your answers to questions 54 through 56 on the map within the question, on the table below, and on your knowledge of Earth science. The map shows a portion of the Nazca Plate under the southeastern Pacific Ocean. Plate A represents another tectonic plate. The table shows some data for islands and seamounts (undersea volcanoes that do not rise above the ocean surface) that originally formed at the Easter Island Hot Spot.

1
Asemmisa {{asɛmmisaAhyɛnsode}}
54.

On the map in the Show Your Work space, plot with Xs the locations of the six islands and seamounts formed by the Easter Island Hot Spot.

KI.2.PI.2.1n
1
Asemmisa {{asɛmmisaAhyɛnsode}}
55.

Identify the name of tectonic plate A:

Plate

KI.2.PI.2.1p
1
Asemmisa {{asɛmmisaAhyɛnsode}}
56.

Describe the general relationship between the distance from the East Pacific Ridge and the age of the oceanic bedrock of the islands and seamounts.

KI.2.PI.2.1n

Base your answers to questions 57 and 58 on the diagram below and on your knowledge of Earth science. The diagram represents the water cycle. Letters A through C identify water cycle processes. Arrows represent movement of water or water vapor. The level of the water table is indicated.

1
Asemmisa {{asɛmmisaAhyɛnsode}}
57.

Water vapor forms a cloud of liquid droplets at location A. State the number of joules per gram of heat energy that is released into the atmosphere during this process.

J/g

KI.2.PI.2.1b
1
Asemmisa {{asɛmmisaAhyɛnsode}}
58.

Identify the names of the two different processes, represented by letters B and C, that return moisture to the atmosphere.

B:

C:

KI.1.PI.1.2g

Base your answers to questions 59 through 62 on the weather map below and on your knowledge of Earth science. The map shows the location of a low-pressure system over New York State during late summer. Isobar values are recorded in millibars. Shading indicates regions receiving precipitation. The air masses are labeled. Eight locations in New York State are indicated.

1
Asemmisa {{asɛmmisaAhyɛnsode}}
59.

Identify the location labeled on the map that will next experience a short burst of heavy precipitation, a change in wind direction, and a rapid decrease in temperature.

KI.2.PI.2.1g
1
Asemmisa {{asɛmmisaAhyɛnsode}}
60.

Convert the air pressure at Plattsburgh, New York, from millibars to inches of mercury.

in of Hg

KI.2.PI.2.1c
1
Asemmisa {{asɛmmisaAhyɛnsode}}
61.

KI.2.PI.2.1g
1
KI.2.PI.2.1d

Base your answers to questions 63 through 65 on the calendar below, on the diagram in your answer booklet, and on your knowledge of Earth science. The calendar shows the phases of the Moon for January 2019 as viewed by an observer in New York State. Some phases have been labeled. The diagram on your answer sheet represents eight positions of the Moon in its orbit around Earth.

1
Asemmisa {{asɛmmisaAhyɛnsode}}
63.

In the Show Your Work space, circle the position of the Moon in its orbit that produced the moon phase observed on January 17, 2019.

KI.1.PI.1.1a
1
Asemmisa {{asɛmmisaAhyɛnsode}}
64.

On the diagram in the Show Your Work space, place an X on each of the two positions of the Moon in its orbit where neap tides (the smallest difference in the water levels between high tide and low tide) occur.

KI.1.PI.1.1a
1
Asemmisa {{asɛmmisaAhyɛnsode}}
65.

A New Moon occurred on January 5, 2019. Determine the date of the New Moon that occurred in February 2019.

February , 2019

KI.1.PI.1.1a

Base your answers to questions 66 through 69 on the topographic map in the Show Your Work space and on your knowledge of Earth science. Partially drawn contour lines are shown on the southern portion of the map. Points of elevation are recorded in meters. Points A, B, C, and D represent locations on Earth’s surface. Line AB and dashed line CD are reference lines.

1
Asemmisa {{asɛmmisaAhyɛnsode}}
66.

On the topographic map in the Show Your Work space, complete the 480-meter, 500-meter, and 520-meter contour lines on the southern portion of the map.

Partially drawn contour lines are shown on the southern portion of the map. Points of elevation are recorded in meters. Points A, B, C, and D represent locations on Earth’s surface. Line AB and dashed line CD are reference lines.

KI.2.PI.2.1q
1
KI.2.PI.2.1q
1
Asemmisa {{asɛmmisaAhyɛnsode}}
68.

Calculate the gradient, in meters per kilometer, from point C to point D.

m/km

KI.2.PI.2.1q
1
KI.2.PI.2.1q

Base your answers to questions 70 through 72 on the passage below and on your knowledge of Earth science.

Carrara Marble

Carrara marble is named for the town of Carrara on the west coast of Italy. This dazzling white marble has been mined since the time of the ancient Romans and remains the major industry of the area today. The marble has many commercial uses, such as tombstones, countertops, tiles, and building stones. Its chemical purity, uniform color, and hardness make this marble an ideal material for artists who carve statues from rock. Major museums around the world have statues carved from Carrara marble.

The formation of Carrara marble began 200 million years ago when a great thickness of tiny shells was deposited at the bottom of a warm, shallow sea. Over time, burial and compaction of these sediments formed sedimentary rock primarily composed of pure calcite. Approximately 27 million years ago, tectonic forces caused this area of the seafloor bedrock to be deformed and metamorphosed, forming the Carrara marble. Uplift and erosion later exposed huge formations of this famous marble.
1
Asemmisa {{asɛmmisaAhyɛnsode}}
70.

Identify the most likely sedimentary rock that formed when the sediments of tiny shells were buried and compacted.

KI.2.PI.2.1w
1
Asemmisa {{asɛmmisaAhyɛnsode}}
71.

Identify the change in pressure and the change in temperature that most likely occurred to metamorphose the sedimentary seafloor bedrock into the Carrara marble.

Change in pressure:

Change in temperature:

KI.3.PI.3.1b
1
Asemmisa {{asɛmmisaAhyɛnsode}}
72.

In terms of mineral properties, explain why a statue is easier to carve from pure white marble rather than from pure white quartzite.

KI.3.PI.3.1a

Base your answers to questions 73 through 75 on the diagram below and on your knowledge of Earth science. The diagram represents the inferred sequence in which our solar system formed from a nebula of gas and dust. Letters A through F represent different stages in its development.

1
Asemmisa {{asɛmmisaAhyɛnsode}}
73.

Identify the force that pulled most matter to the center of the rotating disk in stage B.

KI.1.PI.1.2c
1
Asemmisa {{asɛmmisaAhyɛnsode}}
74.

Identify the process that produces energy in the core of the Sun at stage E by combining lighter elements into heavier elements.

KI.1.PI.1.2b
1
Asemmisa {{asɛmmisaAhyɛnsode}}
75.

Most asteroids formed in a belt located between 329 million and 478.7 million kilometers from the Sun. Identify the two planets located on either side of the asteroid belt.

and

KI.1.PI.1.2d

Base your answers to questions 76 and 77 on the map below and on your knowledge of Earth science. The map shows the four time zones across the continental United States. Eight cities are labeled on the map.

1
Asemmisa {{asɛmmisaAhyɛnsode}}
76.

State the time at San Francisco, California, when it is 12 noon at New Orleans, Louisiana. Indicate a.m. or p.m. in your answer.

KI.1.PI.1.1d
1
Asemmisa {{asɛmmisaAhyɛnsode}}
77.

Identify the city on the map where the altitude of Polaris is closest to 45 degrees.

KI.1.PI.1.1f

Base your answers to questions 78 through 80 on the graphs below and on your knowledge of Earth science.

The climate graphs represent data for three different locations in North America. Line graphs show the average monthly air temperatures in degrees Fahrenheit (°F). Bar graphs show the average monthly precipitation in inches (in). A circled dot (\odot) indicates each location on the maps.

1
Asemmisa {{asɛmmisaAhyɛnsode}}
78.

State one reason why the annual temperature range of Calgary, Canada, is greater than the annual temperature range in Sitka, Alaska.

KI.2.PI.2.2a
1
Asemmisa {{asɛmmisaAhyɛnsode}}
79.

Explain why the noontime altitude of the Sun (angle of insolation) is greater at Monterrey, Mexico, than at Calgary, Canada, every day of the year.

KI.2.PI.2.2a
1
Asemmisa {{asɛmmisaAhyɛnsode}}
80.

Identify the most likely types of precipitation that occur in Calgary, Canada, and Monterrey, Mexico, during January and February.

Type of precipitation in Calgary:

Type of precipitation in Monterrey:

KI.2.PI.2.1c

Base your answers to questions 81 and 82 on the map below and on your knowledge of Earth science. The map shows a river and a depositional feature at an ocean shoreline. Point A indicates a location on Earth’s surface.

1
Asemmisa {{asɛmmisaAhyɛnsode}}
81.

Identify the name of the depositional feature surrounding location A that is forming where the river enters the ocean.

KI.2.PI.2.1u
1
Asemmisa {{asɛmmisaAhyɛnsode}}
82.

Describe how the rocks and sediments are rounded and smoothed as they are being eroded by the water in this river.

KI.2.PI.2.1t

Base your answers to questions 83 through 85 on the timeline in the Show Your Work space and on your knowledge of Earth science.

The timeline represents the last 600 million years of geologic time. Shaded area A represents the Neogene Period.

1
Asemmisa {{asɛmmisaAhyɛnsode}}
83.

On the timeline in the Show Your Work space, accurately shade in an area to represent the entire Permian Period.

The timeline represents the last 600 million years of geologic time. Shaded area A represents the Neogene Period.

KI.1.PI.1.2j
1
Asemmisa {{asɛmmisaAhyɛnsode}}
84.

Identify the name of one New York State landscape region where the index fossil Phacops may be found in the surface bedrock.

KI.1.PI.1.2j
1
Asemmisa {{asɛmmisaAhyɛnsode}}
85.
KI.1.PI.1.2i
Asemmisa {{asɛmmisaAhyɛnsode}}
37.

The arrangement and movement of celestial objects in our solar system is best described by the

Asemmisa {{asɛmmisaAhyɛnsode}}
39.

Two major greenhouse gases that absorb outgoing long-wave radiation within the atmosphere are

Asemmisa {{asɛmmisaAhyɛnsode}}
41.

Which map shows the most likely location and direction of the monsoon winds and regional atmospheric pressure occurring in Southeast Asia in July?

Asemmisa {{asɛmmisaAhyɛnsode}}
43.

Approximately how many days (d) does it take for Earth to orbit from its present position to point A?

Asemmisa {{asɛmmisaAhyɛnsode}}
44.

What is the youngest sedimentary rock layer represented in these cross sections?

Asemmisa {{asɛmmisaAhyɛnsode}}
45.

Which sequence shows the relative ages of the igneous intrusion, fault X–Y, unconformity, and red sandstone, from oldest to youngest, in outcrop C?

Asemmisa {{asɛmmisaAhyɛnsode}}
46.

Which processes formed the unconformities shown in outcrops B and C?

Asemmisa {{asɛmmisaAhyɛnsode}}
47.

Which characteristic of the volcanic ash layer is most useful for correlating rock layers in outcrops A, B, and C?

Asemmisa {{asɛmmisaAhyɛnsode}}
48.

Which agent of erosion moves the particles within this erosional-depositional system?

Asemmisa {{asɛmmisaAhyɛnsode}}
49.

The total range of particle sizes indicated in this system is

Asemmisa {{asɛmmisaAhyɛnsode}}
50.

Which diagram indicates both the direction of dune migration (movement) and the dominant process occurring on each slope of the dune in box X?

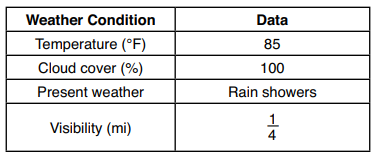
The table below lists the weather conditions at Old Forge, New York.

On the station model in the Show Your Work space, record all four weather conditions for Old Forge using the proper format.

Asemmisa {{asɛmmisaAhyɛnsode}}
62.

Identify the weather instrument used to measure air pressure.

Asemmisa {{asɛmmisaAhyɛnsode}}
67.

On the grid in the Show Your Work space, construct a topographic profile along line AB by plotting the elevation of each contour line that crosses line AB. The elevations of points A and B have been plotted on the grid. Connect all nine plots with a line from A to B to complete the profile.

Partially drawn contour lines are shown on the southern portion of the map. Points of elevation are recorded in meters. Points A, B, C, and D represent locations on the Earth's surface. Line ABand dashed line CD are reference lines.

Asemmisa {{asɛmmisaAhyɛnsode}}
69.

Describe the evidence shown by the contour lines that indicates that Bry Creek flows downhill in a southwesterly direction.

List the following organisms in order of geologic age from youngest to oldest: earliest mammals, earliest stromatolites, earliest grasses, Earth’s first forests.

Youngest

Oldest