Pre-Algebra Probability and Stats
star
star
star
star
star
Posljednje ažuriranje over 8 years ago
25
1
1
1
1
1
1
1
1
1
1
1
1
1
1
1
1
1
1
1
1
1
1
1
1
1
The faces of a fair 6-sided cube are numbered 1 through 6. Based on the theoretical probability, if a number cube is rolled 30 times, how many times should a 4 be rolled?
The faces of a fair 8-sided cube are numbered 1 through 8. Based on the theoretical probability, if a number cube is rolled 80 times, how many times should an even number be rolled?
A box contains five cards lettered A, A, B, C, D. If one card is selected at random from the box and NOT replaced, what is the probability that Jack will draw a “D” and then an “A”?
These are the sides of an octahedron used to play a game.
1, 2, 3, 4, 5, 6, 7, 8
What is the probability for Jill to roll a 5 and then an odd number?
These are the sides of a number cube.
1, 1, 2, 2, 3, 3
What is the probability of rolling a 1 and then a 3?
There are four blue, one yellow, three green, one purple, and one grey marble in a box. What is the probability of drawing a grey marble the first time, and, without replacing it, a green marble on your second draw?
Hillary has the following pencils in her pencil pouch, 2 orange, 4 green, 3 pink, and 1 blue. She needs an orange pencil for her assignment. If she pulls out a random pencil, what is the probability that she does not pick an orange pencil on the first try, does not replace the pencil, and then pick an orange pencil on the second pick?
These are the sides of a number cube used to play monopoly.
1, 2, 3, 4, 5, 6
What is the probability of rolling a number less than or equal to 4, then an odd, and then rolling a 5?
A box contains eight cards numbered 2, 3, 4, 5, 6, 7, 8, 9. One card is selected at random and not replaced. What is the probability that you can select a 3 and then a prime number?
These are the sides of a number cube used to play monopoly.
1, 2, 3, 4, 5, 6
What is the probability of rolling a number less than 5 and then rolling a number greater than 6?
The team captain called "tails" for 4 consecutive coin tosses. What is the theoretical probability that he was correct all four times?
A box contains eight cards numbered 2, 3, 4, 5, 6, 7, 8, 9. One card is selected at random and not replaced. What is the probability that you can select a number less than 4 and then a composite number?
What is the mode of the following data set?
9, 19, 16, 7, 20, 11, 11, 11, 13
What is the mean of the data set?
7, 10, 5, 7, 17, 8
What is the median of the data set?
11, 10, 14, 14, 20, 12, 6, 18, 12
What is the range of the data set?
9, 19, 16, 7, 20, 11, 11, 11, 13
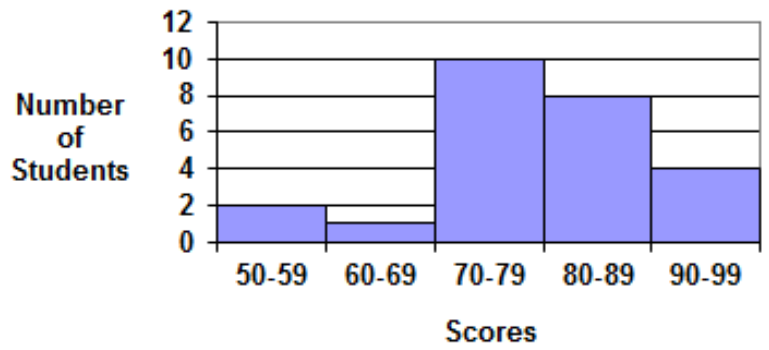
Look at the histogram above. How many students took the quiz?
Look at the histogram above. How many students scored below 70% on the quiz?
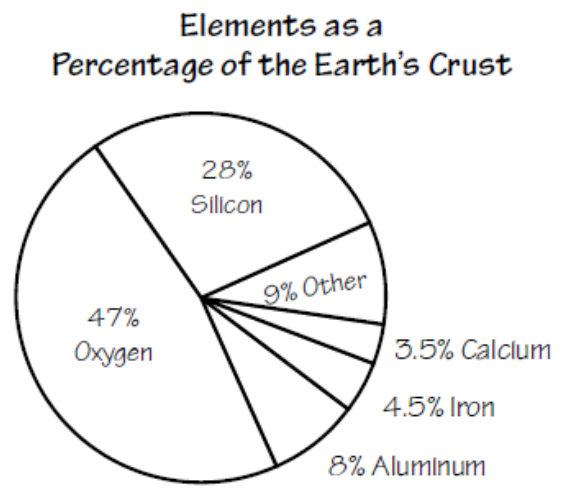
Look at the pie chart above. Which two elements make up about 50% of the Earth's crust?
Look at the pie chart above. In a 200 pound sample of the Earth's crust different amounts of each element above was found. Based on the data in the graph, how many more pounds of Silicon was found than Aluminum?
Look at the pie chart above. In a 400 pound sample of the Earth's crust different amounts of each element above was found. Based on the data in the graph, how many more pounds of Oxygen was found than Silicon?
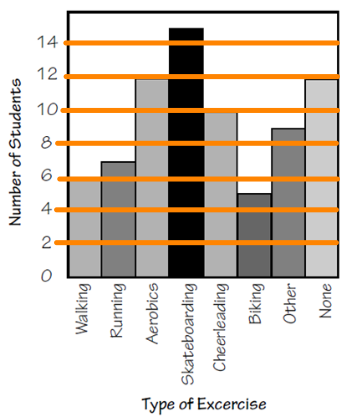
Look at the bar graph above. Which two exercises together were as popular as skateboarding?
Look at the bar graph above. What percentage of the total did not do any exercise? Round to the nearest whole percentage.
Look at the bar graph above. What percentage of the total did running as their exercise? Round to the nearest whole percentage.
Look at the bar graph above. Identify each true statement.