1
Which histogram has the highest median?
Which histogram has the highest median?
1
1
1
Draw a "skeleton" box and whisker plot and label the five number summary.
What are the whiskers on the box and whisker plot.
What is the interquartile range for the following data: 56, 32, 54, 34, 23, 67, 23, 45, 12, 32, 34, 24
Which histogram has the highest median?

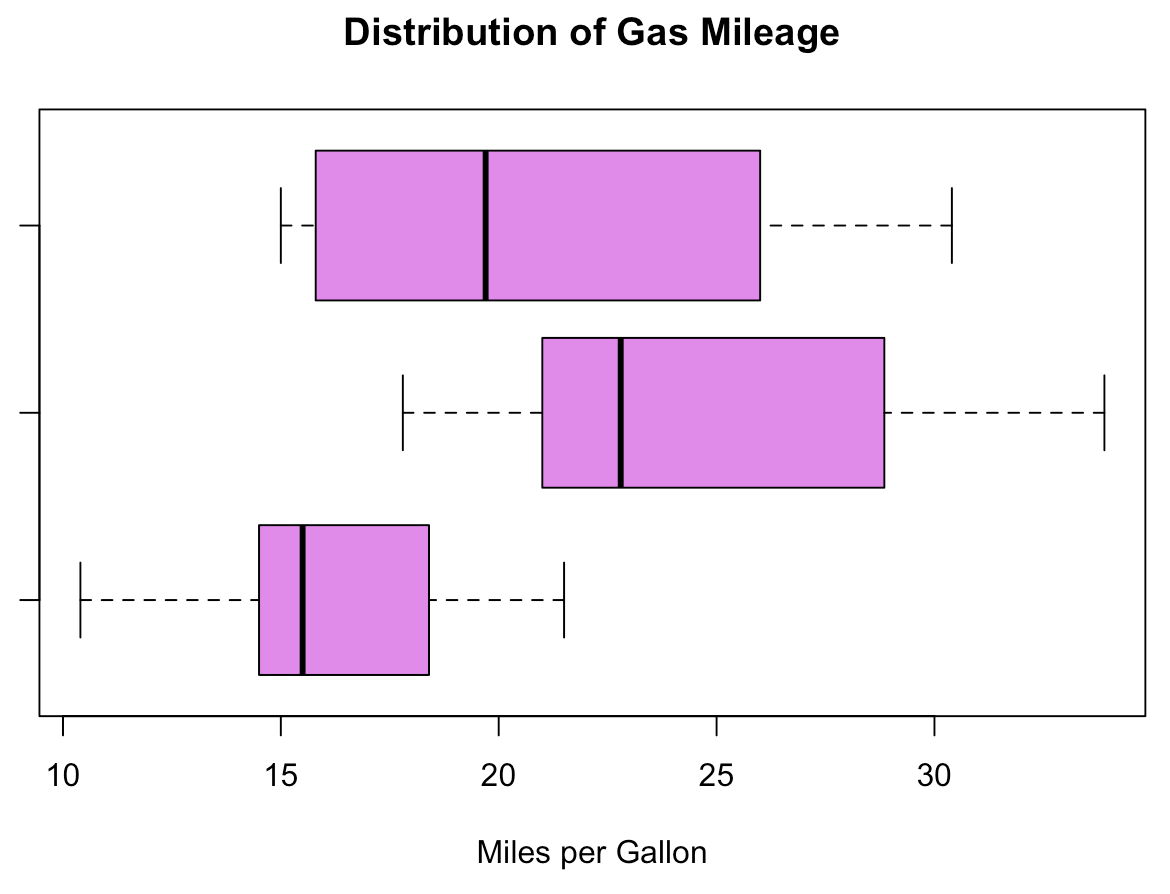
Describe what is going on with Sweden - where are the whiskers?
Which histogram has the largest range?
Which histogram has the largest variability?
Which histogram is the most predictable?
Which country has the largest range?
Which country has the highest median?
Which country has the lowest variability?