IM 8.3.3 Practice Problems
star
star
star
star
star
Posljednje ažuriranje over 7 years ago
5
Napomena autora:
Lesson 3
1
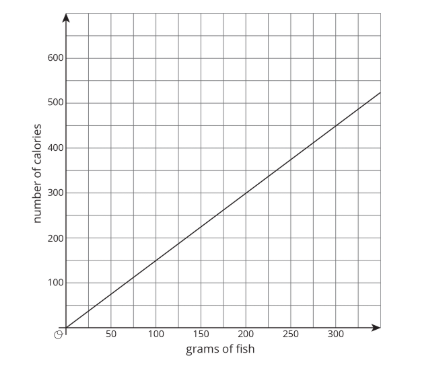
Above is a graph of the proportional relationship between calories and grams of fish. Write an equation that reflects this relationship using x to represent the amount of fish in grams and y to represent the number of calories.
Above is a graph of the proportional relationship between calories and grams of fish. Write an equation that reflects this relationship using x to represent the amount of fish in grams and y to represent the number of calories.
1
1
1
1