4.2: LINEAR RELATIONSHIPS I
star
star
star
star
star
Posljednje ažuriranje over 5 years ago
9
0
1

1
1
1

1
1
1
1
In this formative you will find...
-Unit Notes
-Extra videos for understanding
-Textbook questions and answers for this topic
-A formative quiz to check your understanding
Please comple the following questions in your notebook. I will be doing periodic homework checks so make sure you do not lose it. You can check your work with the key at the end
Did you complete all of the questions above and check your answers to make sure you have a good understanding?
Which of the graphs represents a linear equation?
Which of the statements best describes the equation that represents the table?

This table may be derived from the equation

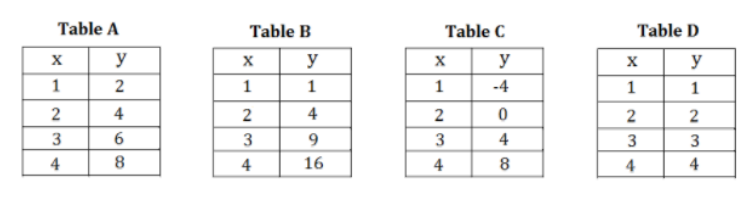
Which of the tables represents the equation y= 2x ?
Which of the tables represents a non-linear equation?
Table D is represented by the equation...

If this table is linear, what is the missing value of y when x=-1?

Which of the equations below represents this table?
