Algebra 2 4-2 Guided Practice: Standard Form of a Quadratic Function
star
star
star
star
star
Last updated over 3 years ago
14 Nsɛmmisa

3
3

3
10
10
3
3
10
A.CED.2
F.IF.4
![]()
Video Check: Select all that apply with regards to the video embedded directly above this item.

Solve It! What is the maximum height of the ball?
![]()
Video Check: Select all that apply with regards to the video embedded directly above this item.

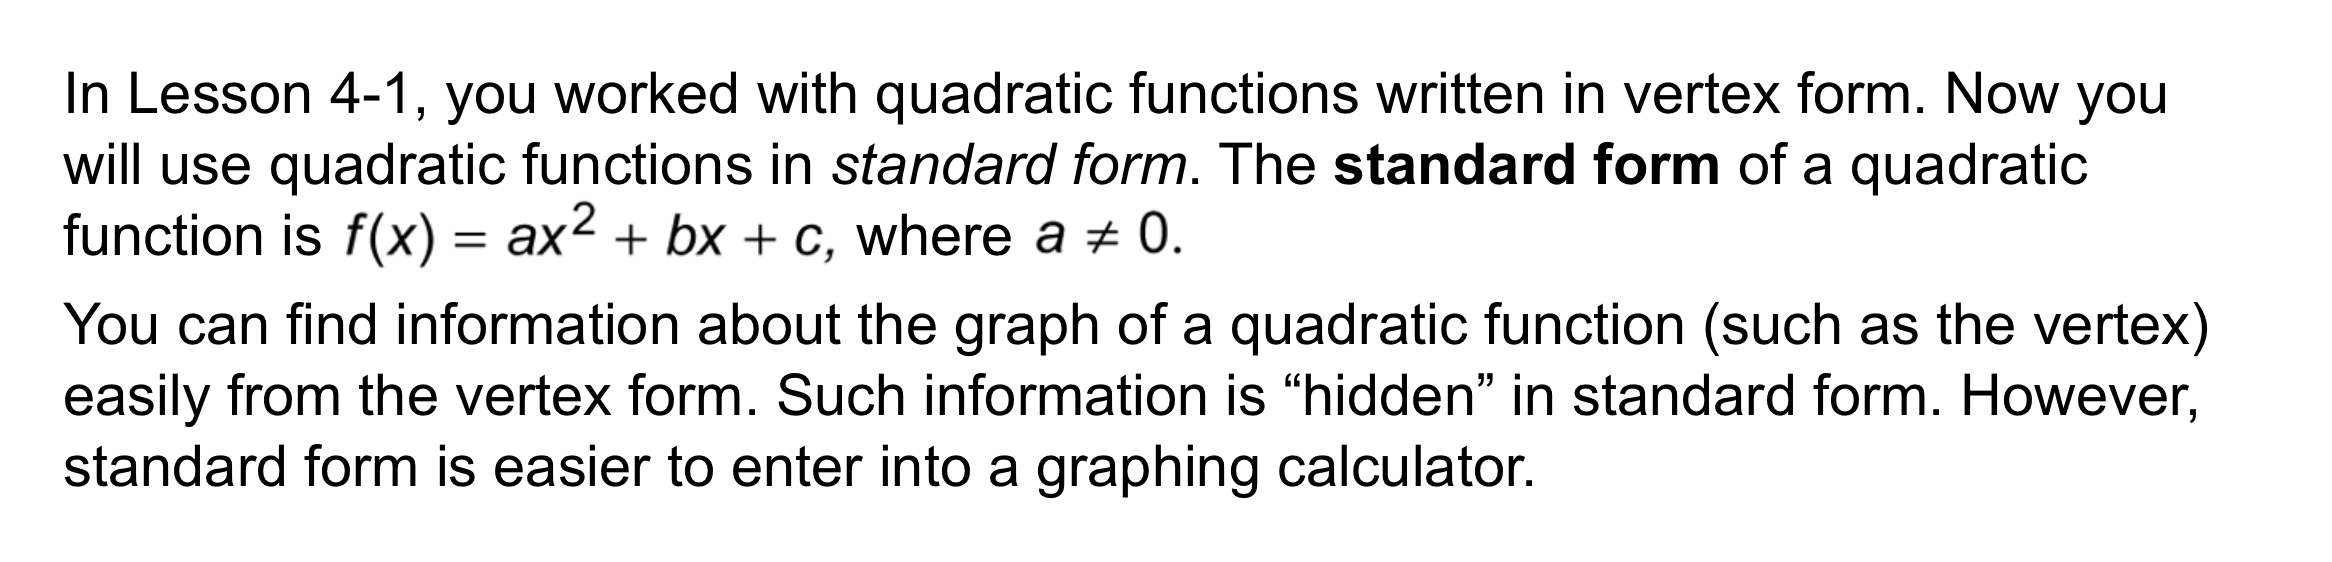
Take Note: Write the standard form of a quadratic function. Assume a ≠ 0 and use function notation beginning with "f(x)=".
HINT: Your equation should include a, b, and c.
Take Note: Some information about the quadratic function, including the location of the vertex, is "hidden" when the function is written in standard form. That seems like a disadvantage of the form. Identify and describe one advantage of standard form that was named in this lesson?
Problem 1 Got It?
![]()
Video Check: Select all that apply with regards to the video embedded directly above this item.
![]()
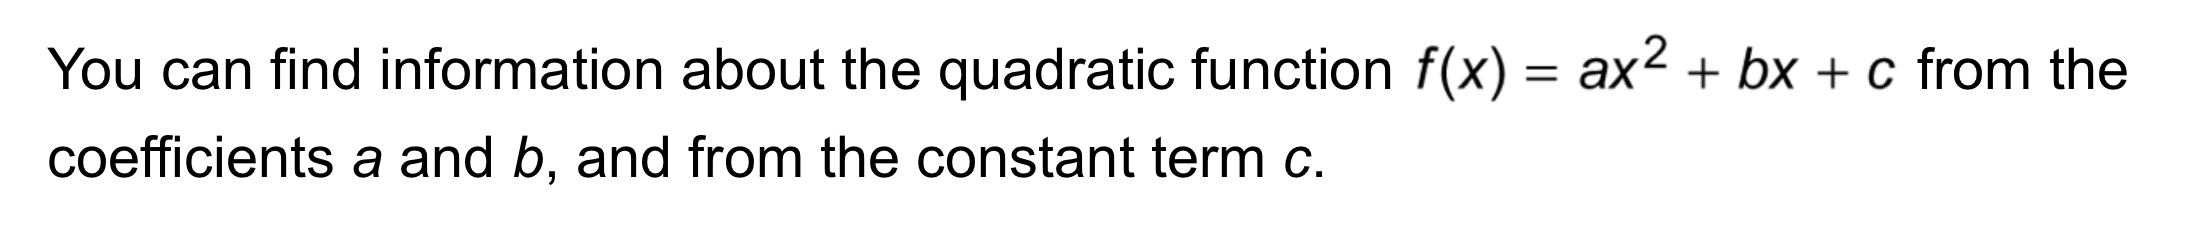
Take Note: Consider the standard form of a quadratic function.
You can derive a lot of information about the graph of a quadratic function from its coefficients when written in standard form.
Match items on the left with those on the right to complete true statements about the graphs of quadratics that are written in standard form.
| Draggable item | arrow_right_alt | Corresponding Item |
|---|---|---|
The line | arrow_right_alt | |
If | arrow_right_alt | the axis of symmetry. |
If | arrow_right_alt | |
| arrow_right_alt | the parabola opens upward. | |
| arrow_right_alt | the parabola opens downward. | |
The y-intercept is | arrow_right_alt | the x-coordinate of the vertex. |
Parabola is the shape of the graph of | arrow_right_alt | the y-coordinate of the vertex. |
Problem 2 Got It? What is the graph of the function?
Plot the vertex, followed by the y-intercept to create the graph.
![]()
Video Check: Select all that apply with regards to the video embedded directly above this item.

Problem 3 Got It?
![]()
Video Check: Select all that apply with regards to the video embedded directly above this item.
Problem 4 Got It? The Zhaoshou Bridge in China is the oldest known arch bridge, dating to AD 605.

You can model the support arch with the function below where x and f are measured in feet. How high is the arch above its supports?
You may graph the function at desmos.com/calculator and use your graph to help you respond.
🧠 Retrieval Practice:
Summarize the mathematical content of this lesson. What topics, ideas, and vocabulary were introduced?