Algebra 2 5-8 Guided Practice: Polynomial Models in the Real World
star
star
star
star
star
Last updated over 3 years ago
19 Nsɛmmisa

3

3
10
3
3
10
F.IF.4
F.IF.5
3
7
10
14
F.IF.5
F.IF.6
![]()
Video Check: Select all that apply with regards to the video embedded directly above this item.

![]()
Video Check: Select all that apply with regards to the video embedded directly above this item.

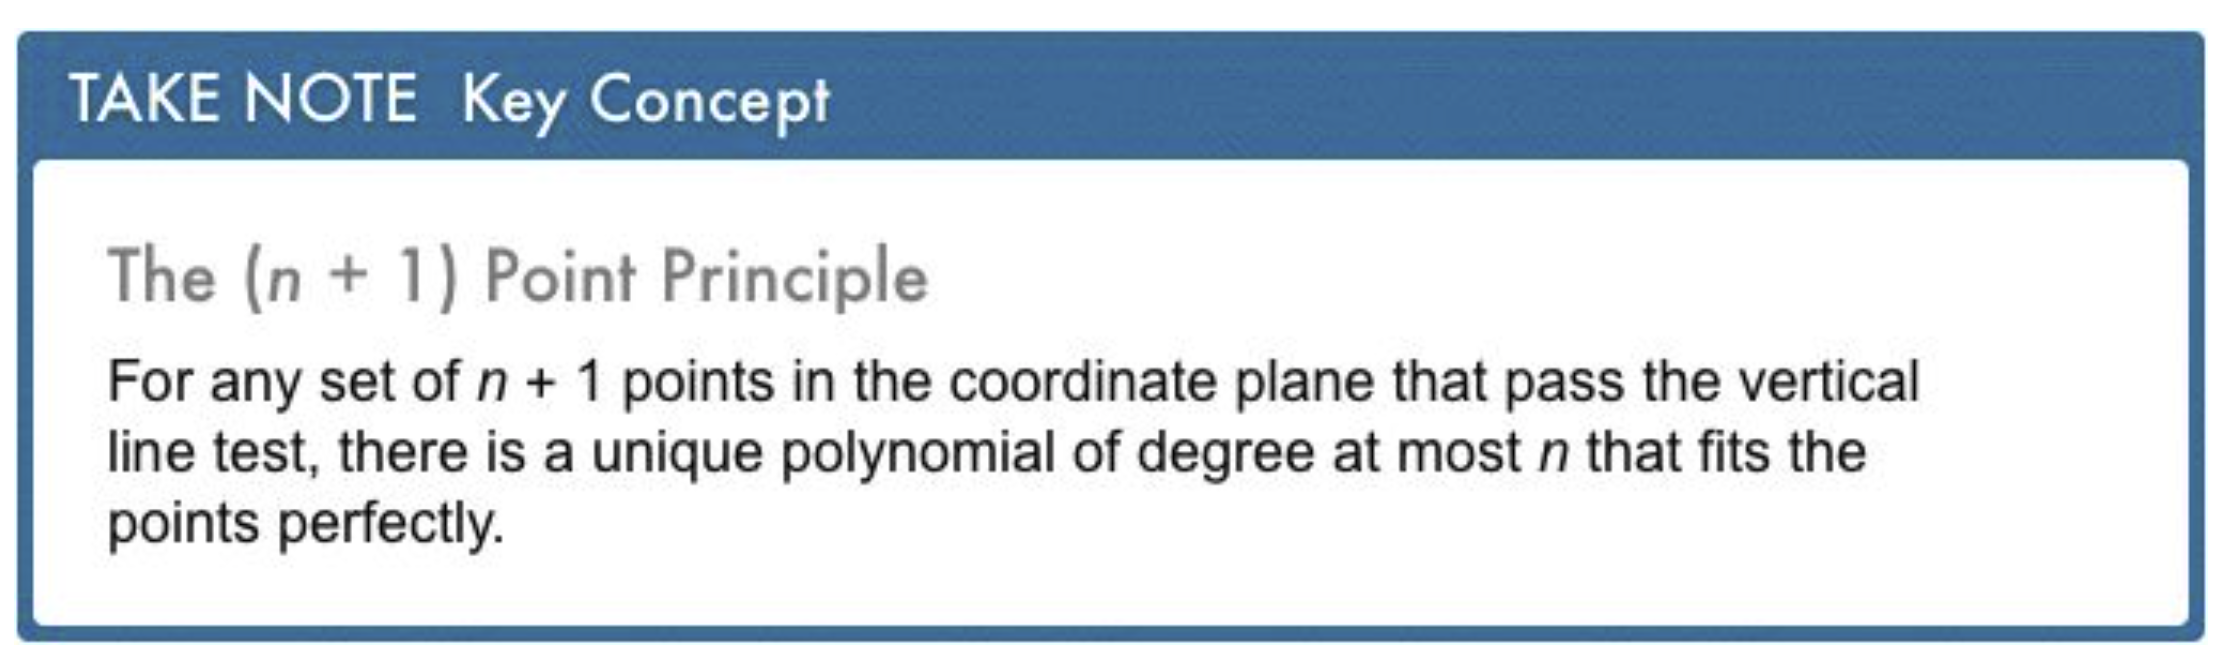
Take Note: Restate The (n + 1) Point Principle in your own words.
![]()
Take Note: Match each Desmos regression notation with the appropriate model.
| Draggable item | arrow_right_alt | Corresponding Item |
|---|---|---|
| arrow_right_alt |
| |
| arrow_right_alt |
| |
| arrow_right_alt |
|
Problem 1 Got It?
![]()
Video Check: Select all that apply with regards to the video embedded directly above this item.
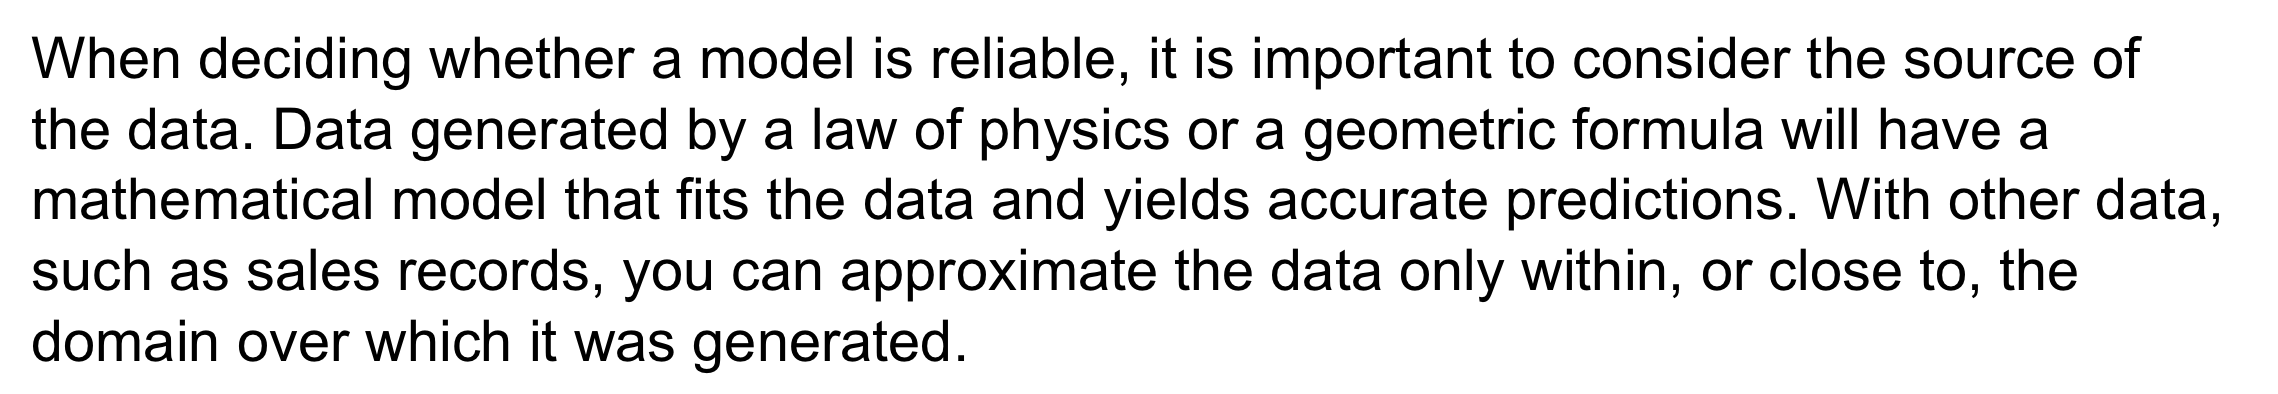
Take Note: Summarize the process of modeling data that is used in Problem 2.
Problem 2 Got It?
![]()
Video Check: Select all that apply with regards to the video embedded directly above this item.
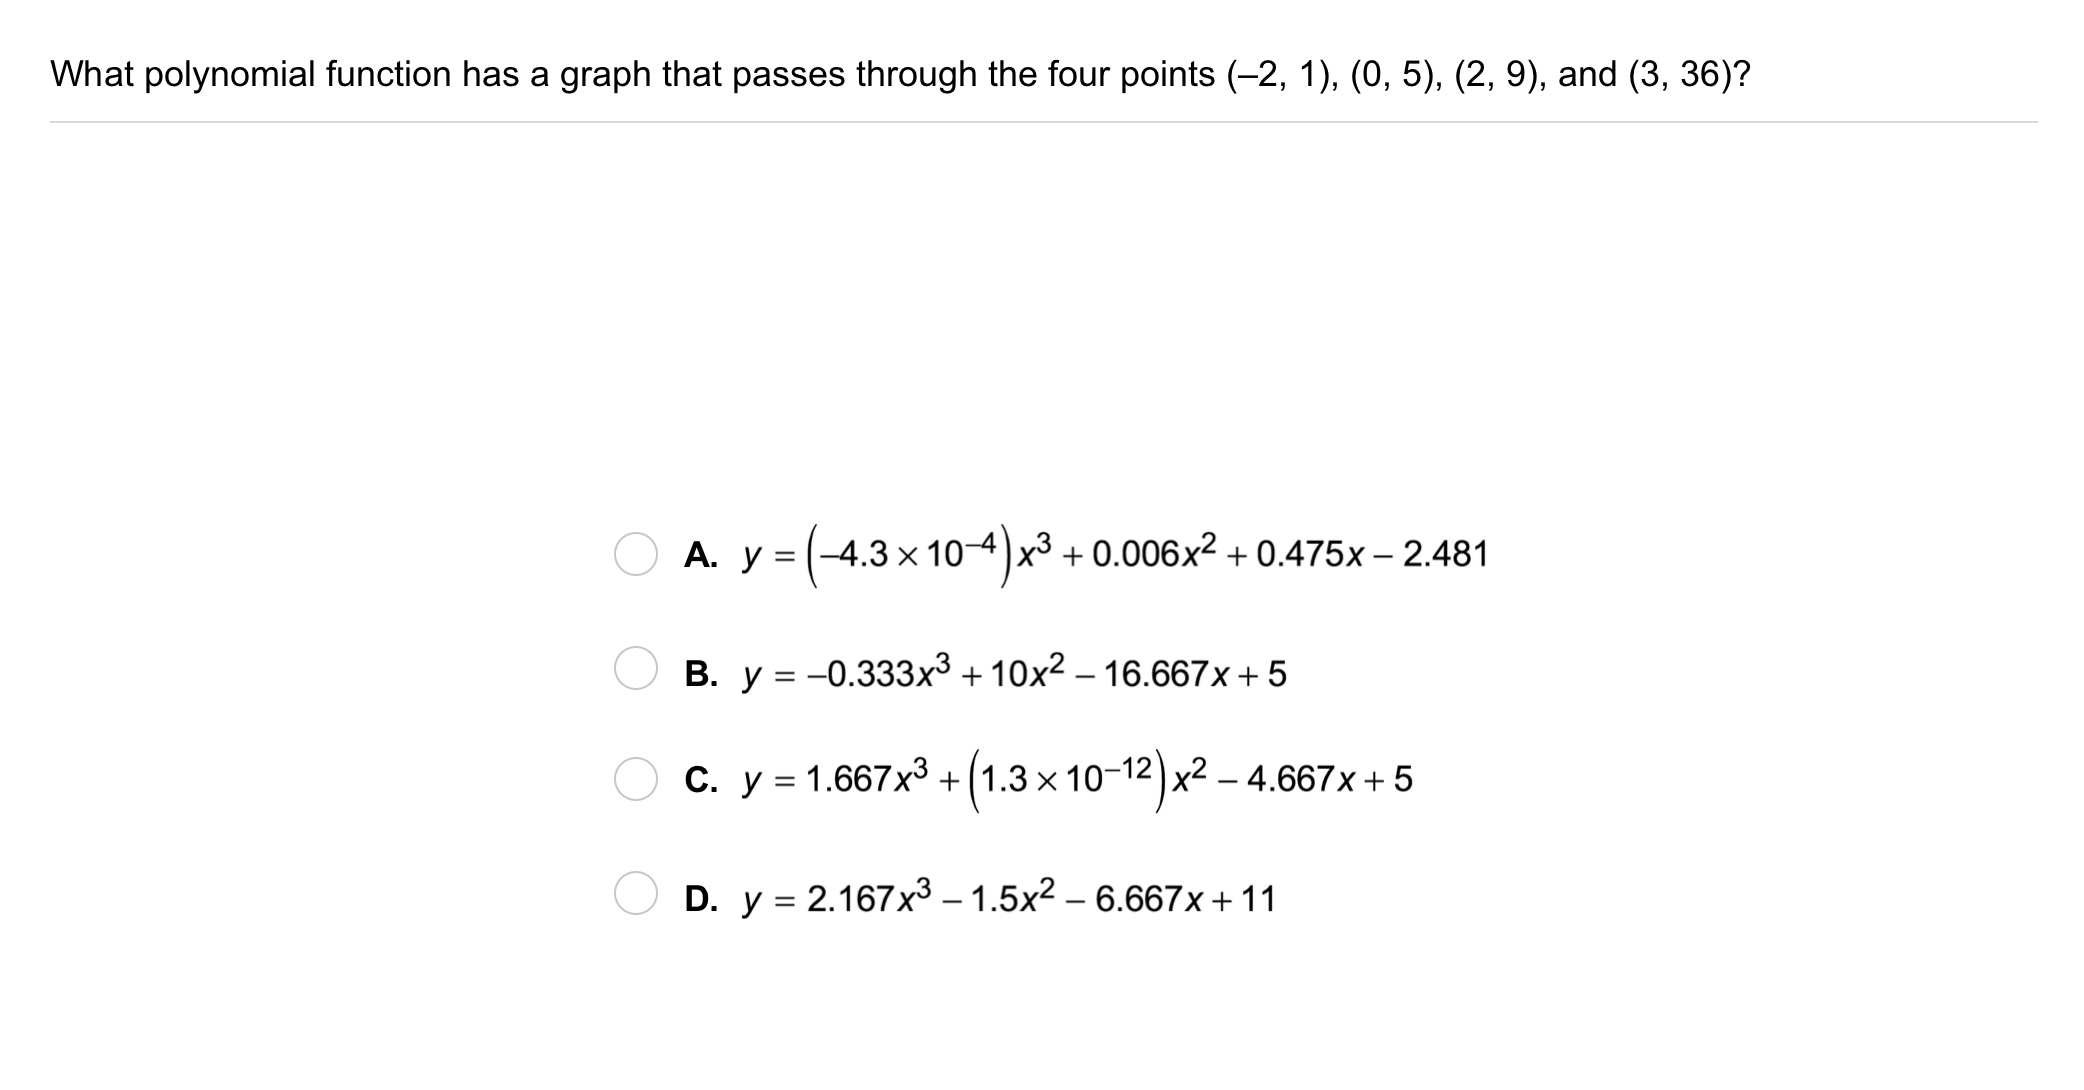
Problem 3 Got It? If four data points are given, which type of regression function can guarantee a perfect fit?
HINT: Recall The (n+1) Point Principle.
![]()
Video Check: Select all that apply with regards to the video embedded directly above this item.
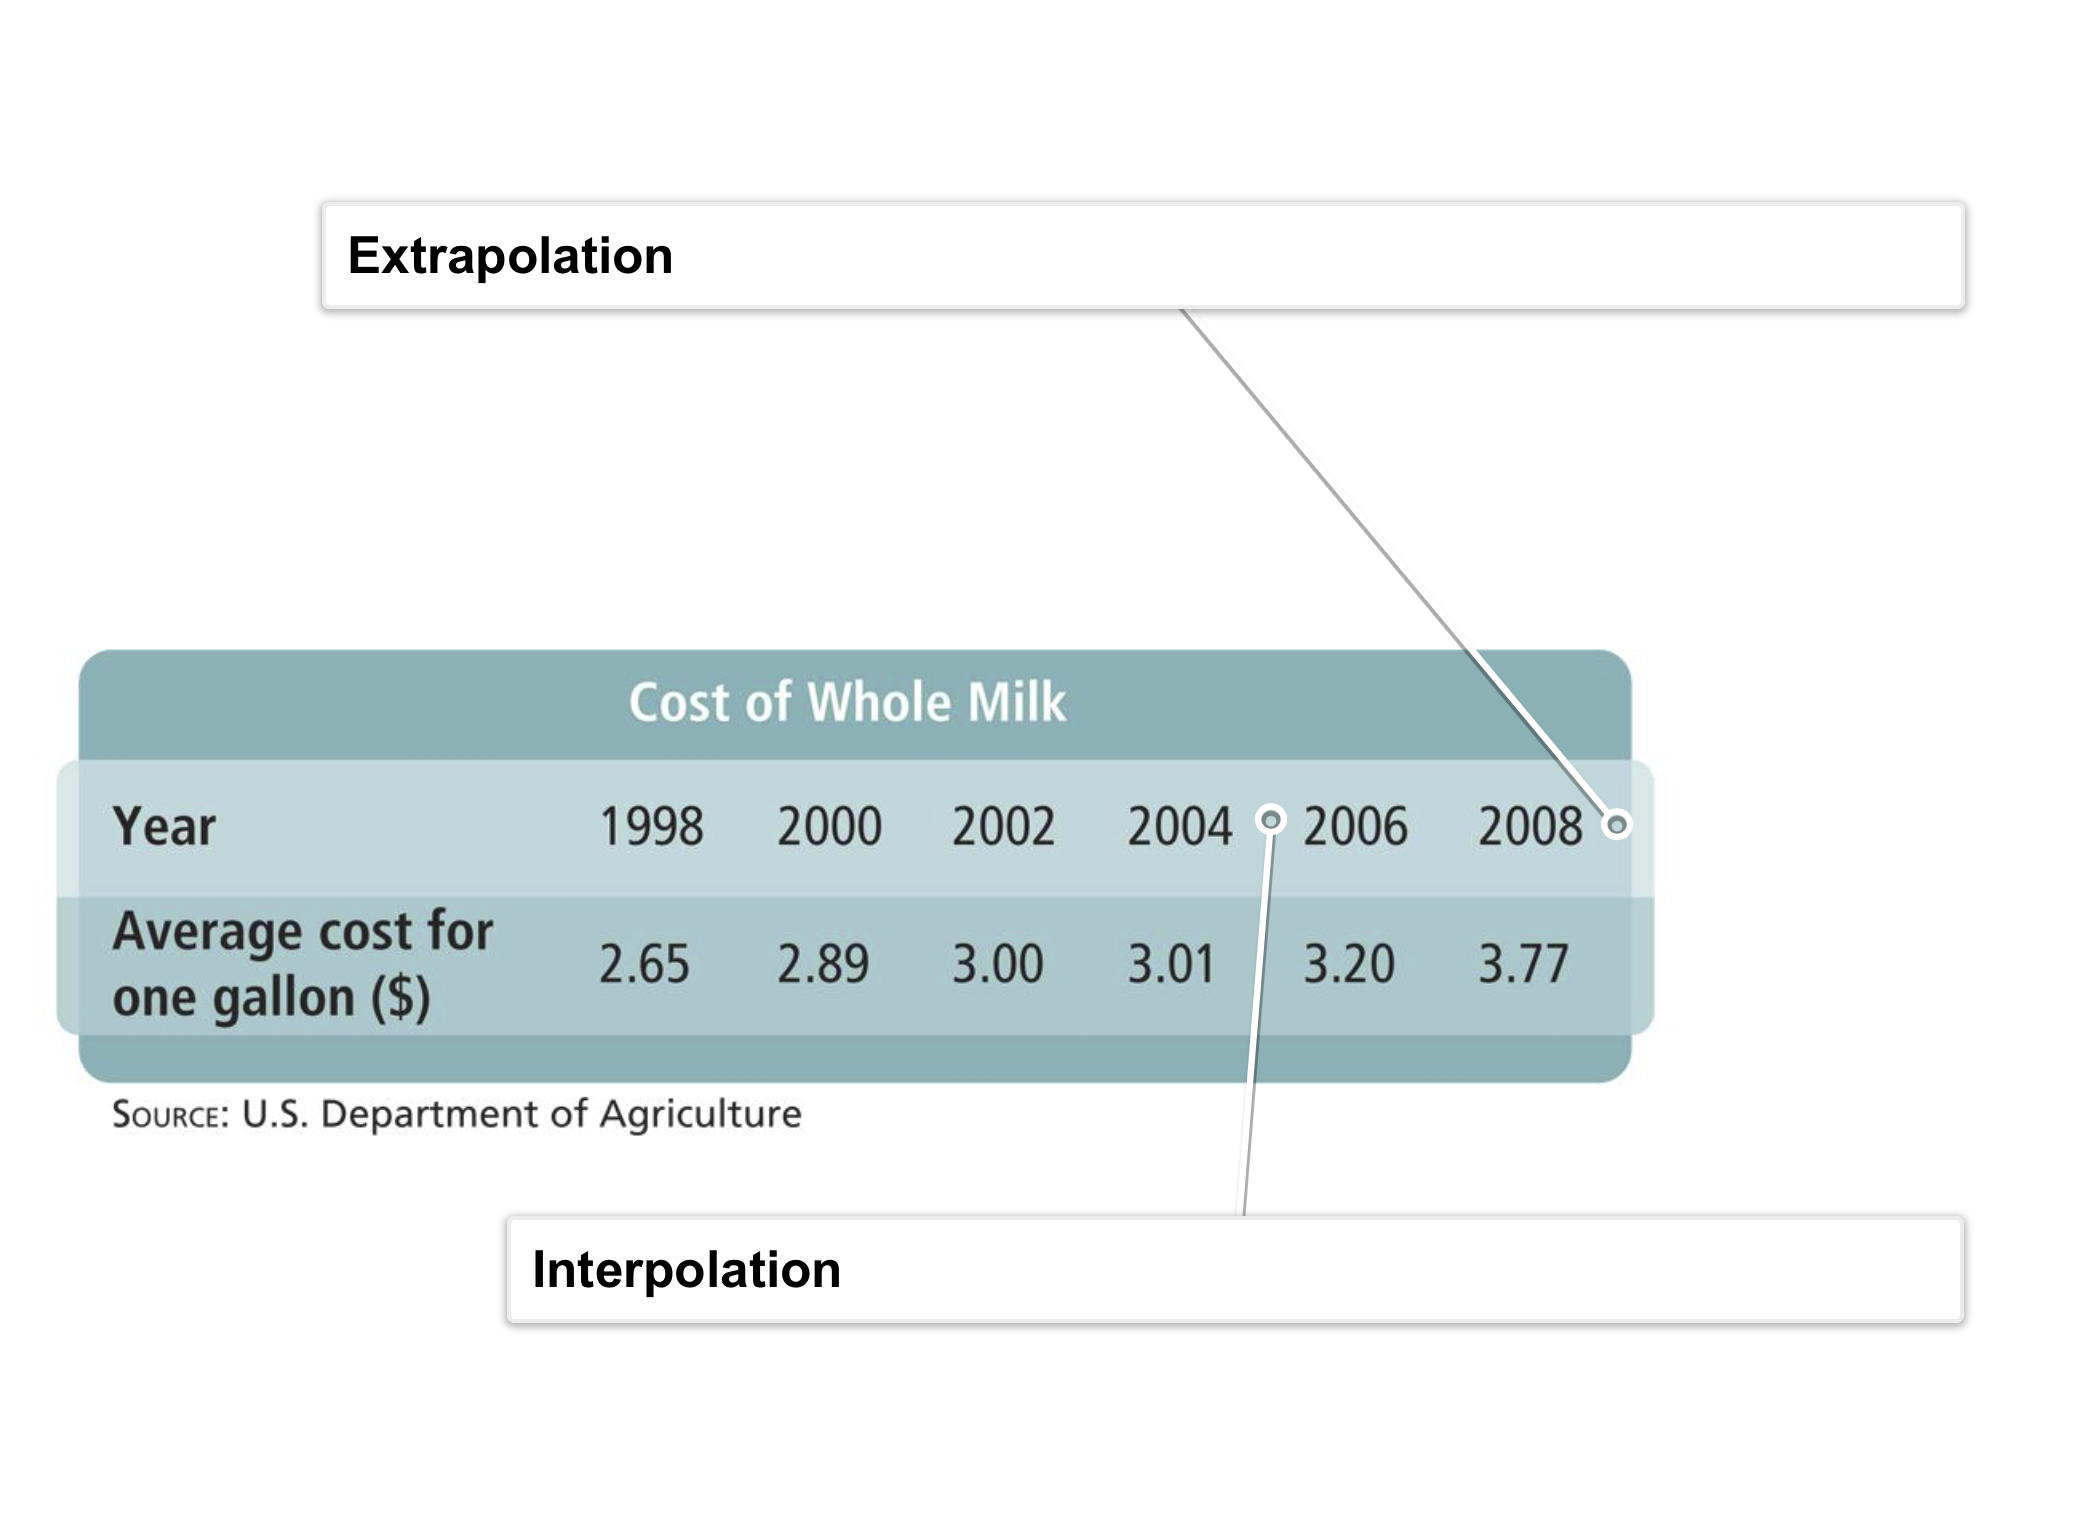
Take Note: Define interpolation. You may use the canvas to help illustrate your written definition.
Take Note: Define extrapolation. You may use the canvas to help illustrate your written definition.
![]()
Take Note: Consider modeling the data in the table.
![]()
Classify each year in the left column below based on whether estimating cheese consumption that year is an example of interpolation or extrapolation.
1995
2005
1890
2000
2050
2019
1950
Interpolation
Extrapolation
Problem 4 Got It?
Create a table at desmos.com and use it to find a linear regression model of the cheese consumption data. Let x = years since 1900. Recall Desmos' linear regression notation: y1~ax1+b.
Zoom and pan your graph to establish an appropriate viewing window that contains all data points and the regression line.
Take a screenshot of your graph and upload or paste it to the Formative canvas.

Problem 4 Got It? Use the model you created above to estimate cheese consumption for 1980, 2000, and 2012 algebraically and/or graphically. Remember that you were instructed to let x represent years since 1900.
Also, identify the prediction years in which you can have the most and least confidence.
Hint: Consider interpolation vs extrapolation.
26.31 lb
23.07 lb
21.53 lb
17.7 lb
1980
2000
2012
Estimated consumption in 1980
Estimated consumption in 2000
Estimated consumption in 2012
Two prediction years with greatest confidence
Prediction year with least confidence

🧠 Retrieval Practice:
Summarize the mathematical content of this lesson. What topics, ideas, and vocabulary were introduced?
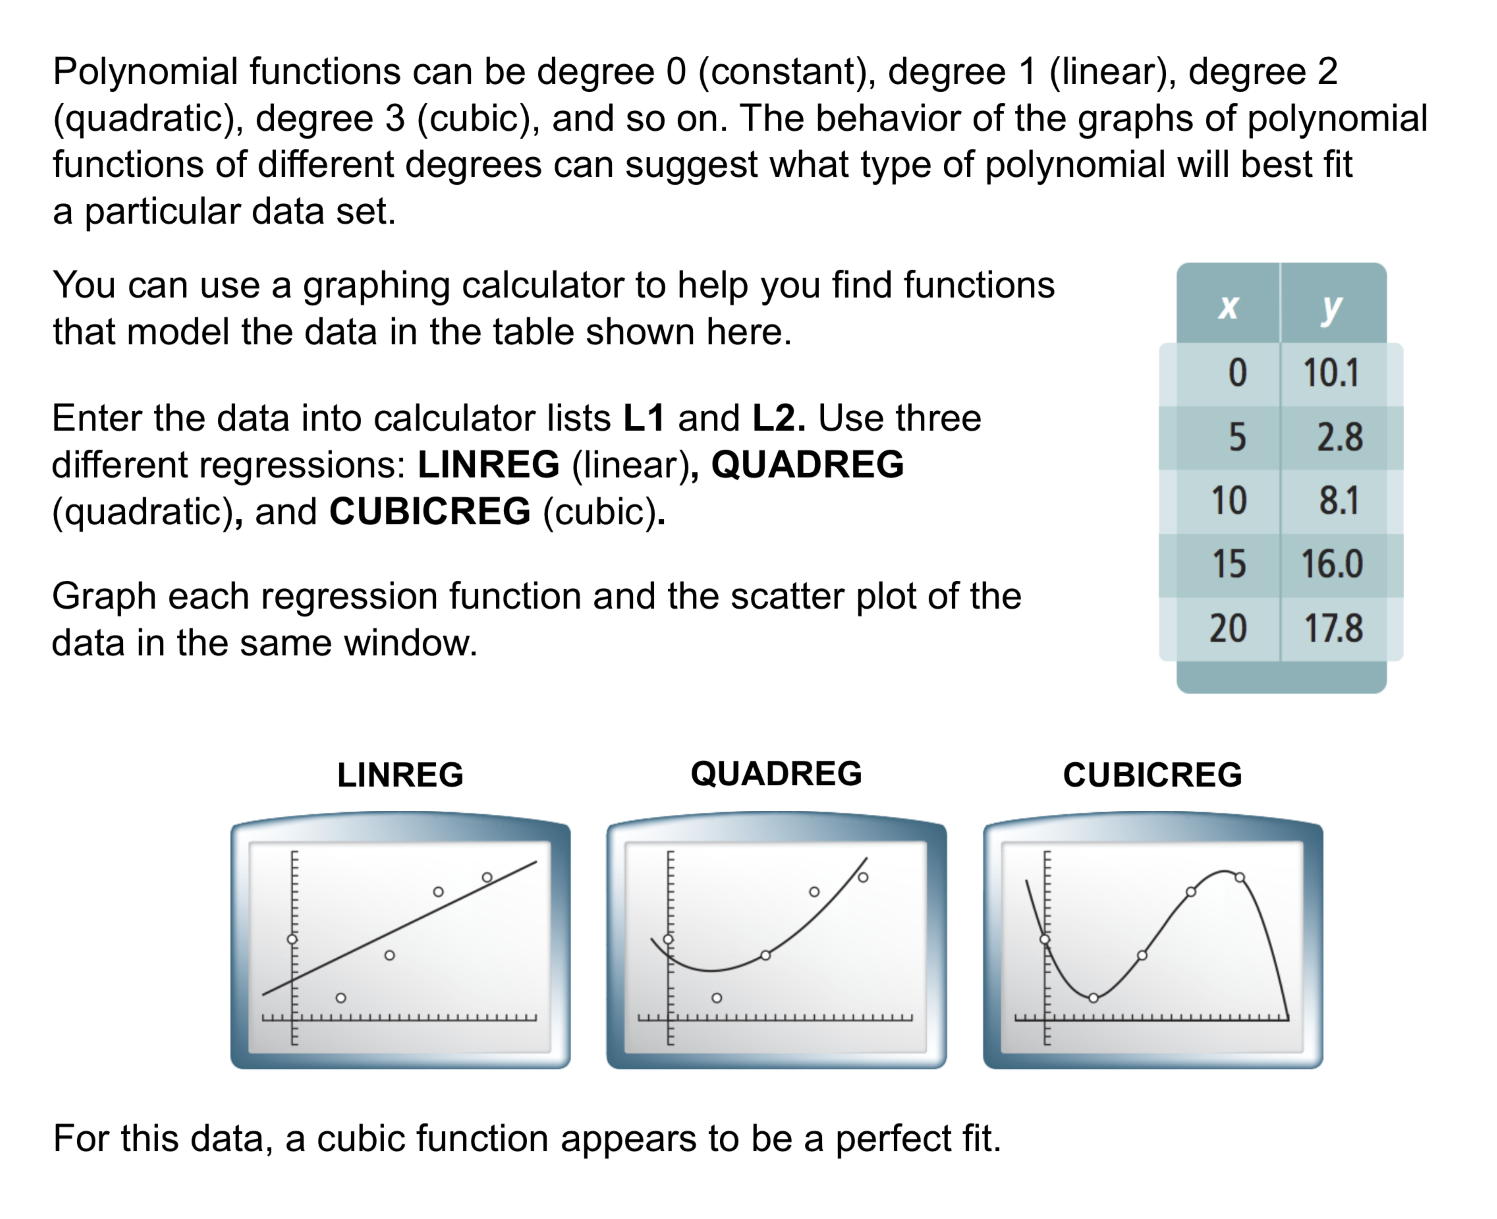
Solve It! Based on the pattern in the table, find the total area when x is 5.
Solve It! What type of polynomial function does the data fit? Explain.


