Algebra 2 8-3 Guided Practice: Rational Functions and Their Graphs
star
star
star
star
star
Last updated over 3 years ago
34 Nsɛmmisa

3
10
10


3
20
A.APR.3
3
3
12
3
30
A.APR.3
3
10
5
![]()
Video Check: Select all that apply with regards to the video embedded directly above this item.
Solve It! Last season, you made 40% of your basketball shots. The Game 1 shot chart shows that you did not start the season so well.
![]()
Starting with Game 2, how many consecutive shots must you make to raise this season's percentage to 40%?
Solve It! Last season, you made 40% of your basketball shots. The Game 1 shot chart shows that you did not start the season so well.
![]()
If you never miss another shot this season, is it possible to raise your percentage to 99%? 100%? Explain your reasoning.
![]()
Video Check: Select all that apply with regards to the video embedded directly above this item.

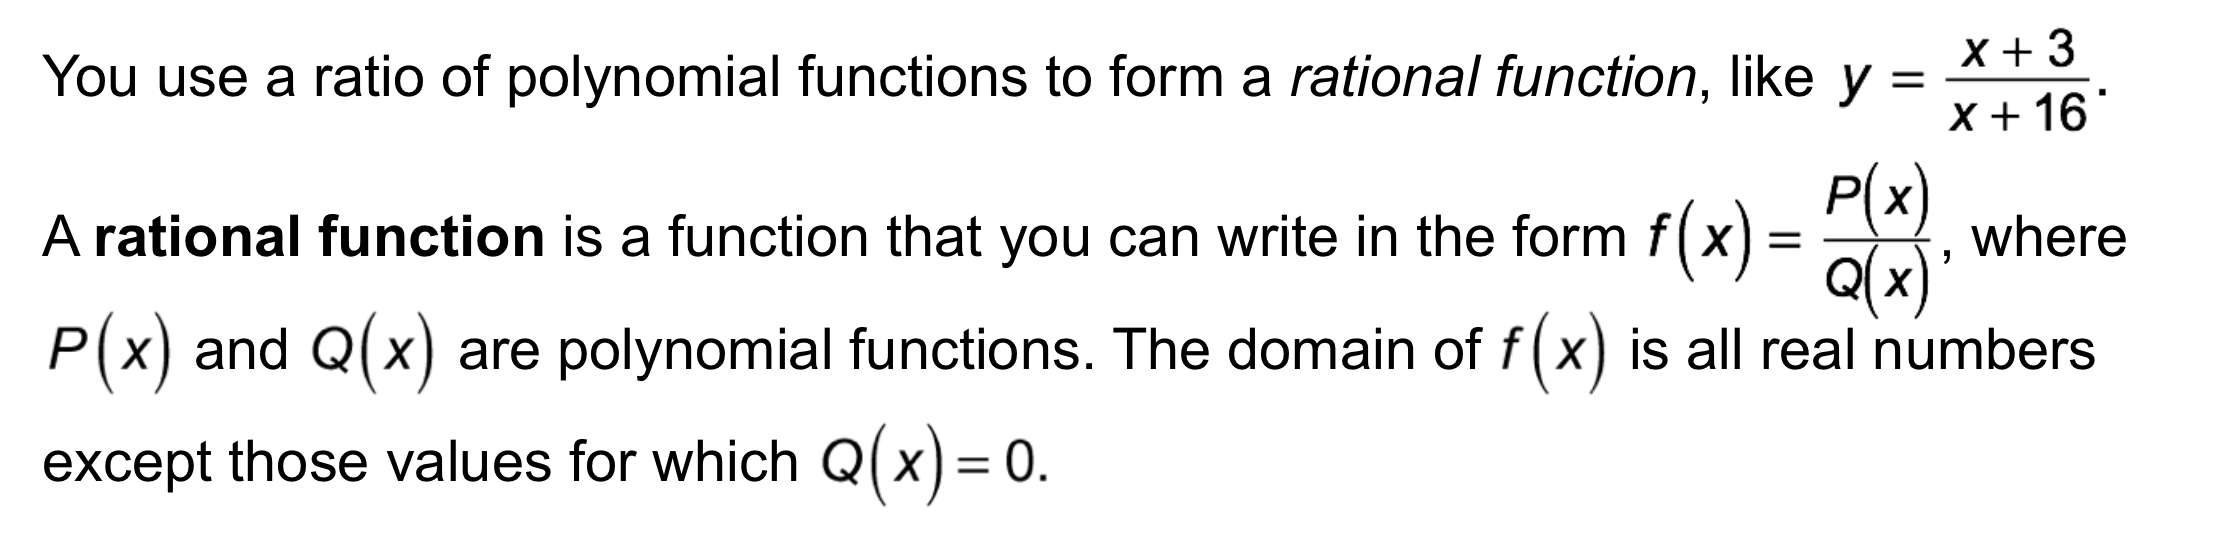
Take Note: Define rational function.
Take Note: Provide an example of a rational function.
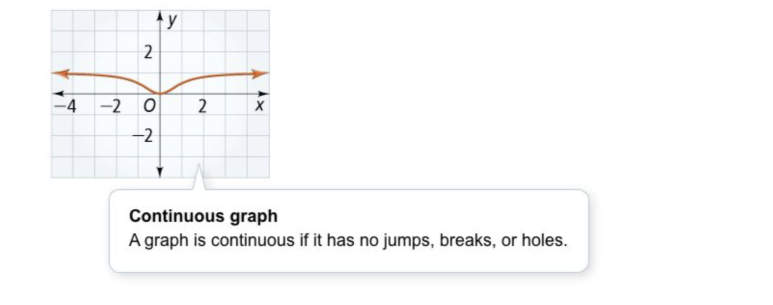
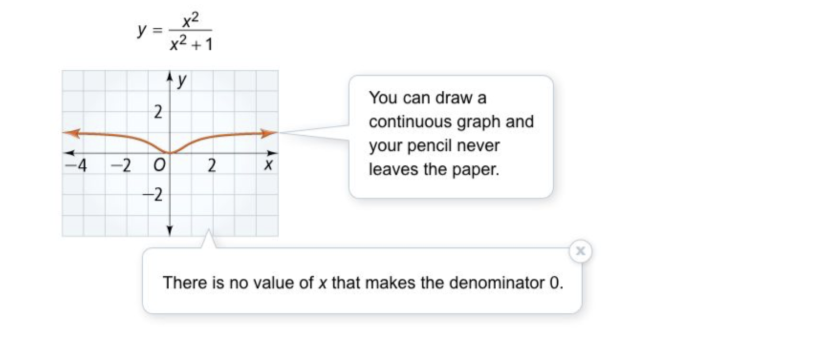
Take Note: What is a continuous graph?
Take Note: What is a point of discontinuity?
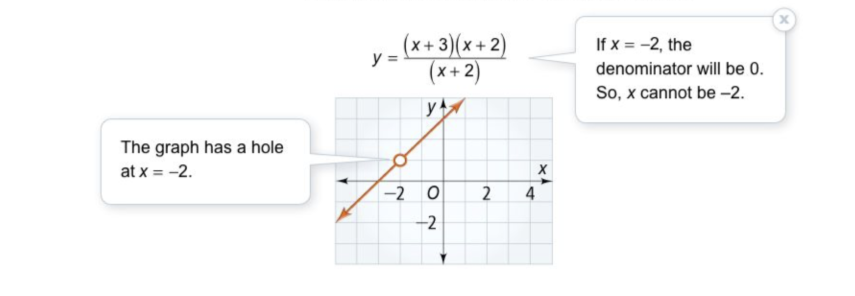
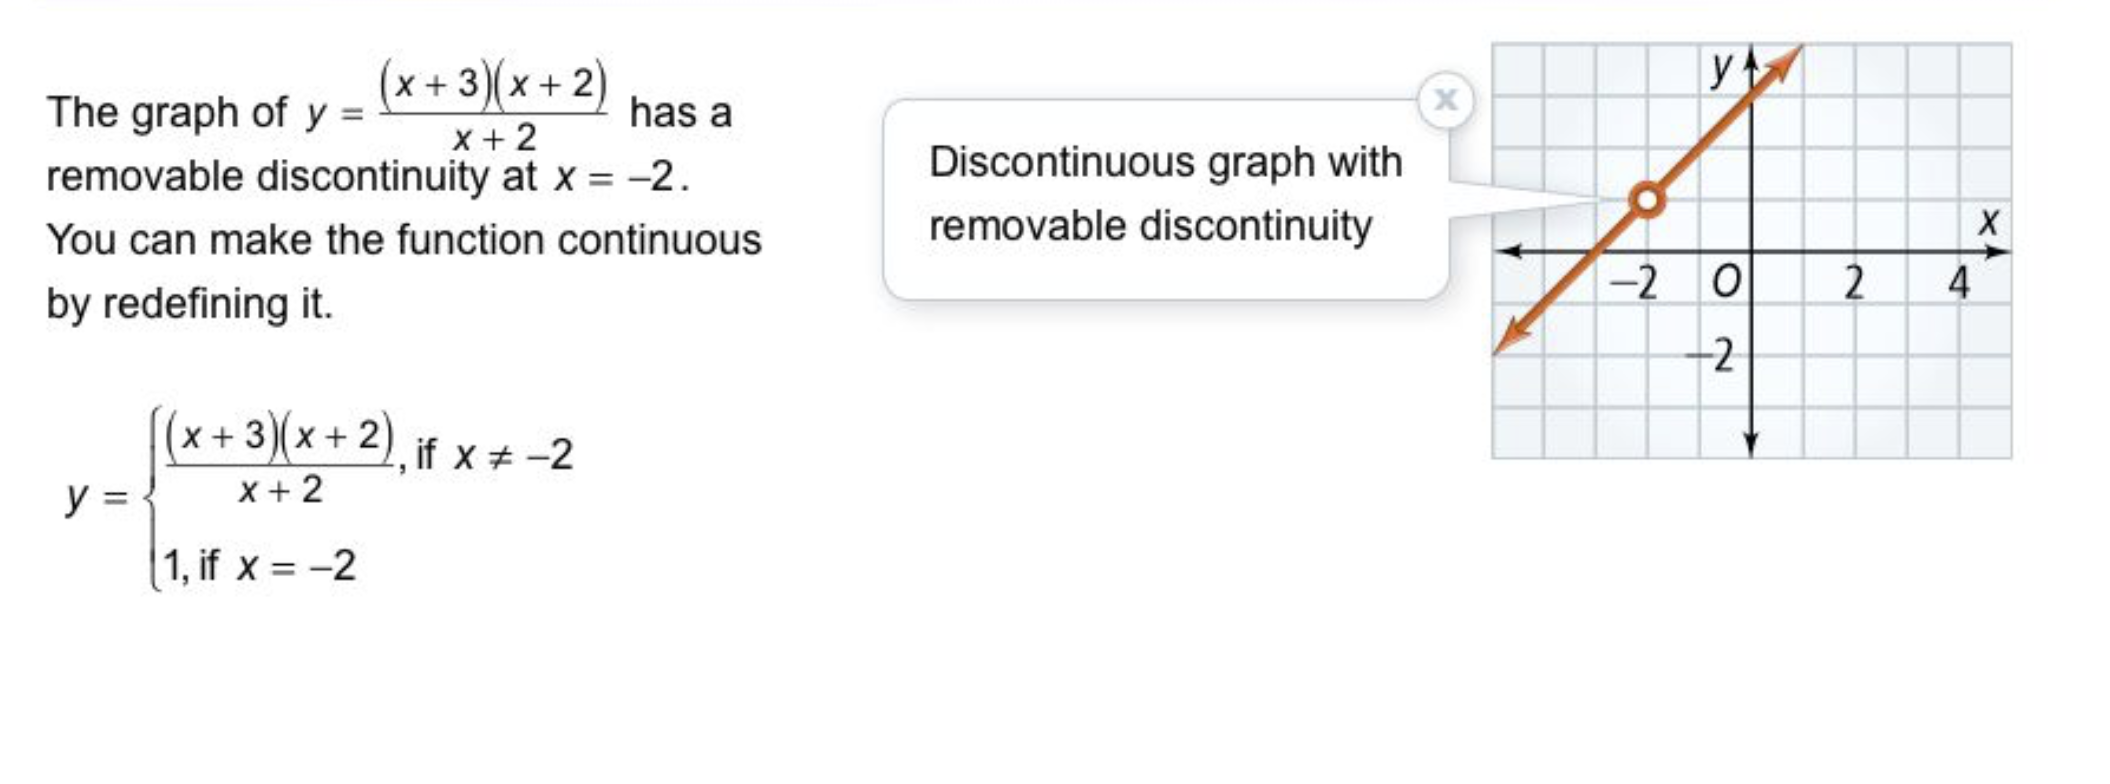
Take Note: What is a removable discontinuity?
Take Note: Sketch a graph with a removable discontinuity at
Problem 1 Got It? Consider the rational functions on the right.
Use the items on the left to identify each function's:
◆ Domain
◆ Points of discontinuity (and the type of discontinuity each represents: removable or non-removable)
◆ x- and y- intercepts
domain: all real numbers
domain: all real numbers except x = ±4
domain: all real numbers except x = -2, -1
no points of discontinuity
non-removable discontinuity at x = ±4
removable discontinuity at x = -2
non-removable discontinuity at x = -2
removable discontinuity at x = -1
no x-intercept
x-intercept: (1, 0)
x-intercept: (-1, 0)
y-intercept: (0, -1/16)
y-intercept: (0, 1/2)
y-intercept: (0, -1/3)
![]()
Video Check: Select all that apply with regards to the video embedded directly above this item.
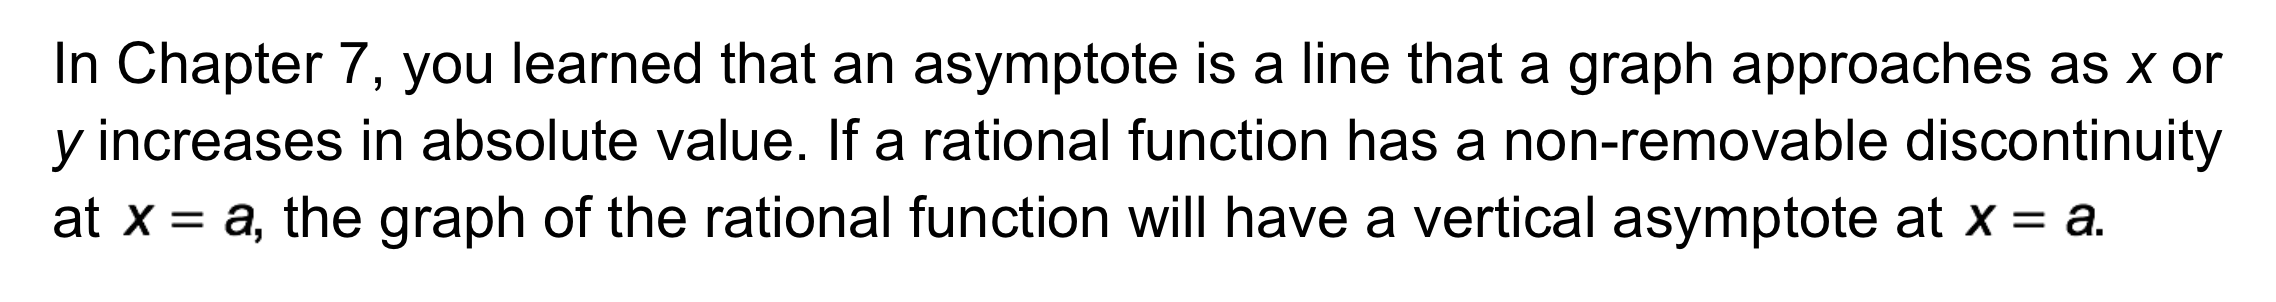
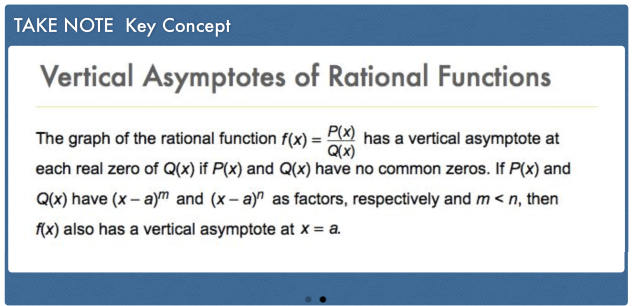
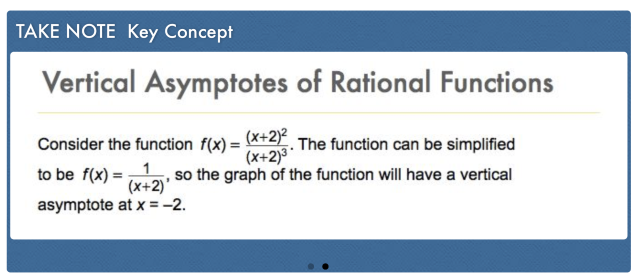
Take Note: How can you find the vertical asymptotes of rational functions?
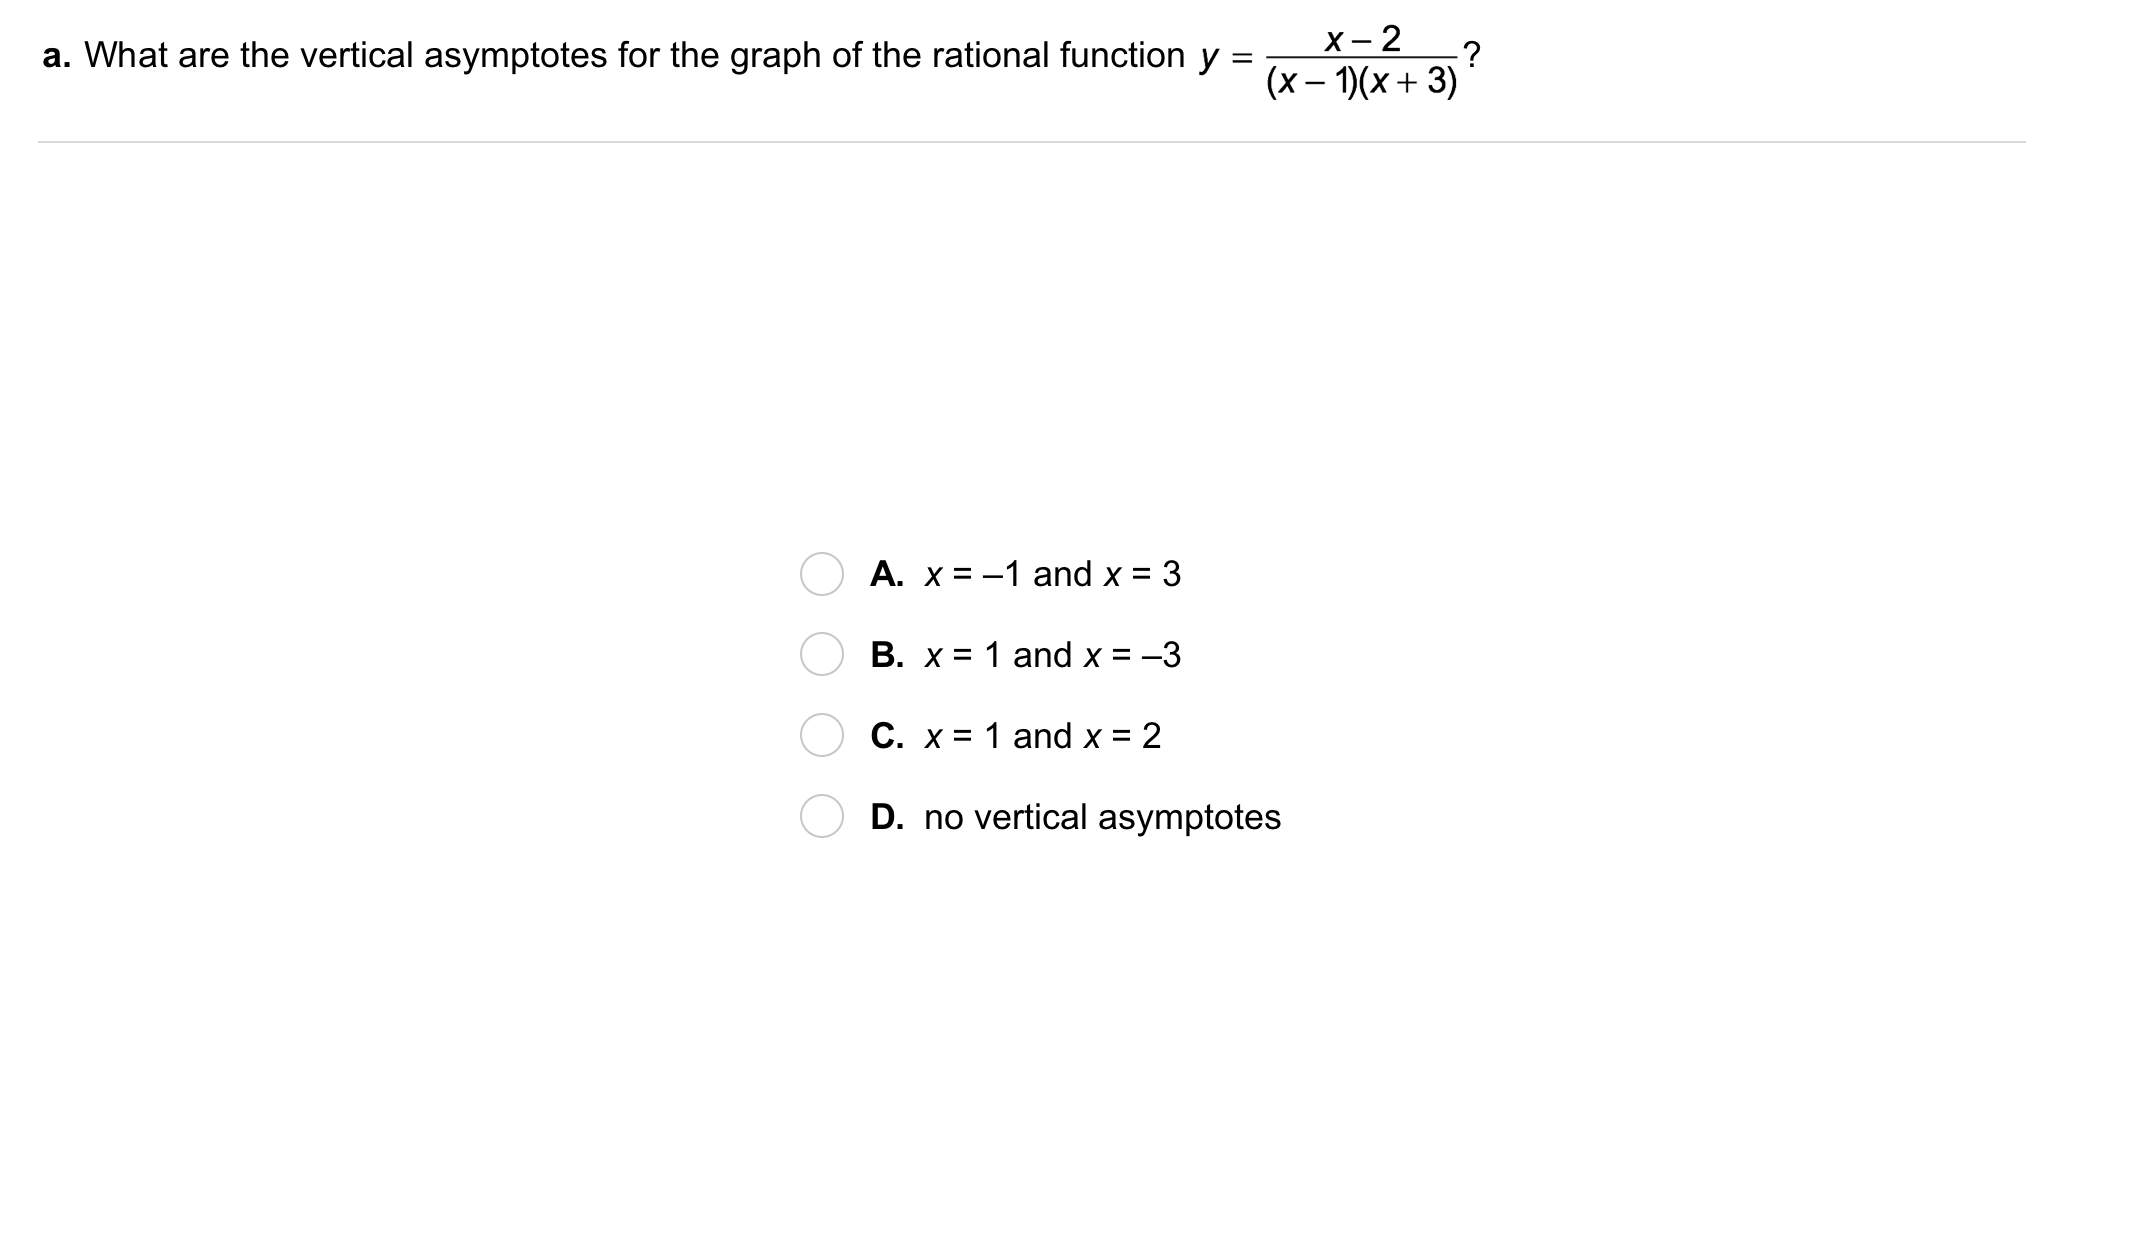
Problem 2 Got It?

Problem 2 Got It?
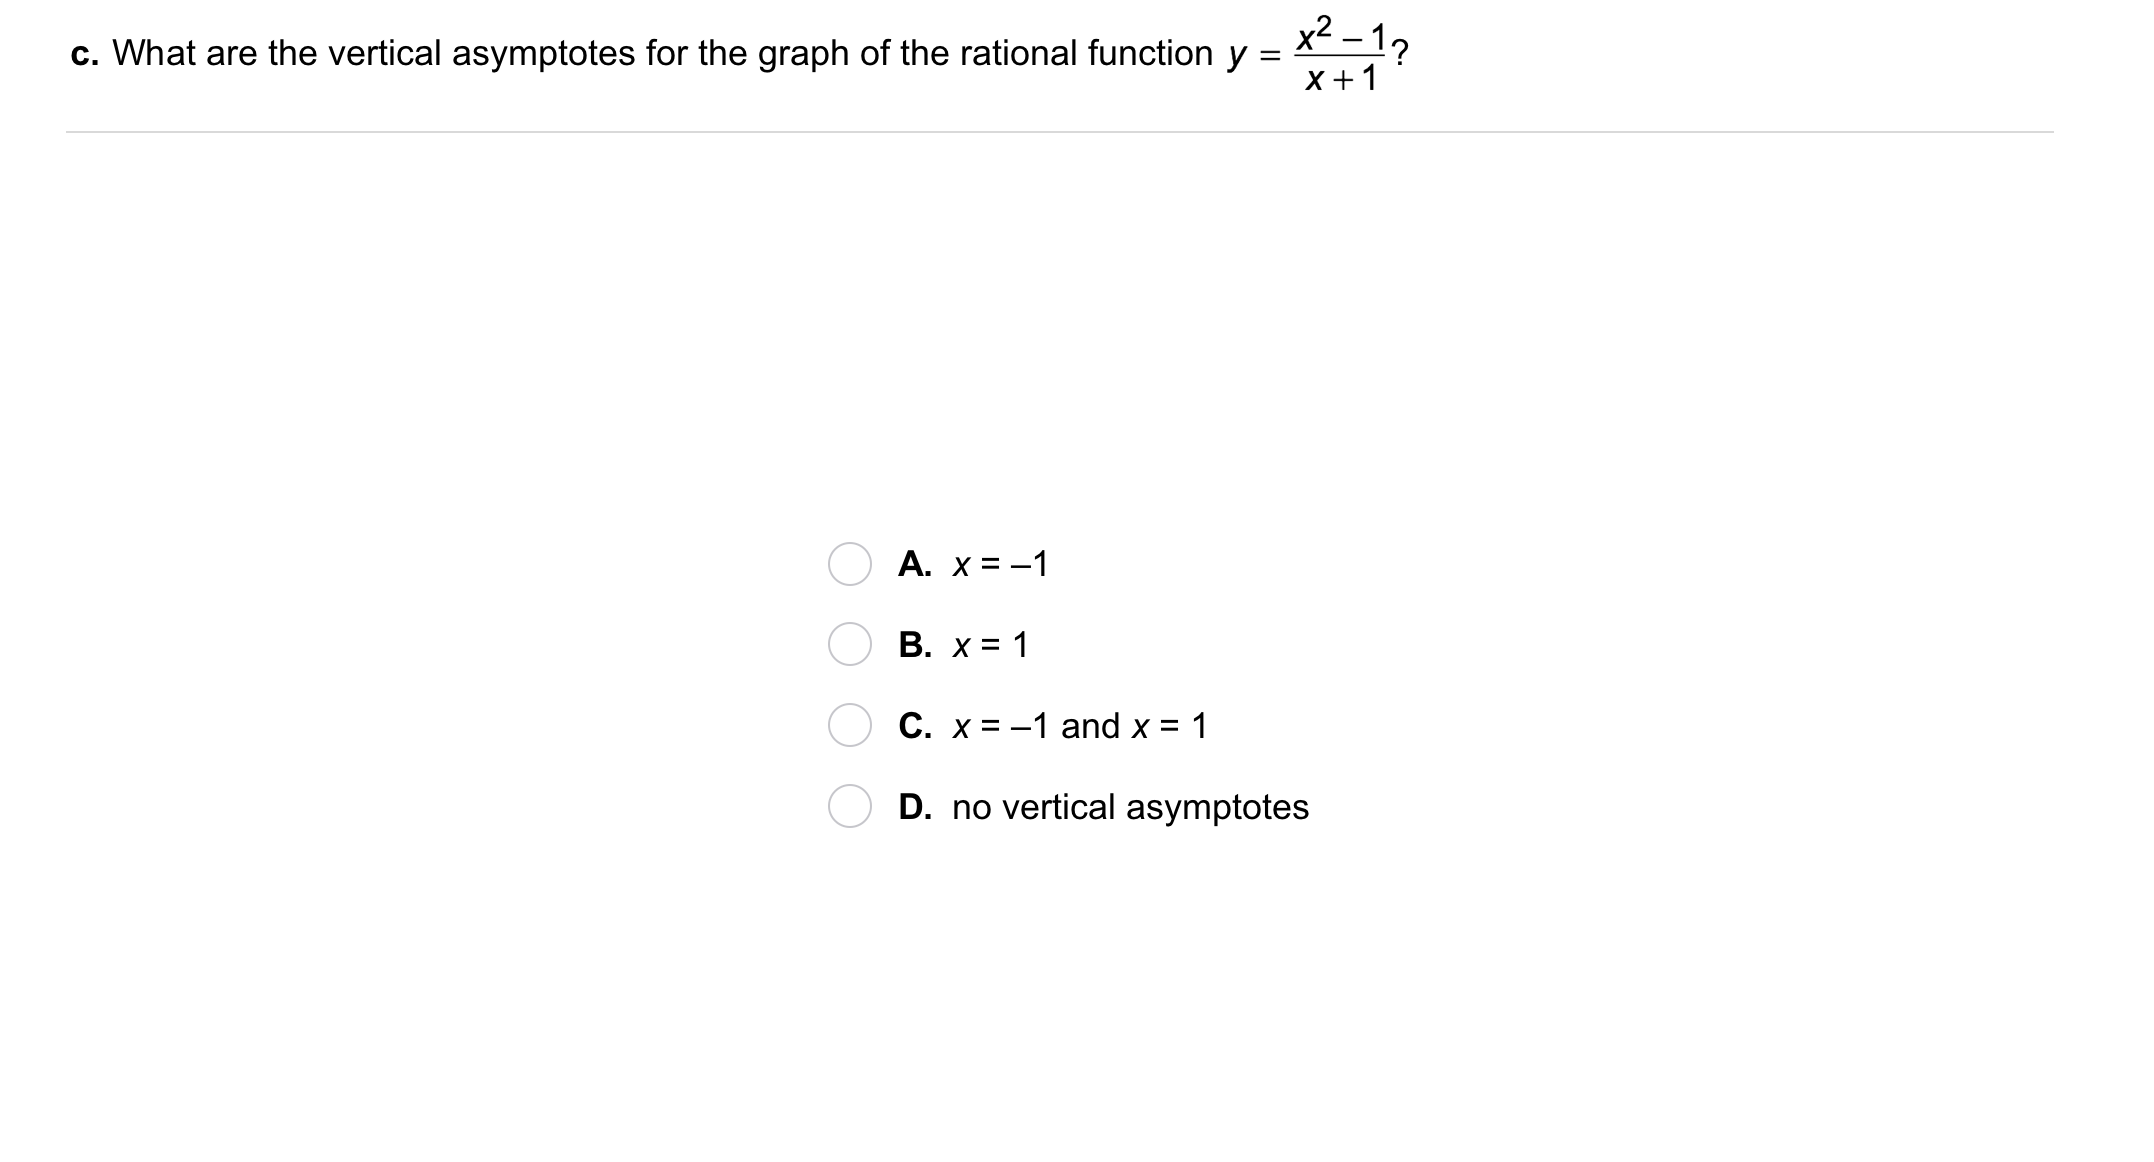
Problem 2 Got It?
![]()
Video Check: Select all that apply with regards to the video embedded directly above this item.
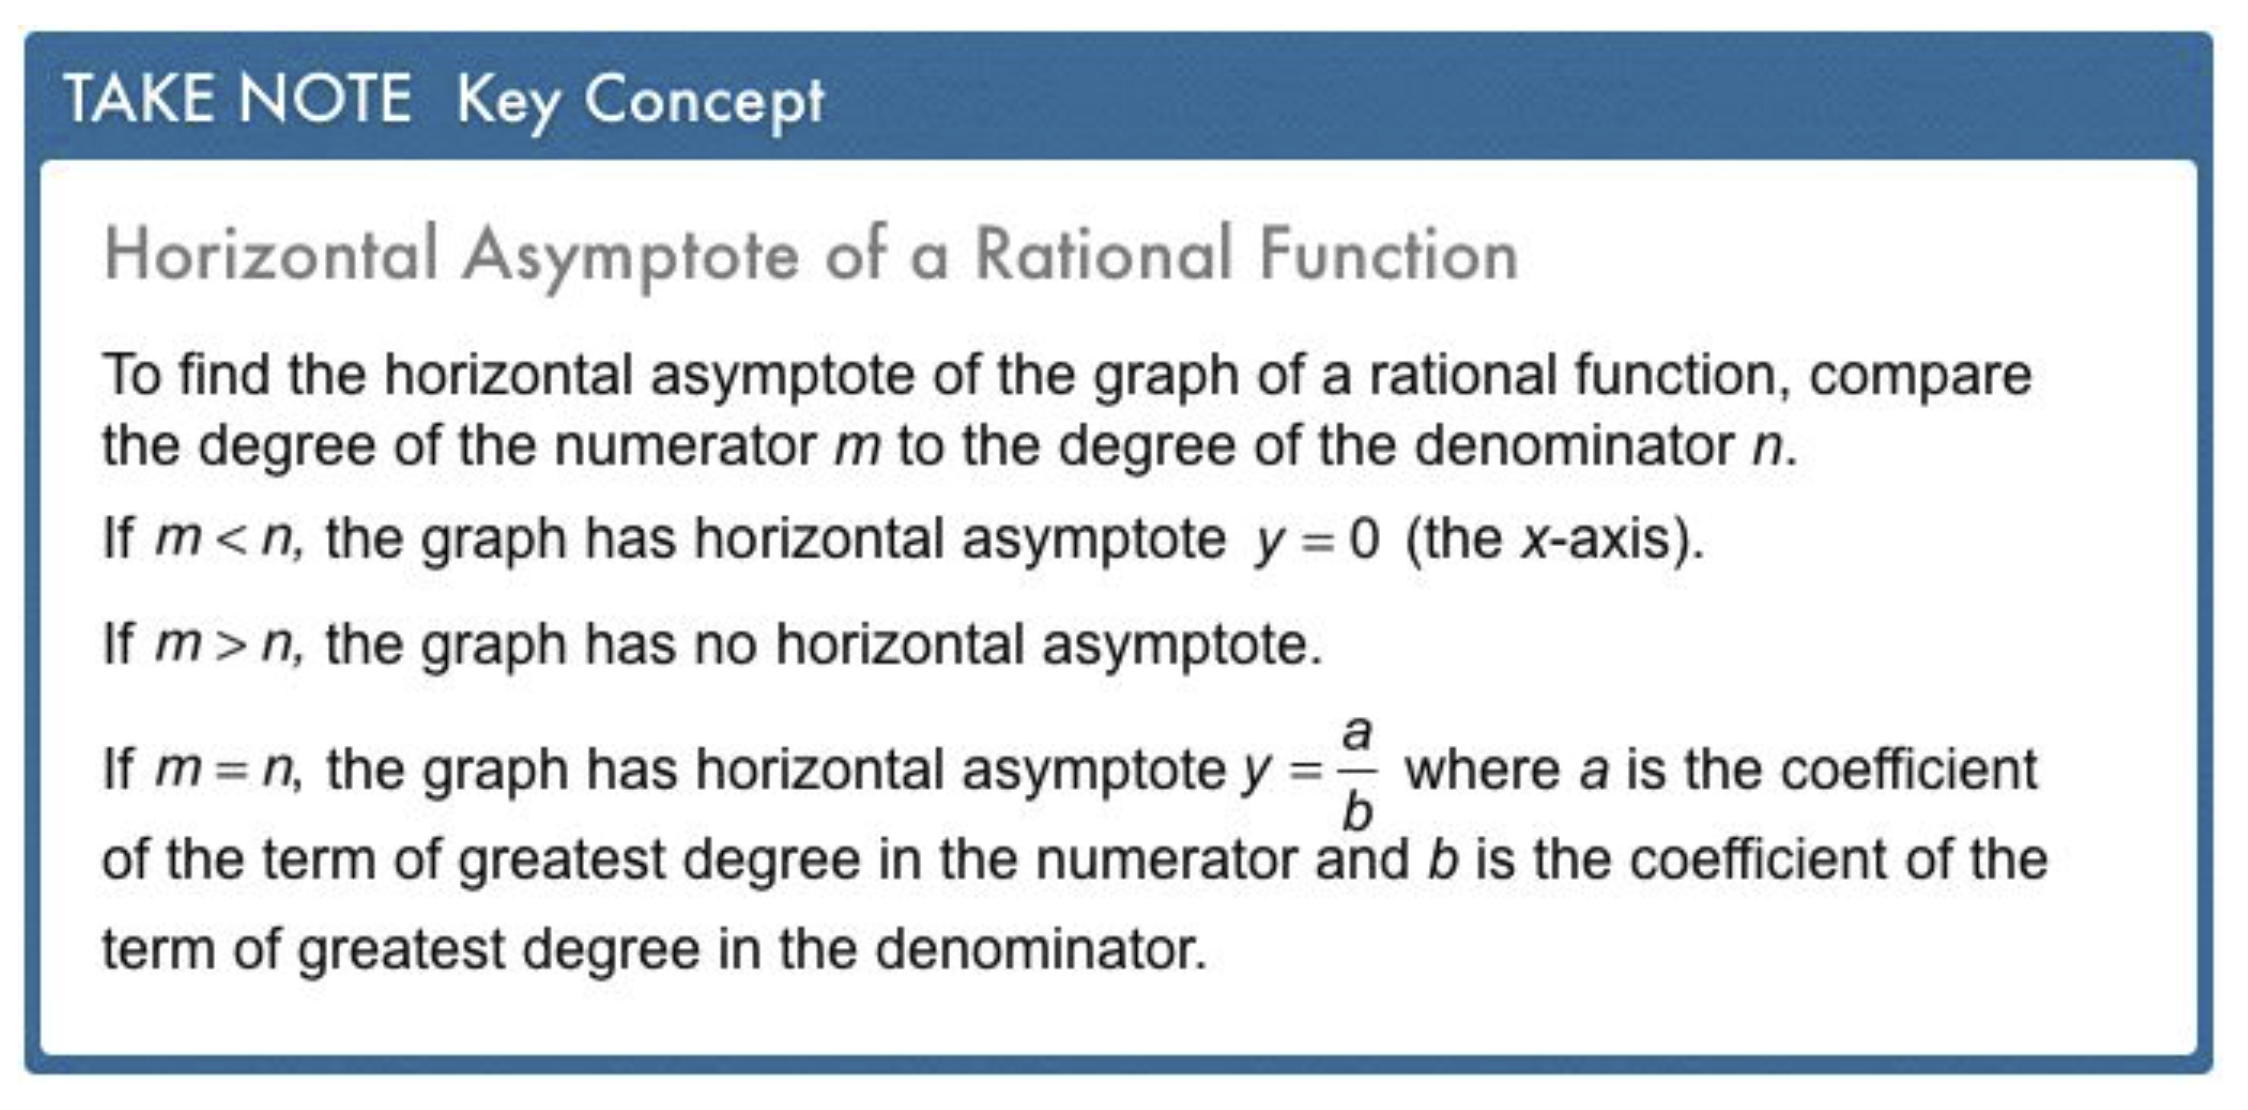
Take Note: How can you find the horizontal asymptotes of rational functions?
![]()
Take Note: Use your understanding of the horizontal asymptotes of rational functions to match the corresponding items below.
| Draggable item | arrow_right_alt | Corresponding Item |
|---|---|---|
The degree of the numerator is greater than the degree of the denominator. | arrow_right_alt | The the horizontal asymptote is |
The degree of the numerator and denominator are the same. | arrow_right_alt | The horizontal asymptote is the x-axis. |
The degree of the numerator is less than the degree of the denominator. | arrow_right_alt | The graph has no horizontal asymptote. |
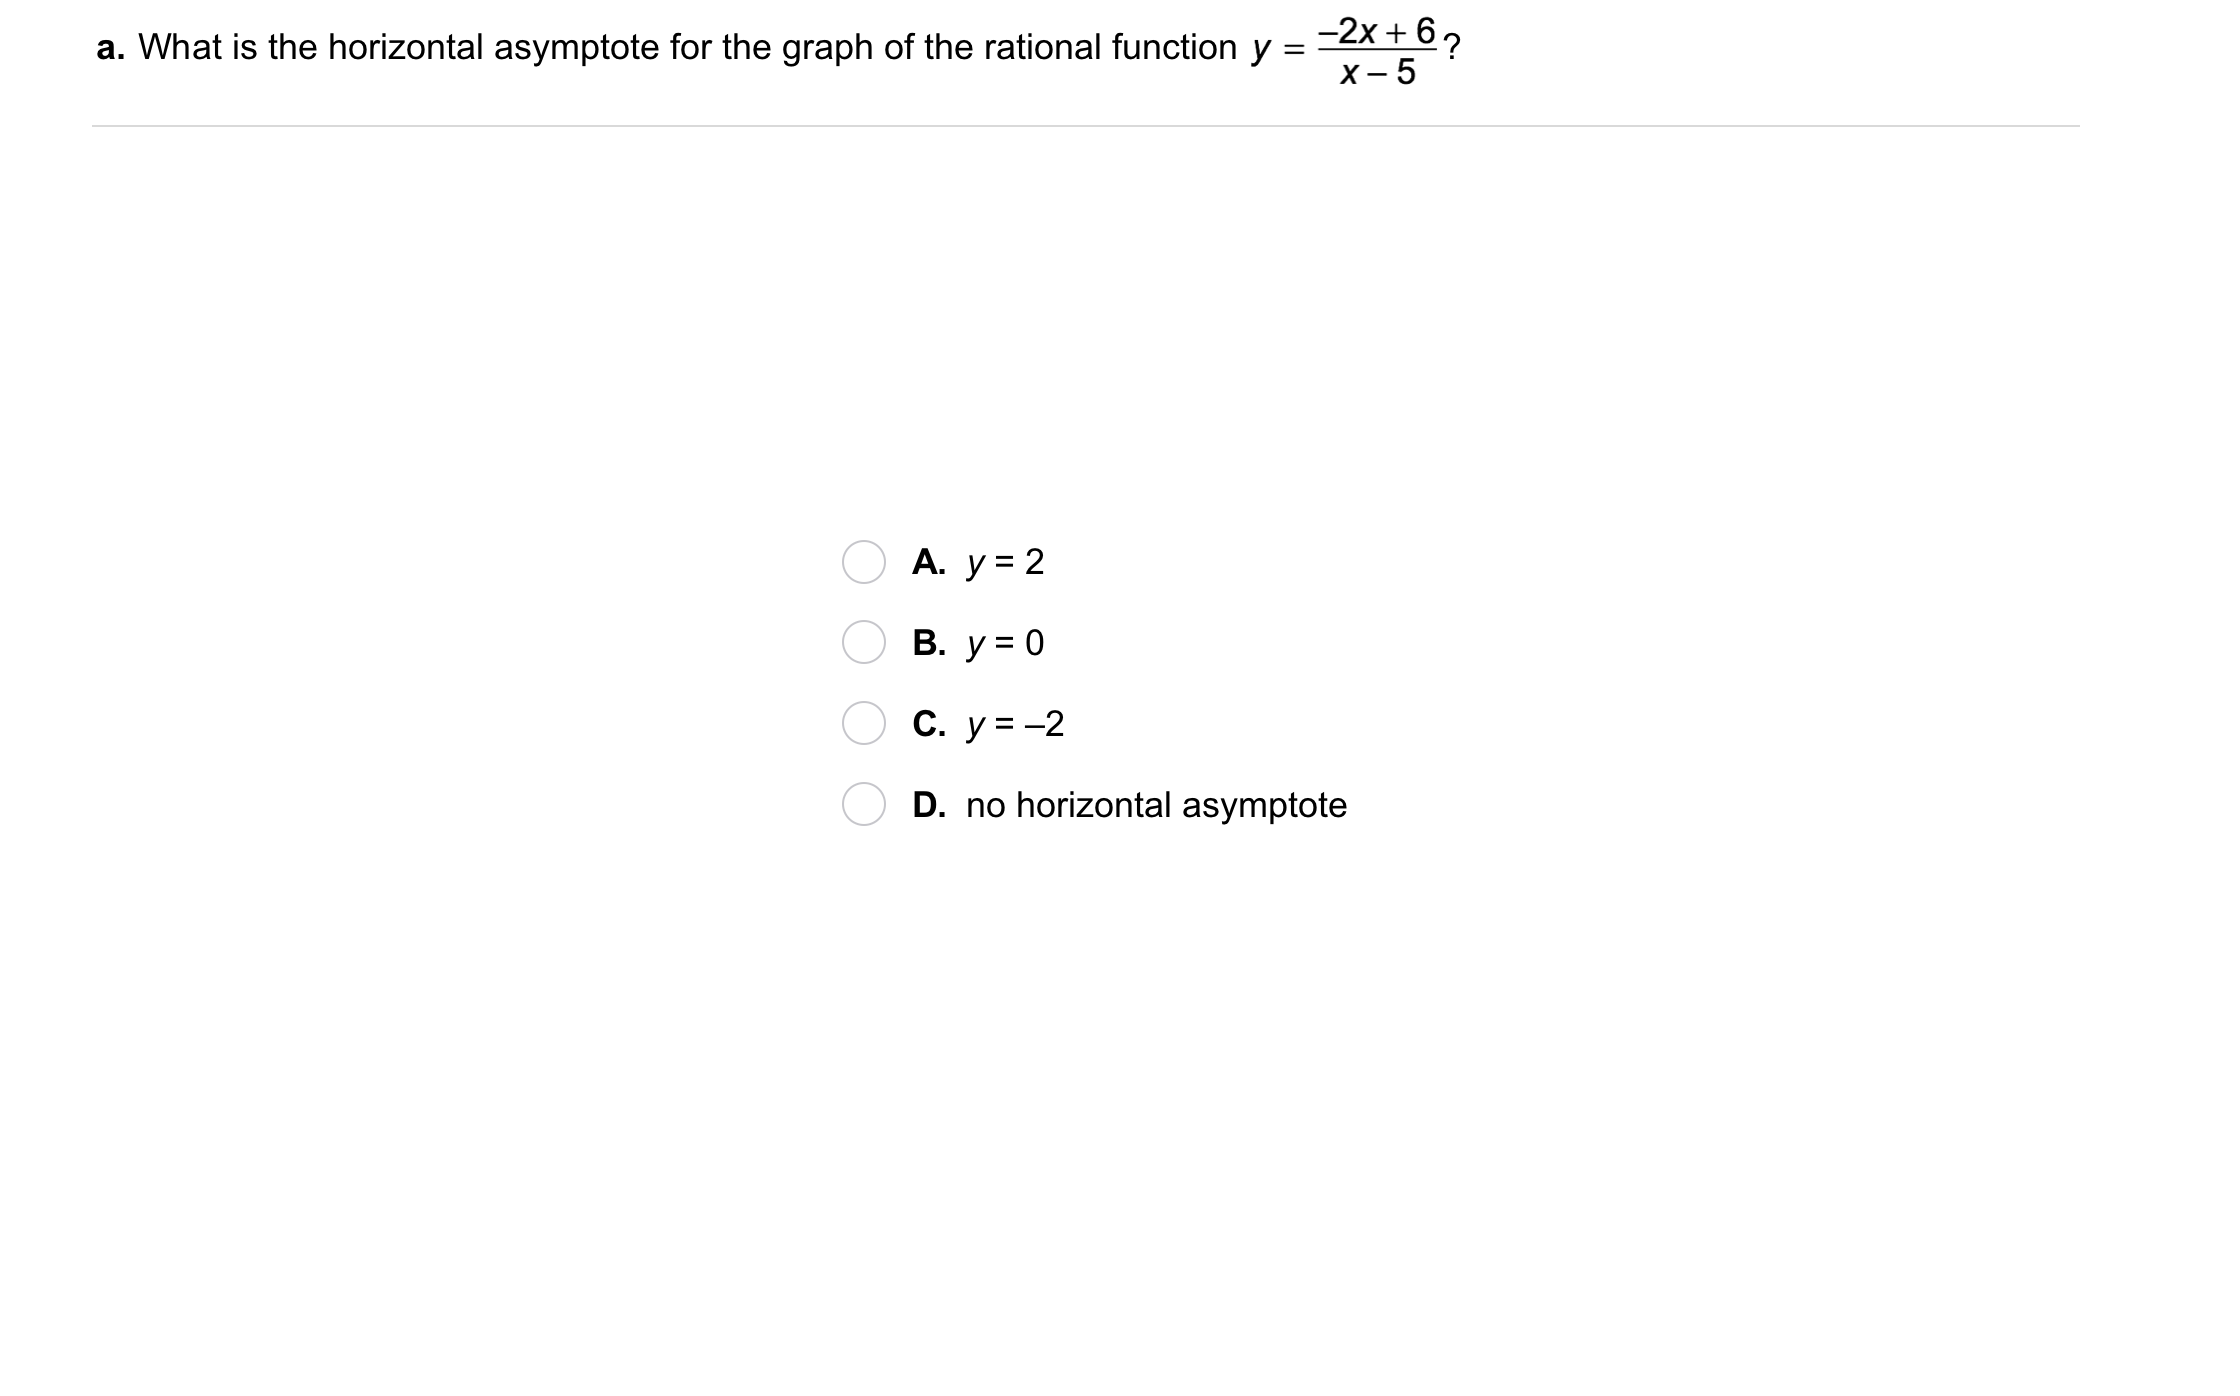
Problem 3 Got It?
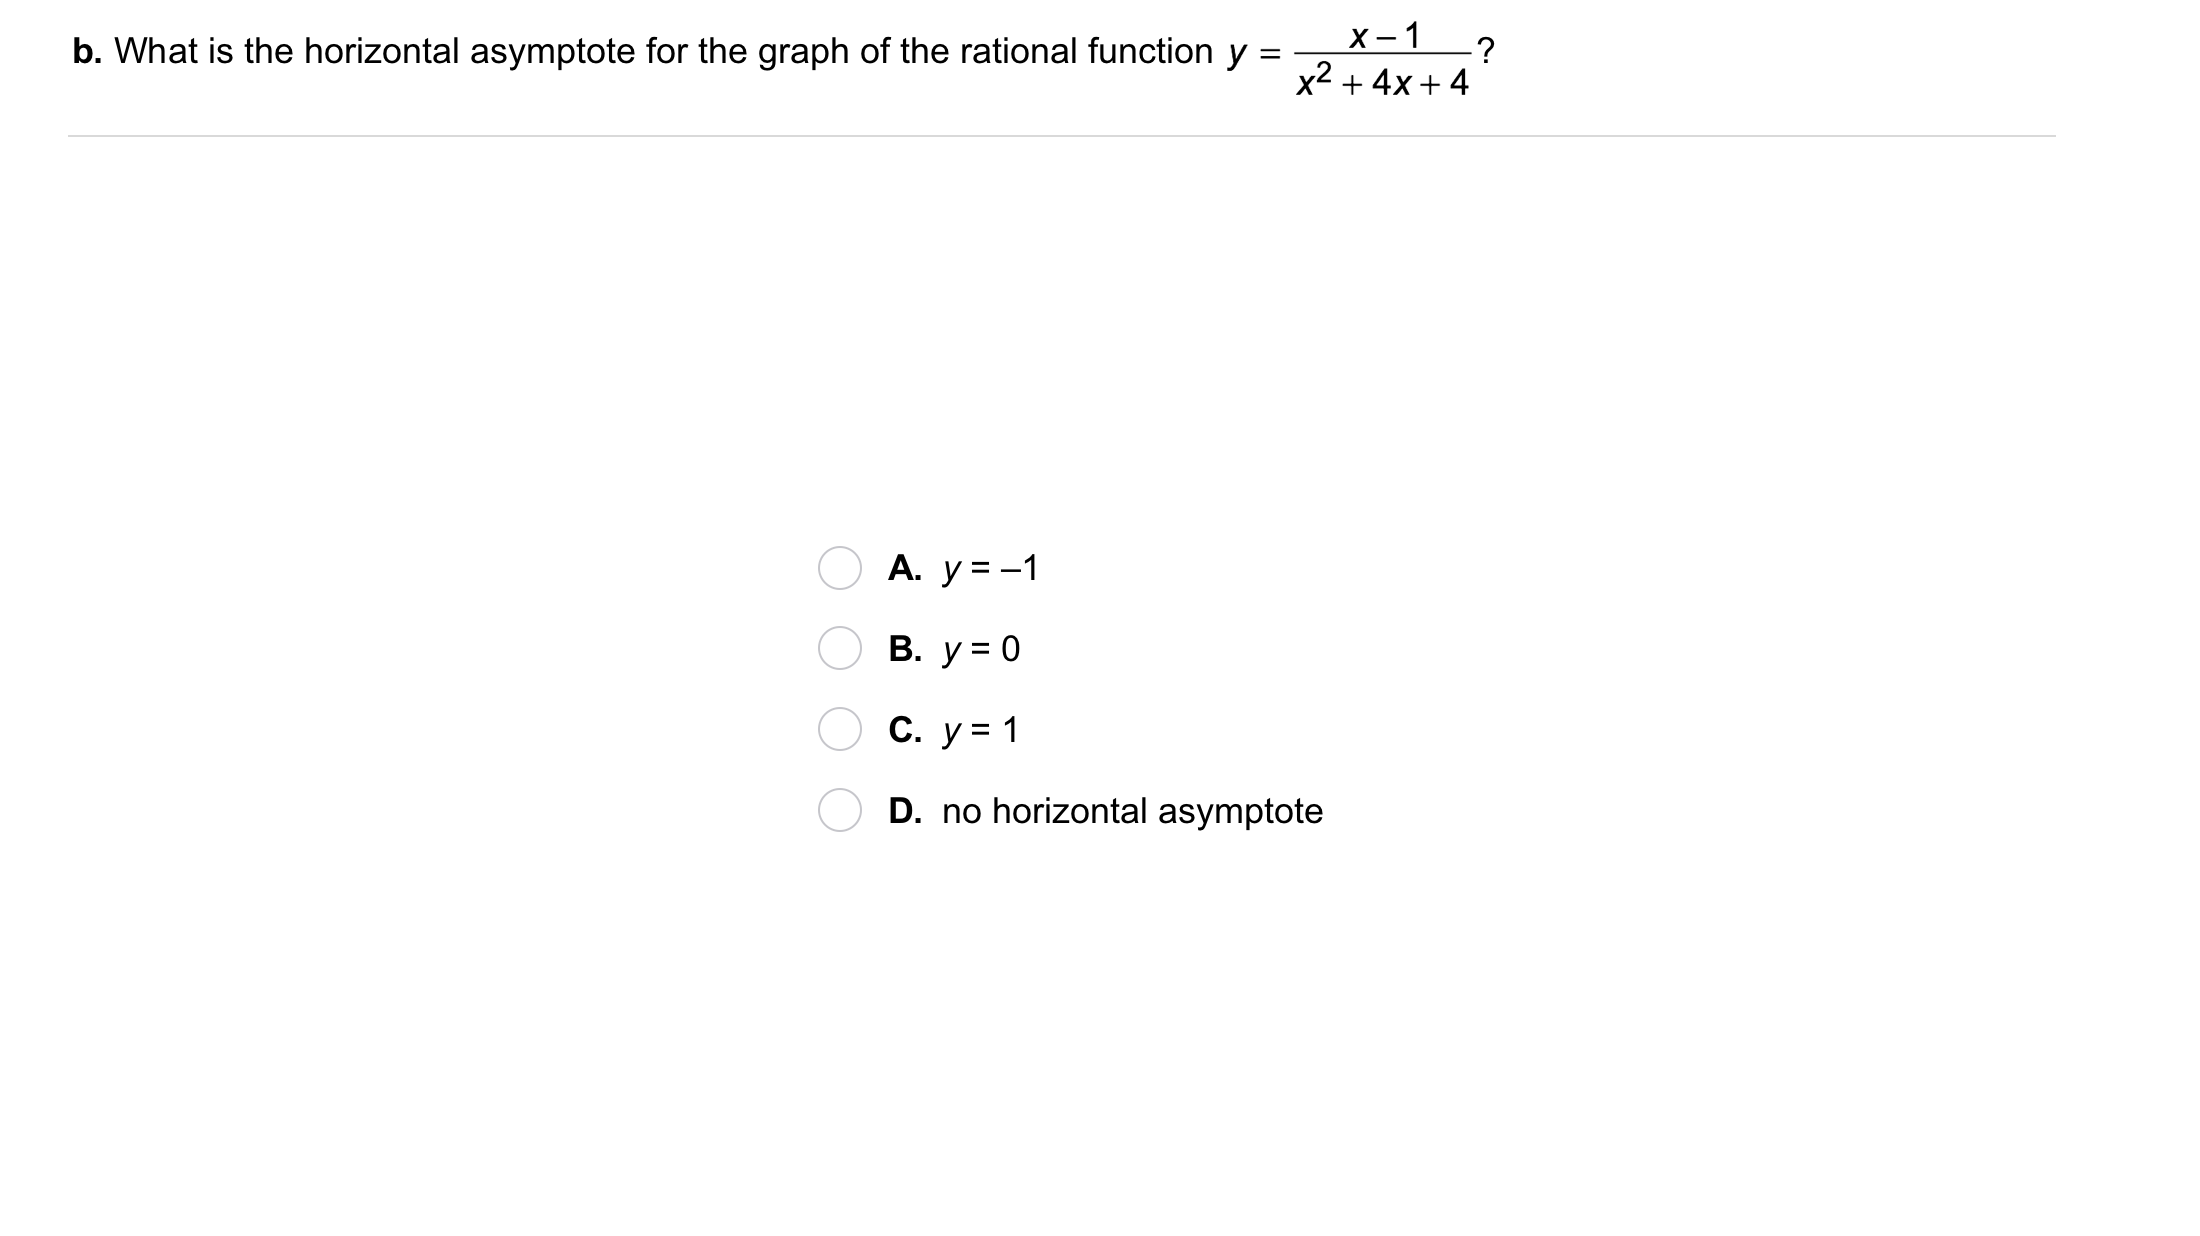
Problem 3 Got It?
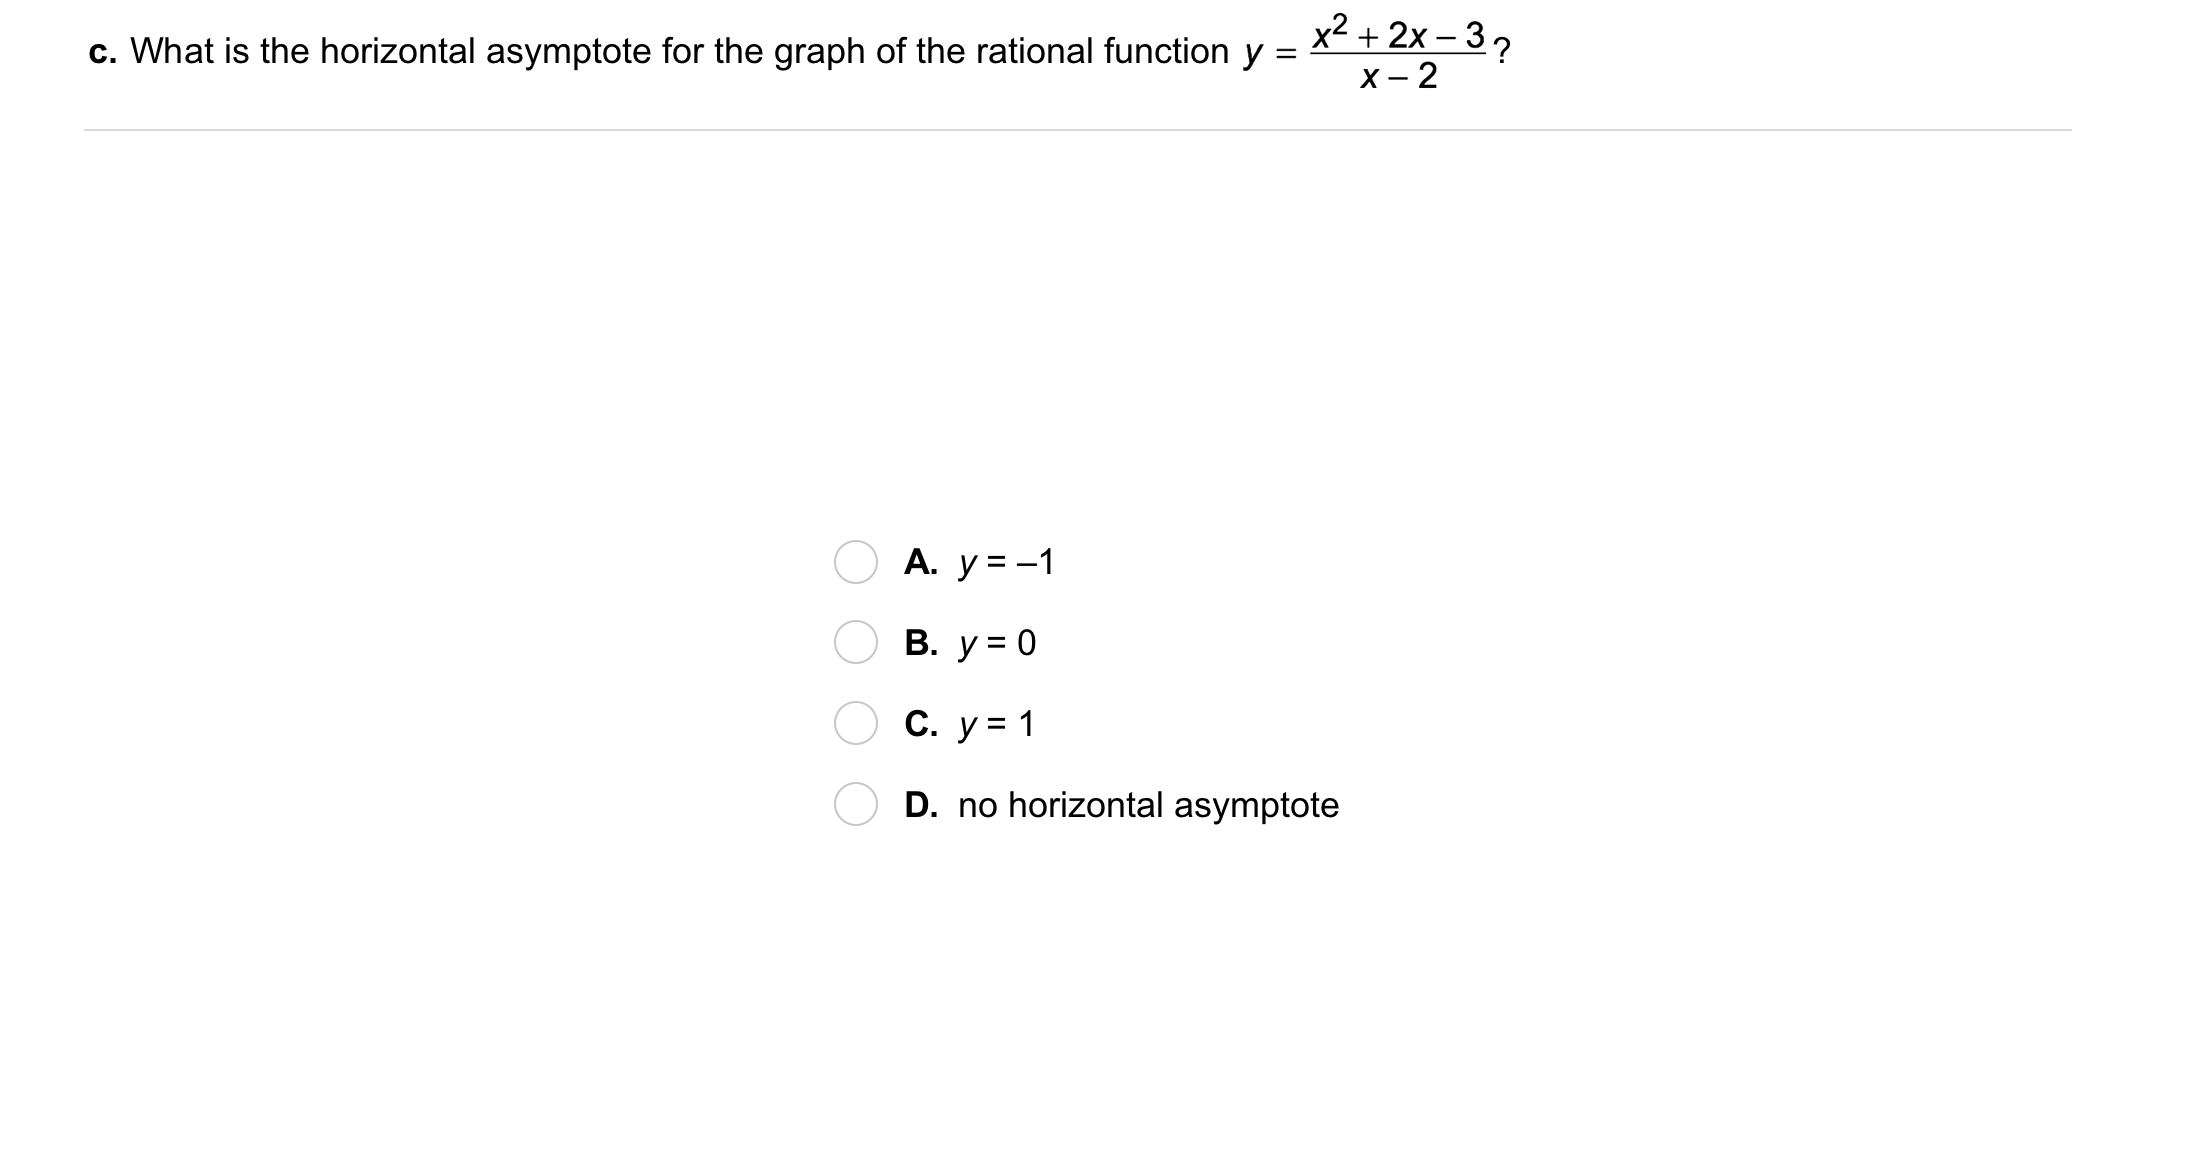
Problem 3 Got It?
![]()
Video Check: Select all that apply with regards to the video embedded directly above this item.
Take Note: Summarize the process of graphing a rational function that is demonstrated in Problem 4.
Problem 4 Got It? What is the graph of the rational function?
Use the techniques you've learned to graph the function by hand using the blue pen tool. Include all relevant graph detail.
Graph the function using Desmos' graphing calculator and copy that graph to yours using the orange pen tool. It is alright if the graphs overlap in some places and are different in others.
Note any discrepancies between the graph you created by hand and the precise Desmos graph.
![]()
Video Check: Select all that apply with regards to the video embedded directly above this item.
Problem 5 Got It? You want to mix a 10% orange juice drink with 100% pure orange juice to make a 40% orange juice drink. The function below gives the concentration y of orange juice in the drink after you add x gallons of the 10% drink to 2 gallons of pure juice.
How much of the 10% drink must you add to get a drink that is 40% juice?
You may use Desmos or the embedded Desmos graphing utility above.
Problem 5 Got It? Reasoning: If you wanted a drink that is 80% orange juice, would you need to add half as much as your answer in the previous item?

🧠 Retrieval Practice:
Summarize the mathematical content of this lesson. What topics, ideas, and vocabulary were introduced?
Take Note: Sketch a continuous graph.
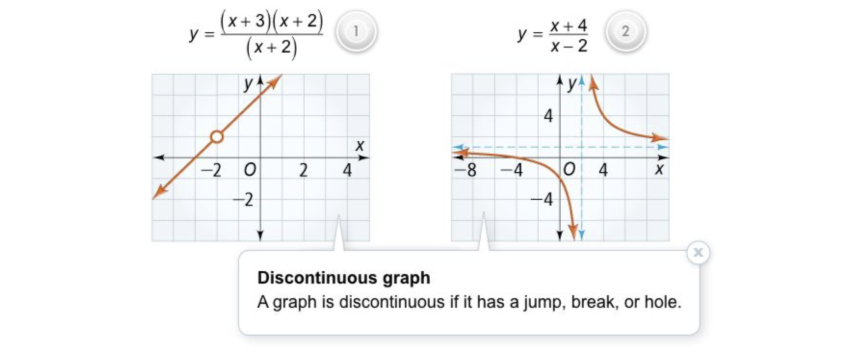
Take Note: What is a discontinuous graph?
Take Note: Sketch a discontinuous graph.
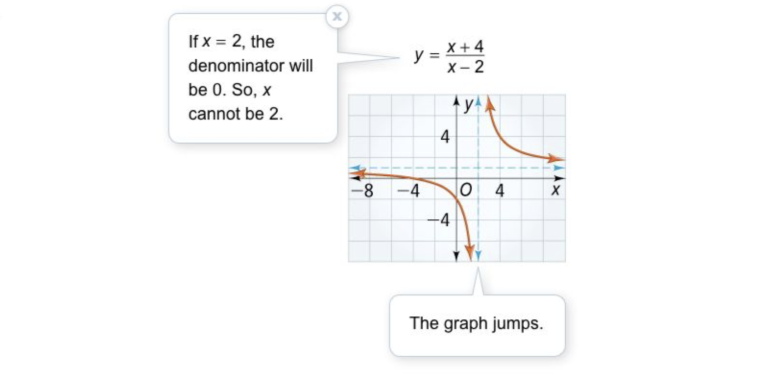
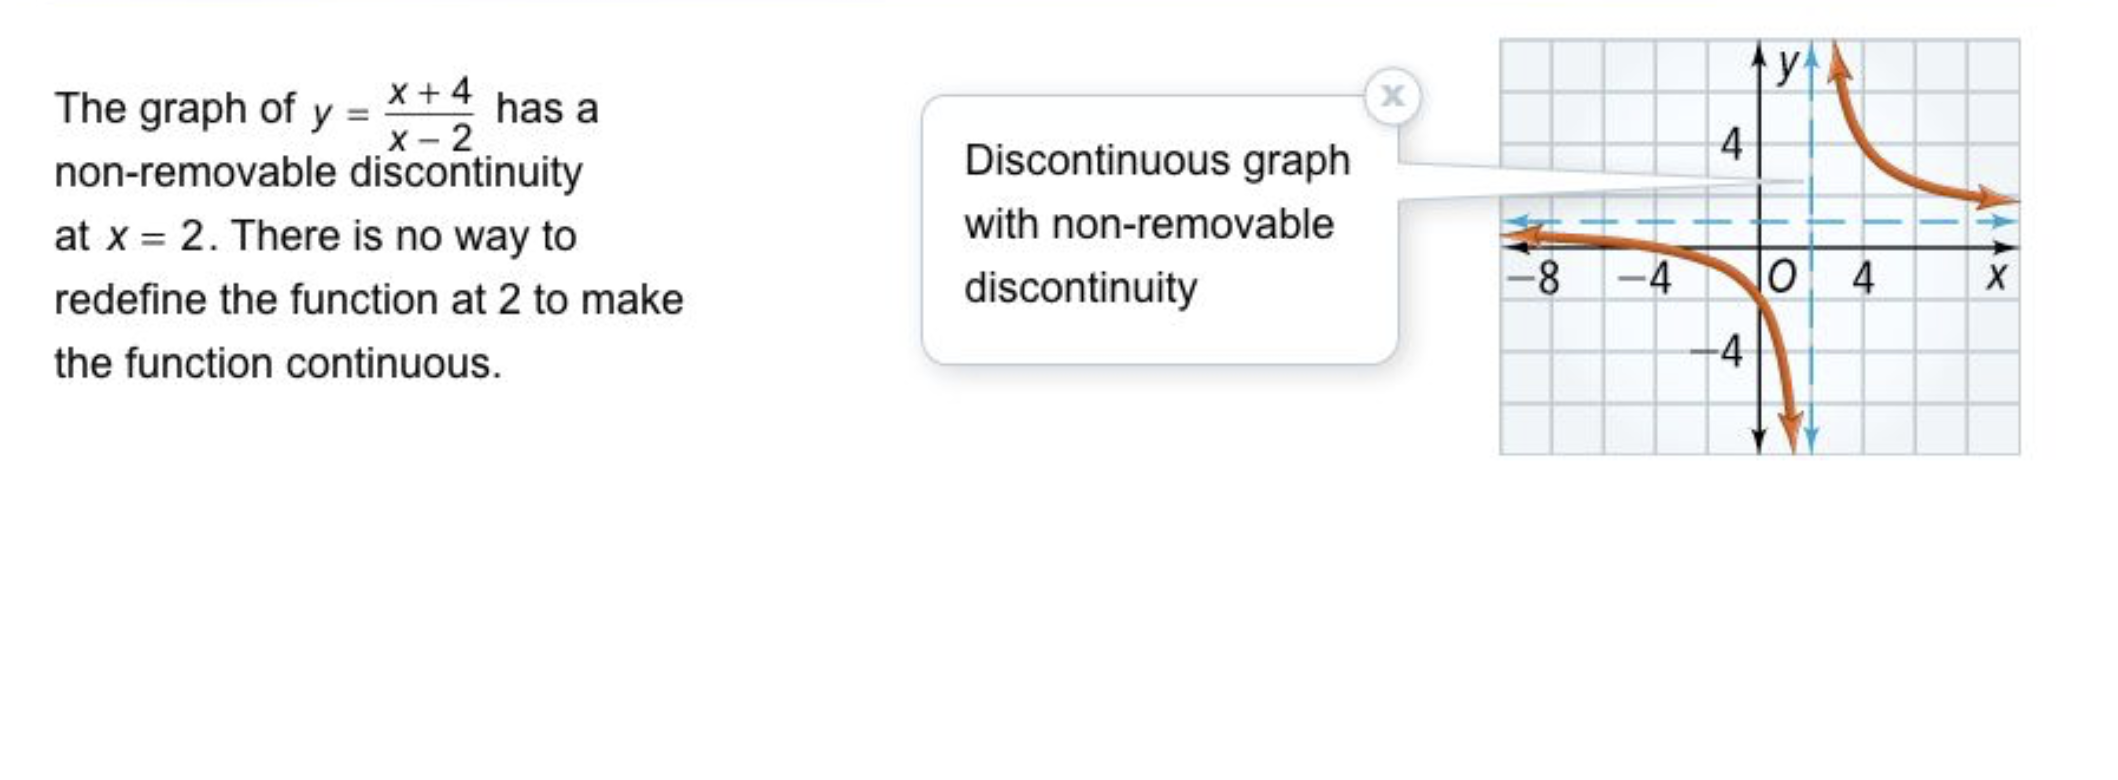
Take Note: What is a non-removable discontinuity?
Take Note: Sketch a graph with a non-removable discontinuity at