Algebra 2 2-6 Mixed Review: Families of Functions
star
star
star
star
star
Last updated over 3 years ago
5 Nsɛmmisa

10
A.CED.2
F.IF.6
10
10

10
10
Review Lesson 2-5: A musician's manager keeps track of the ticket prices and the attendance at recent performances in the table below.

Step 1. Use the graphing calculator at desmos.com to create a scatterplot and to calculate and graph the line of best fit for the given data.
Step 2. Take a screenshot of your scatterplot and line of best fit.
Step 3. Upload or paste your screenshot to the Formative canvas.
If you need a reminder of how to complete Step 1, review this video from the Desmos team and/or see Problem 3 from the Lesson 2-5 slideshow.
Review Lesson 1-6: Resequence the items below to indicate the correct procedure for solving the absolute value equation.
Separate the equation |x - 3| = 5 into two equations: x - 3 = 5 and x - 3 = -5.
Check both possible solutions by substituting them into the original equation, |x - 3| + 2 = 7.
Solve the two equations separately to find two possible solutions: x = 8 and x = -2.
Isolate the |x - 3| part of the expression by subtracting 2 from each side of the equation.
Since both solutions satisfy the equation, they are both solutions of the equation.
Review Lesson 1-6: Fill in the blank: When solving absolute value equations, a possible solution that does not check out when substituted into the equation is called a(n) __?__.
Vocabulary Review: Identify the items that are NOT vertical.
the horizon
columns
the x-axis
the y-axis
rows
Not vertical
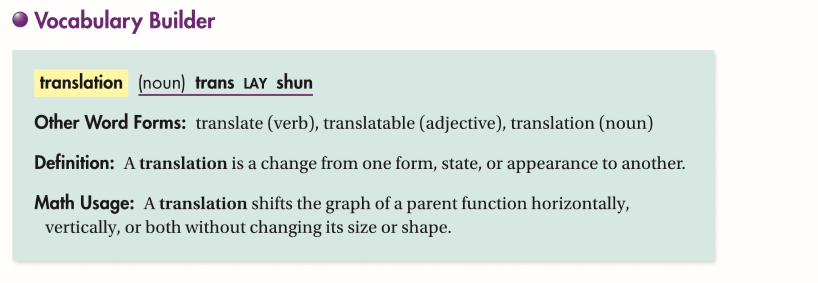
Use Your Vocabulary: Complete each statement with the correct form of the word translation.
translation
translate
translatable
NOUN: The graph shows a vertical __?__ of the function.
ADJECTIVE: The toddler's language was not __?__.
VERB: The Spanish teacher helped the town mayor __?__ the letter.