Twa kɔ nsɛm atitiriw so
Log in
Sign up for FREE
arrow_back
Laabri

Algebra 2 4-3 Complete Lesson: Modeling With Quadratic Functions

star
star
star
star
star
Last updated over 4 years ago
20 Nsɛmmisa
Hyɛ no nsow a efi ɔkyerɛwfo no hɔ:

A complete formative lesson with embedded slideshow, mini lecture screencasts, checks for understanding, practice items, mixed review, and reflection. I create these assignments to supplement each lesson of Pearson's Common Core Edition Algebra 1, Algebra 2, and Geometry courses. See also mathquest.net and twitter.com/mathquestEDU.


30
F.IF.4
F.IF.5
F.IF.7.a

10
10
F.IF.4
F.IF.5
F.IF.7.a

10
F.IF.7.a
10
A.REI.6
10
10

10
F.IF.7.a
10
10
100
10
F.IF.4
F.IF.5
F.IF.7.a

Solve It! You and a friend are tossing a ball back and forth. You each toss and catch the ball at waist level, 3 ft high.

10
F.IF.4
F.IF.5
F.IF.7.a
10
Asemmisa {{asɛmmisaAhyɛnsode}}
2.

Problem 1 Got It?

F.IF.4
F.IF.5
F.IF.7.a
10
Asemmisa {{asɛmmisaAhyɛnsode}}
3.

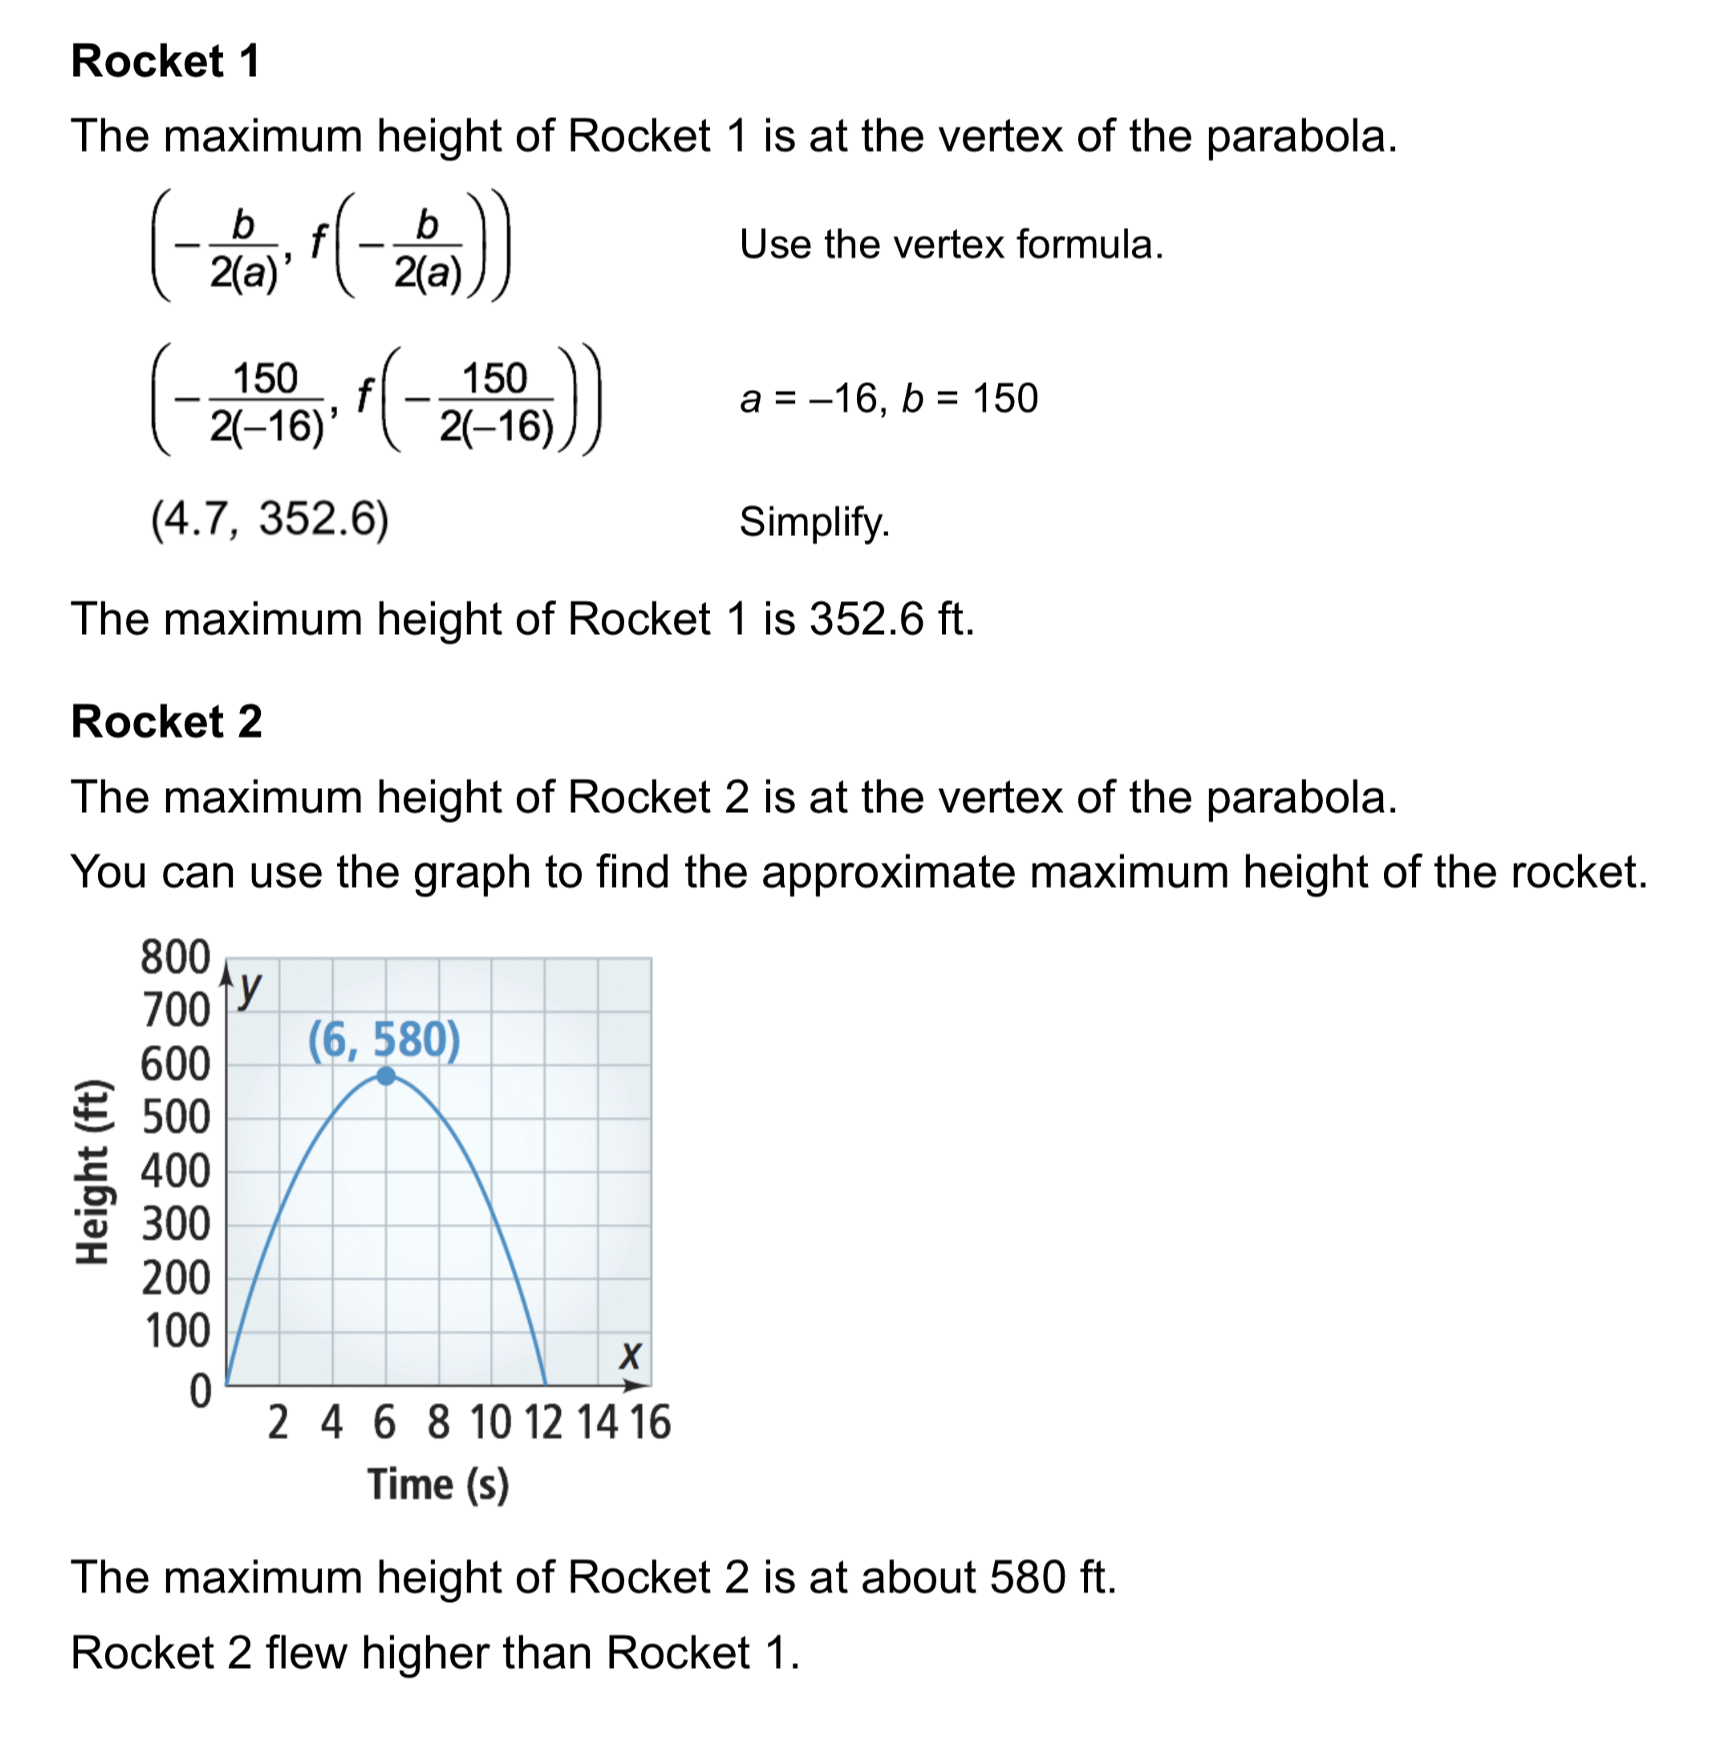
Problem 2 Got It? Refer to Rocket 1 and Rocket 2 from Problem 2, shown here. Which rocket stayed in the air longer?

F.IF.4
F.IF.5
10
F.IF.4
F.IF.5
10
F.IF.4
F.IF.5
Asemmisa {{asɛmmisaAhyɛnsode}}
6.

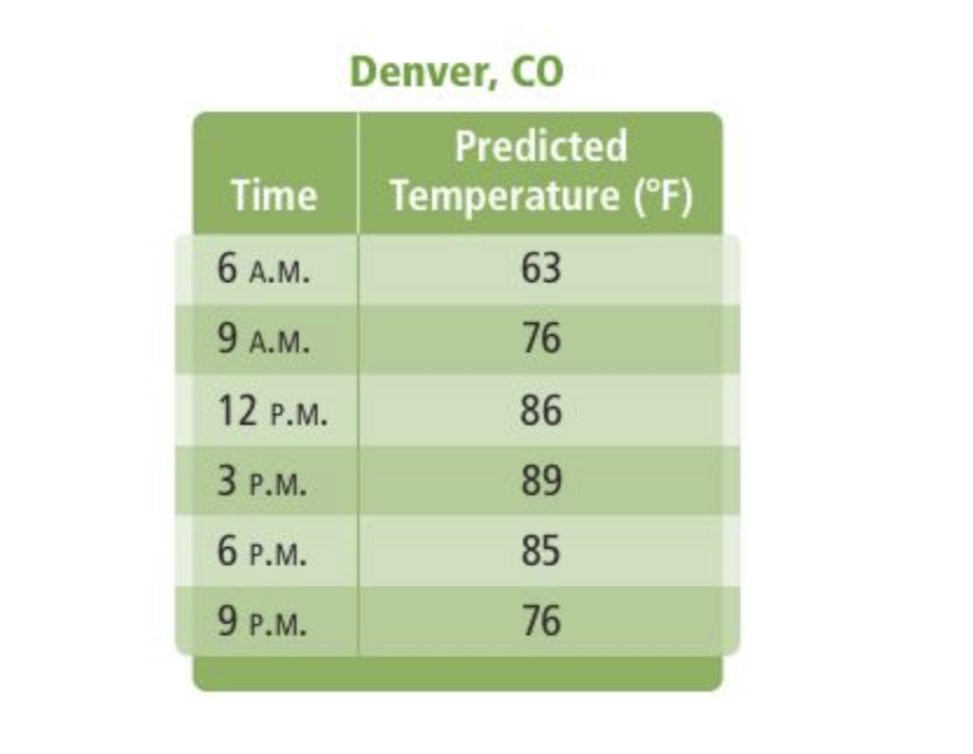
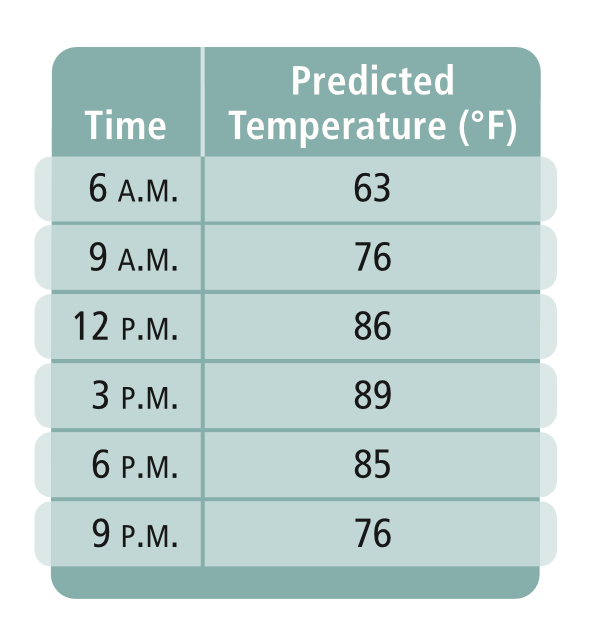
Problem 3 Got It? The table shows a meteorologist's predicted temperatures for a summer day in Denver, Colorado.

1. Add a table to the embedded Desmos graphing utility and plot the points from the meteorologist's table. As in Problem 3, use a 24-hour clock when entering times into the table. Zoom and pan your graph to establish an appropriate viewing window.

2. On the next Desmos row, add a quadratic regression function to model the data. Recall Desmos' regression notation: y₁ ~ ax₁² + bx₁ + c.

3. Use the model to predict the high temperature for the day. Click the parabola once to select it, then click at the point representing the high temperature (the vertex) of the quadratic model to add a label that identifies its coordinates. Be careful not to select the point from the table that is near to the vertex. Be sure the label is shown in the viewing window before moving on.

Yɛayi Graphing asɛmmisa type foforo a wɔatu mpɔn adi! Asuafo rentumi mmua saa asɛmmisa yi bio.
10
Asemmisa {{asɛmmisaAhyɛnsode}}
7.

Find a quadratic function that includes the set of values (1, 0), (2, -3), and (3, -10).

F.IF.4
F.IF.5
F.IF.7.a
10
Asemmisa {{asɛmmisaAhyɛnsode}}
8.

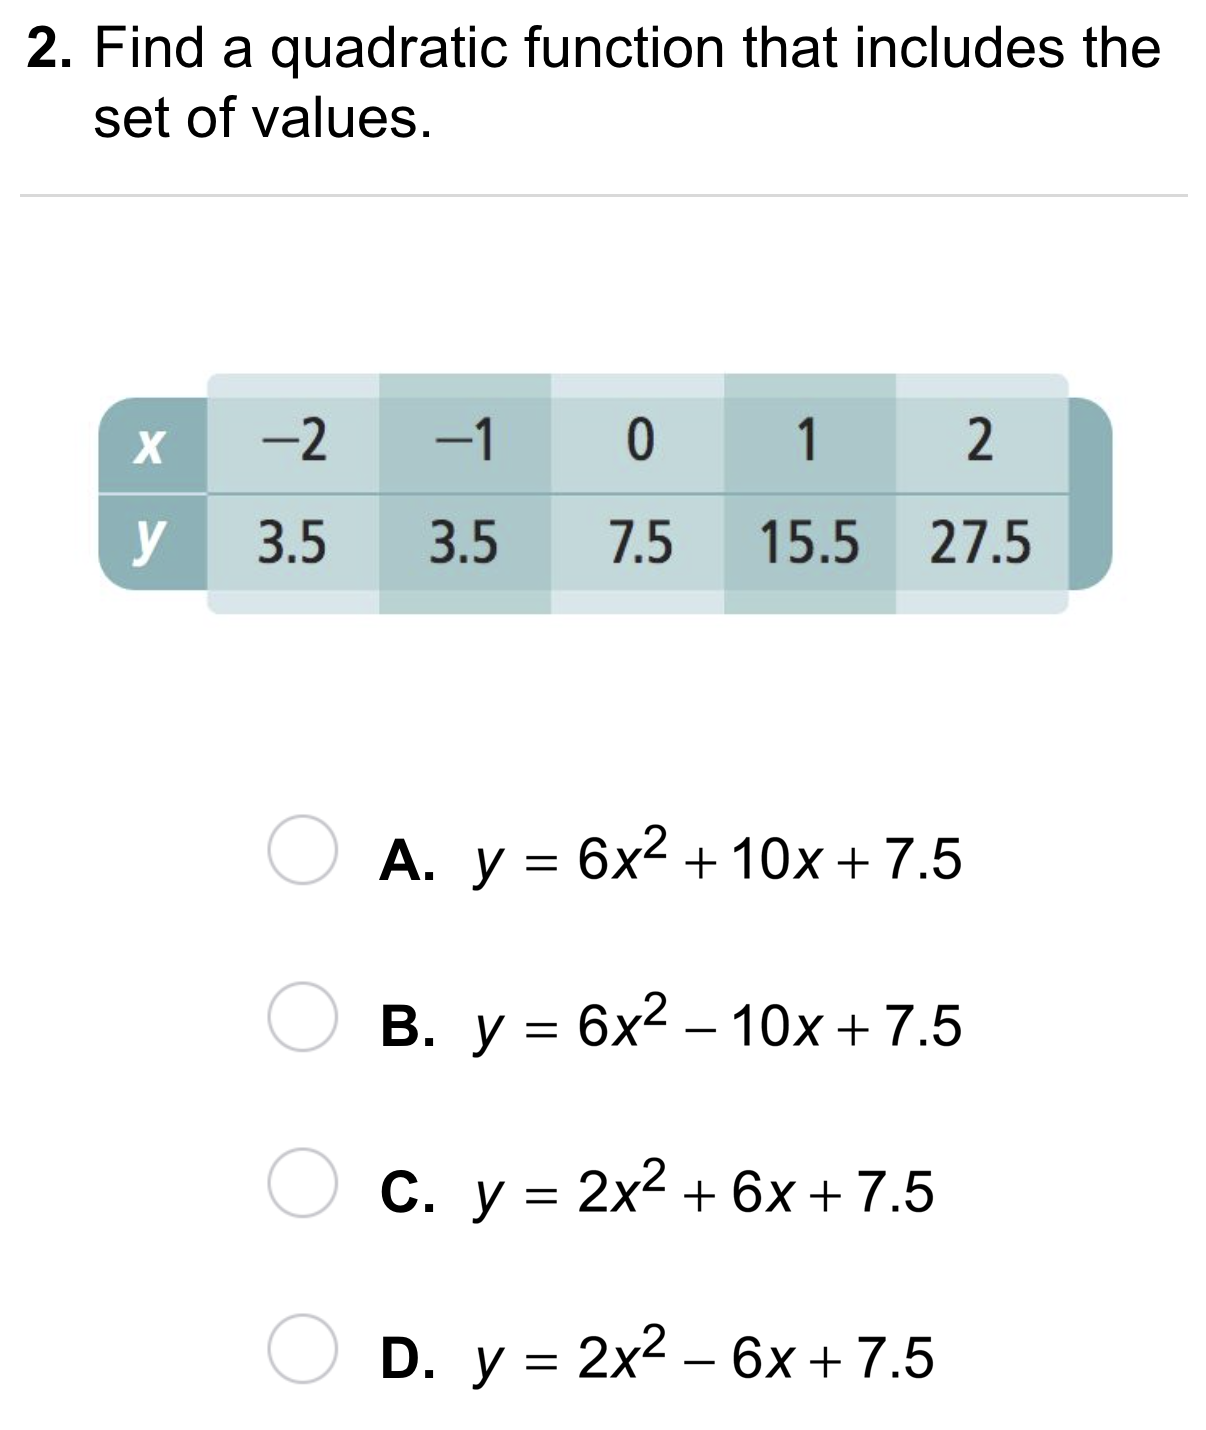
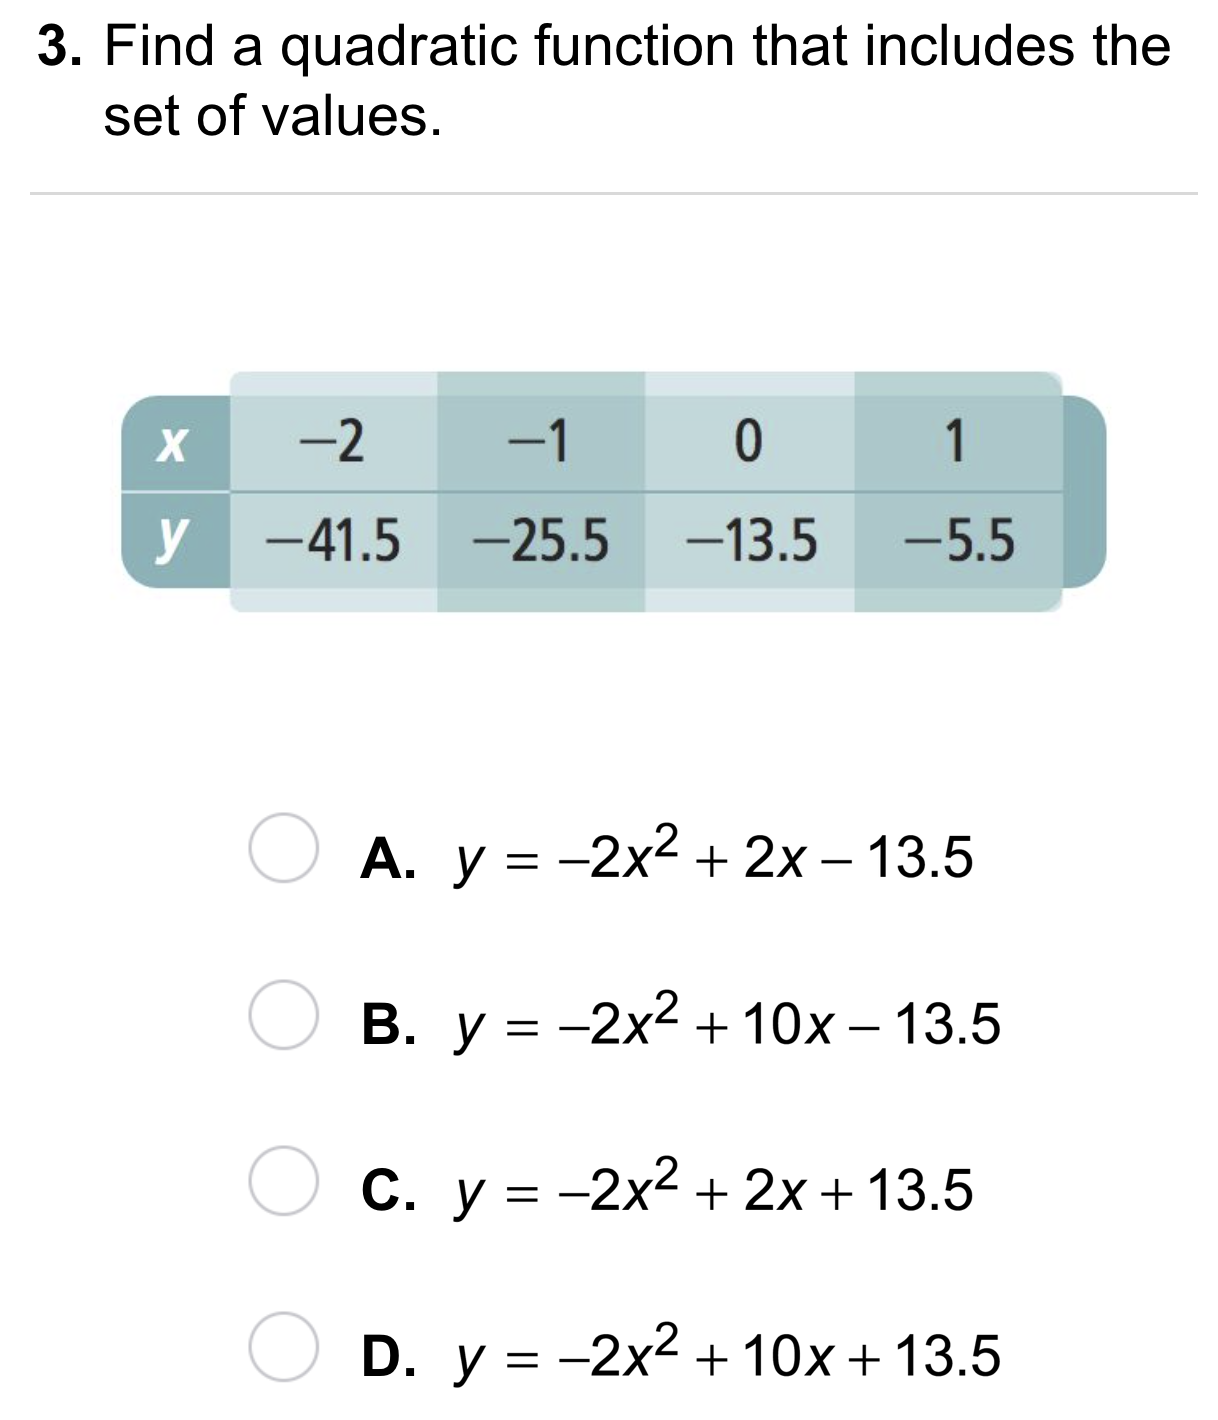
Find a quadratic function that includes the set of values.

F.IF.4
F.IF.5
F.IF.7.a
10
Asemmisa {{asɛmmisaAhyɛnsode}}
9.

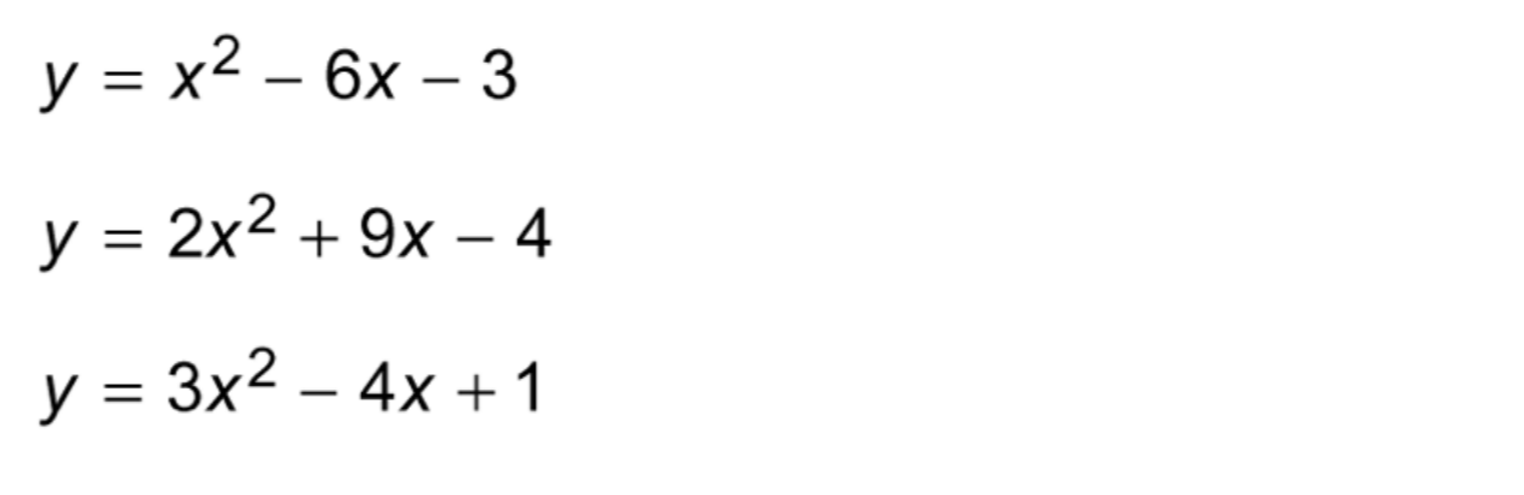
Find a quadratic function that includes the set of values.

F.IF.4
F.IF.5
F.IF.7.a
Asemmisa {{asɛmmisaAhyɛnsode}}
11.

Error Analysis: Your classmate says he can write the equation of a quadratic function that passes through the points (3, 4), (5, -2), and (3, 0). Explain his error.

Asemmisa {{asɛmmisaAhyɛnsode}}
12.

Review Lesson 4-2: Graph the functions on the same plane. Zoom and pan your graph to establish an appropriate viewing window.

Yɛayi Graphing asɛmmisa type foforo a wɔatu mpɔn adi! Asuafo rentumi mmua saa asɛmmisa yi bio.
Asemmisa {{asɛmmisaAhyɛnsode}}
13.

Review Lesson 3-2: Solve the system by elimination on the canvas. Show each step and write the solution in the space provided.

Asemmisa {{asɛmmisaAhyɛnsode}}
14.

Review Lesson 2-2: y varies directly with x. Match each direct variation with its solution.

  • If y = 2 when x = 5, find y when x = 2.

  • If y = -2 when x = 4, find y when x = 7.

  • 2.5

  • 0.8

  • -3.5

Asemmisa {{asɛmmisaAhyɛnsode}}
15.

Review Lesson 1-3: Match each expression with its simpler form.

  • x² + x + 4x - 1

  • 3x² + 3(2)x - 2 - 2x² - x + 1

  • x² - 2(2 - x ) + 3

  • x² + x - 1

  • x² + 5x - 1

Asemmisa {{asɛmmisaAhyɛnsode}}
16.

Vocabulary Review: Identify the graphs that are NOT parabolas.

Asemmisa {{asɛmmisaAhyɛnsode}}
17.

Use Your Vocabulary: Match each description on the left with the equation that models it on the right.

  • The string section of the orchestra has twice as many violins as cellos.

  • There are two eggs per person with one extra for good measure.

  • There were 100 shin guards in the closet, and each player took 2.

  • y = 2x + 1

  • y = 2x

  • y = 100 - 2x

Asemmisa {{asɛmmisaAhyɛnsode}}
18.

Modeling: Consider the table showing a meteorologist's predicted temperatures for the day.

Which calculator screen below shows the correct data entry for a quadratic model?

Asemmisa {{asɛmmisaAhyɛnsode}}
19.

Notes: Take a clear picture or screenshot of your Cornell notes for this lesson. Upload it to the canvas. Zoom and pan as needed.

For a refresher on the Cornell note-taking system, click here.

Asemmisa {{asɛmmisaAhyɛnsode}}
20.

Reflection: Math Success

Asemmisa {{asɛmmisaAhyɛnsode}}
1.

Solve It! What equation, in standard form, models the path of the ball? Hint: Let the x-axis model the horizontal line at waist level and use the x-intercepts.

Asemmisa {{asɛmmisaAhyɛnsode}}
4.

Problem 2 Got It? What is a reasonable domain and range for each quadratic model?

  • R: 0≤h≤580

  • D: 0≤s≤9.4

  • R: 0≤t≤352.6

  • D: 0≤s≤12

  • Rocket 1

  • Rocket 2

Asemmisa {{asɛmmisaAhyɛnsode}}
5.

Problem 2 Got It? Reasoning: Describe what the domains tell you about each of the models and why the domains for the models are different.