ESS3-5 Changes in Global Climate
star
star
star
star
star
Posljednje ažuriranje over 7 years ago
10
1
1
1
1
1
1
1
1
1
1
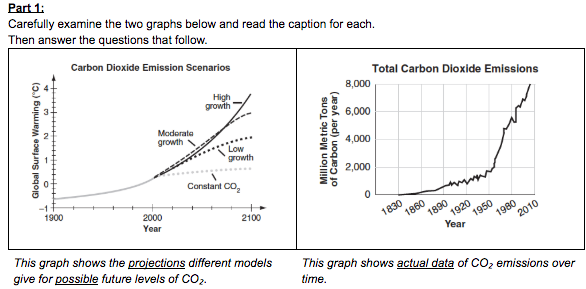
Using the data above, write a claim. Your claim must include the word “humans.”
Identify specific evidence from the graphs that supports your claim.
In one sentence, explain why the evidence you chose supports your claim.
Using the graphs above, write a scientific question that could be tested to provide evidence to support your claim.
In one sentence, explain how your question could be tested in an experiment.
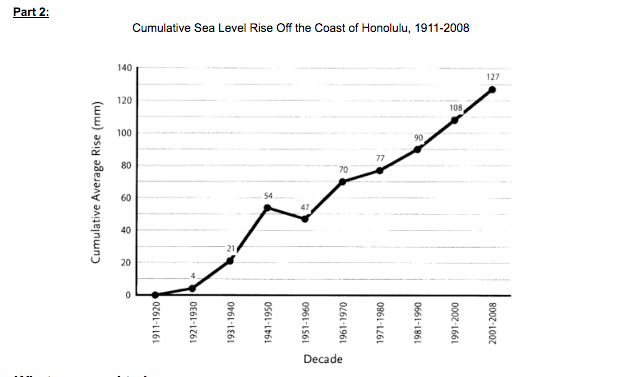
Identify the trend of this graph.
Circle which processes would result in the sea level rising.
Choose one process and explain how this process would result in the data shown on the graph.
What is a question an engineer would ask when designing a building in Honolulu?
Part 3:
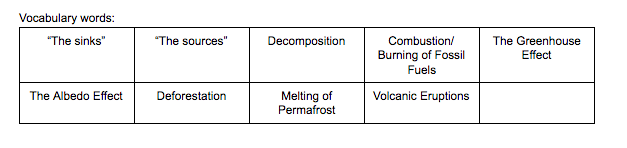
1. Choose two vocabulary words from the bank below. Describe, in a paragraph, what each vocabulary word is, how it relates to the carbon cycle, and how it affects global climate: