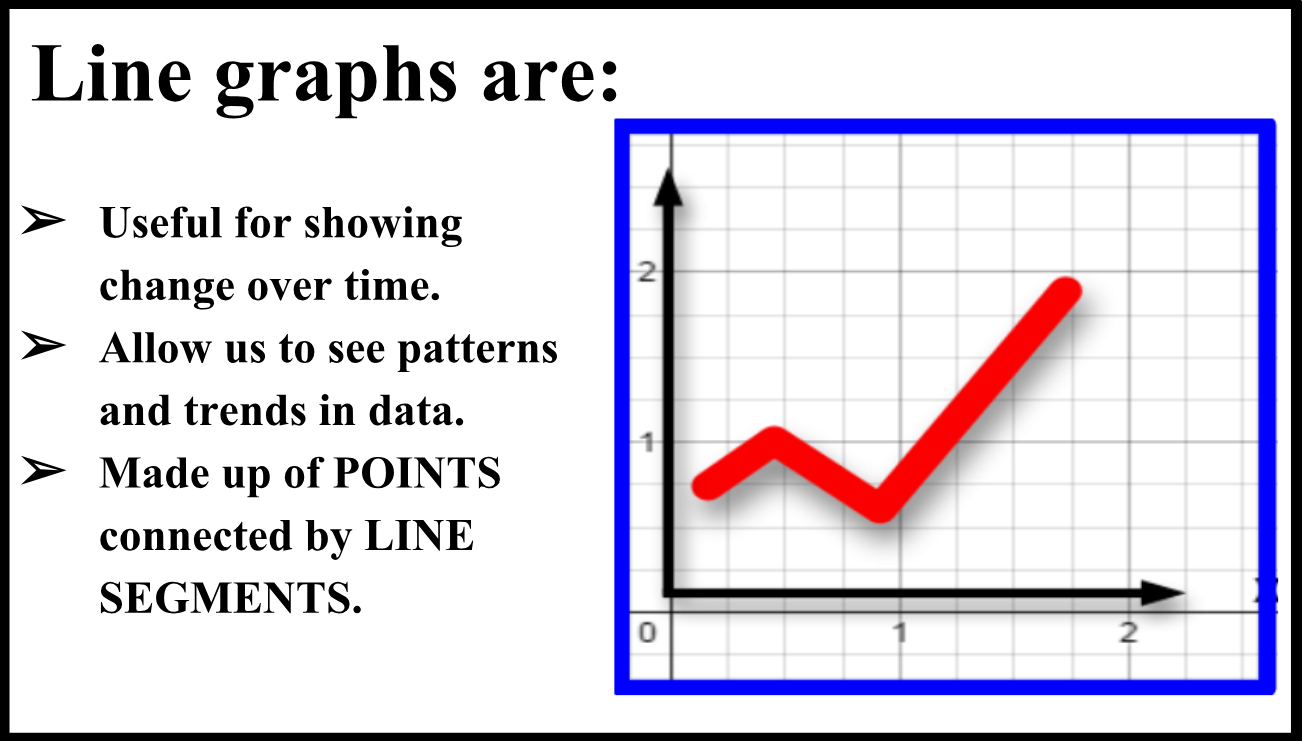
Line Graphs
star
star
star
star
star
Posljednje ažuriranje almost 7 years ago
16
1
1


1
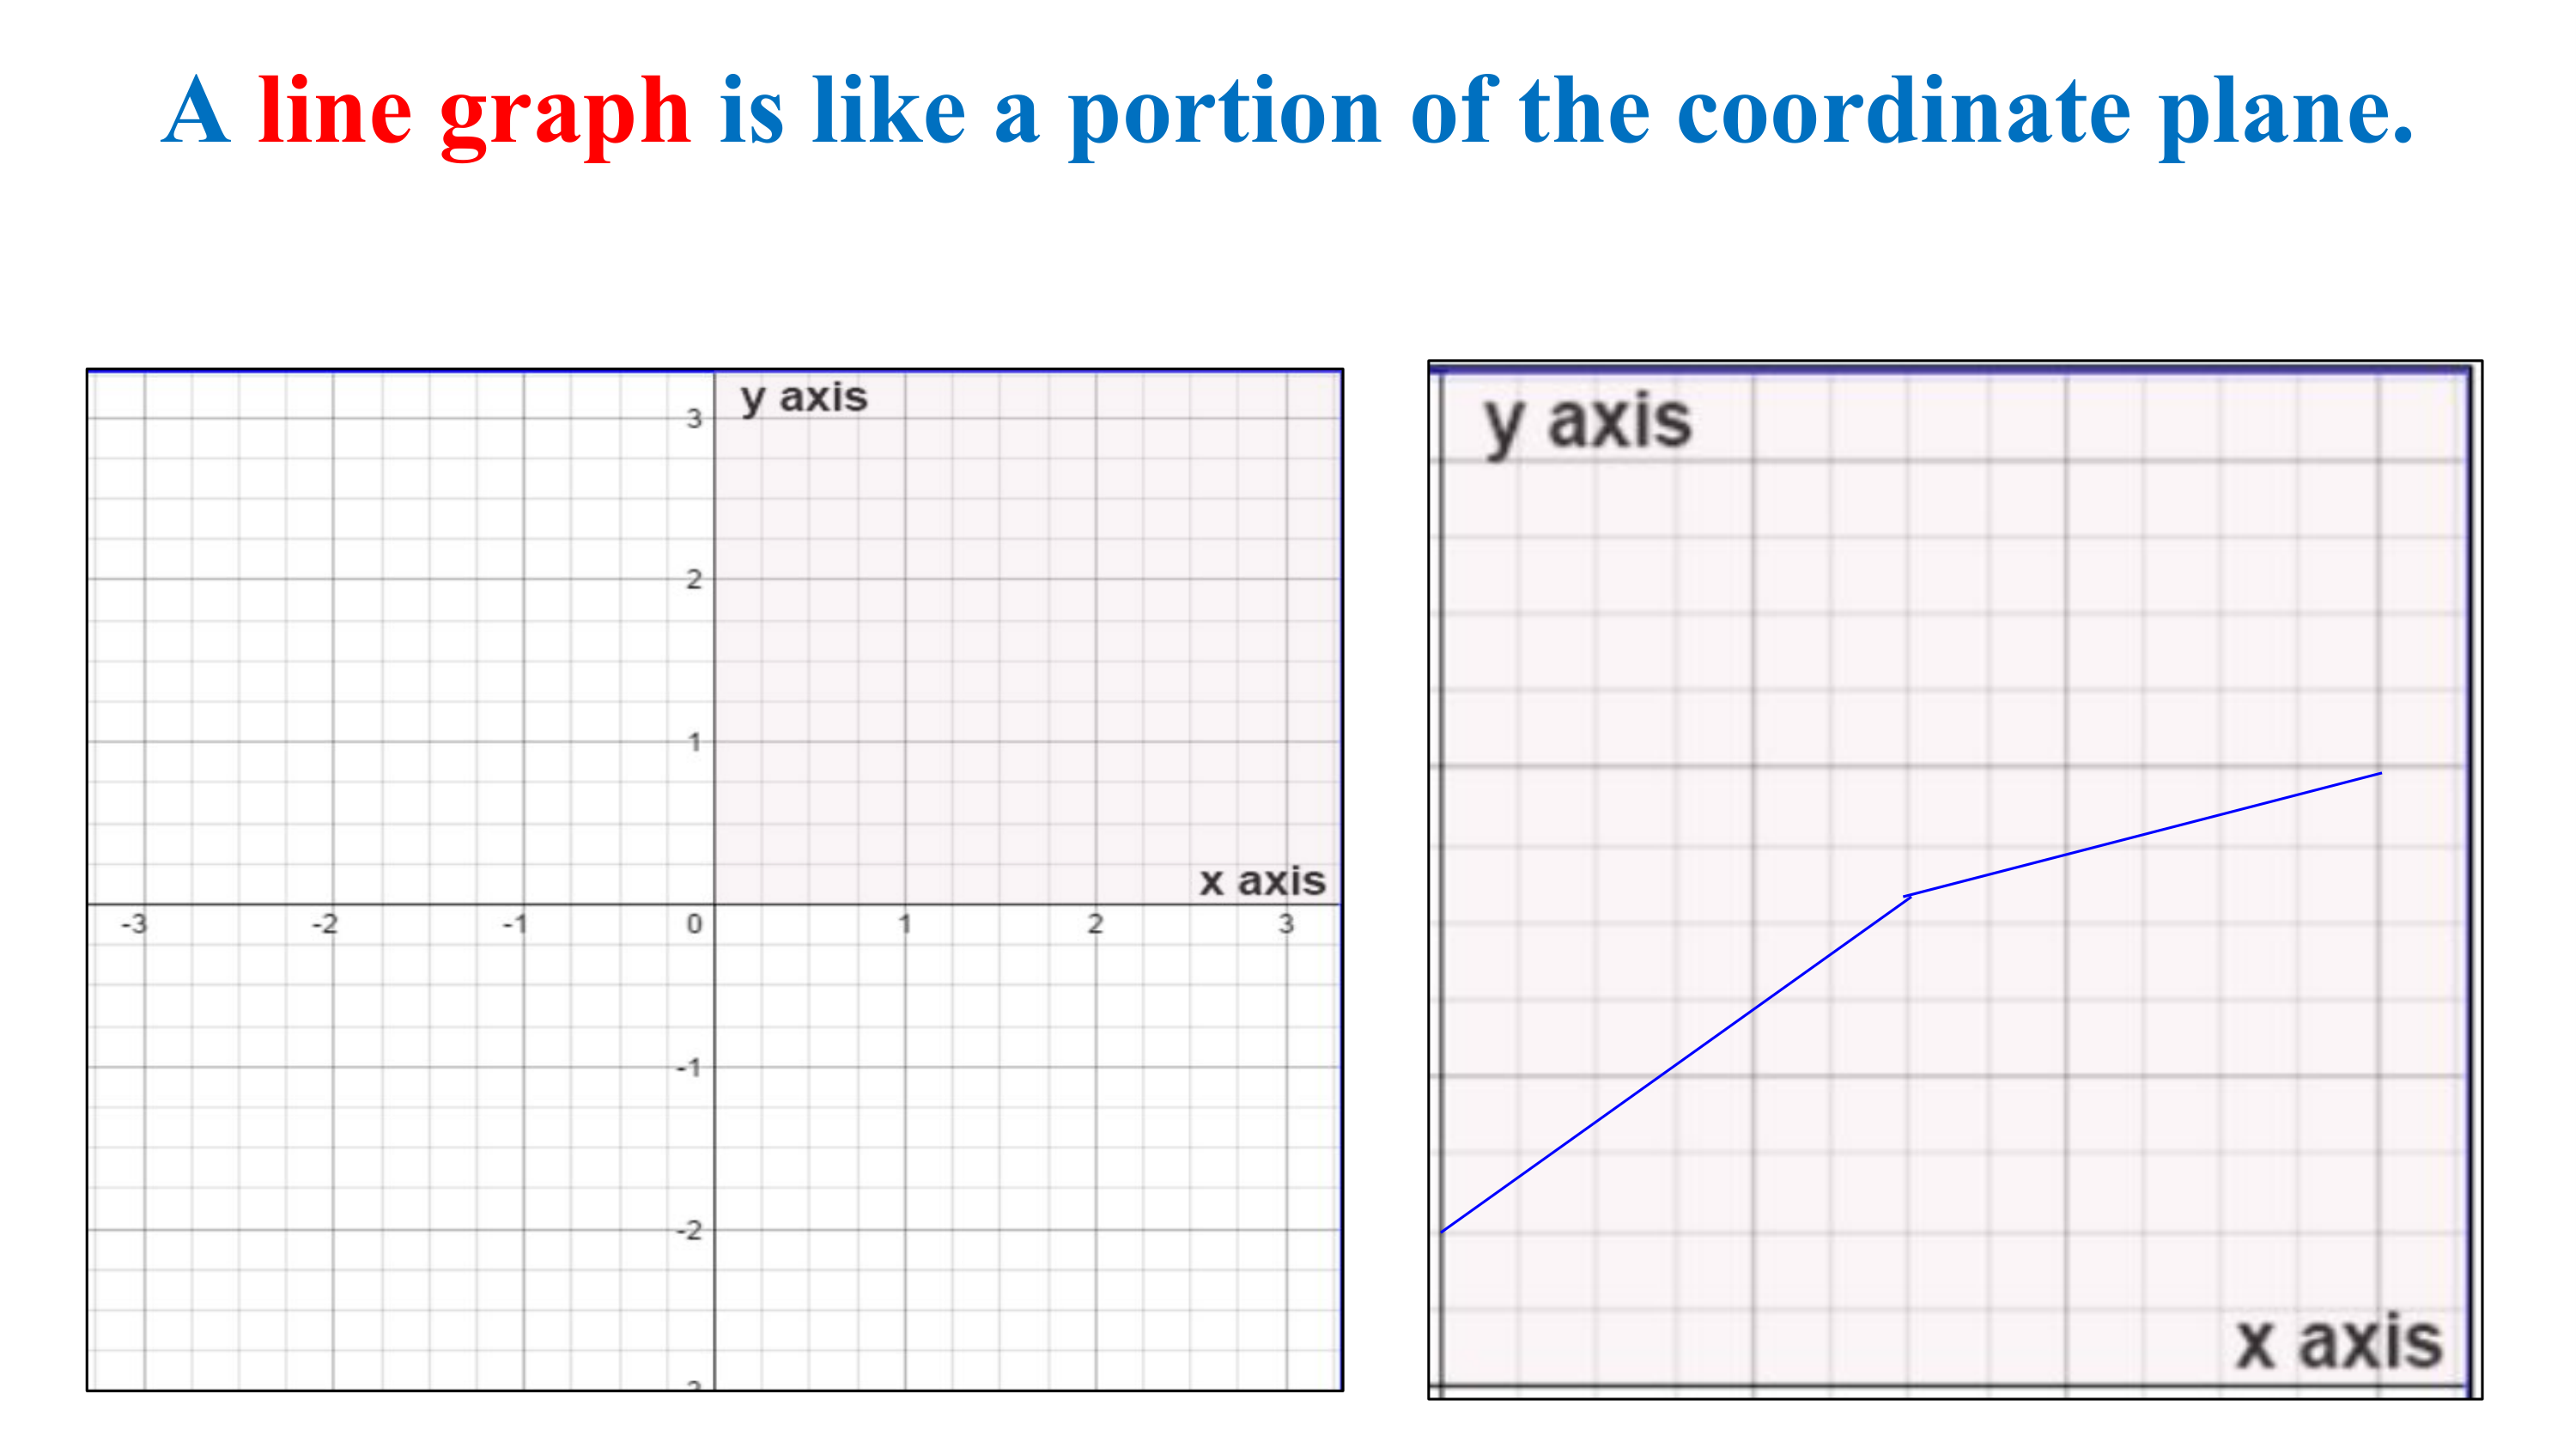
What Quadrant is this line graph located in?
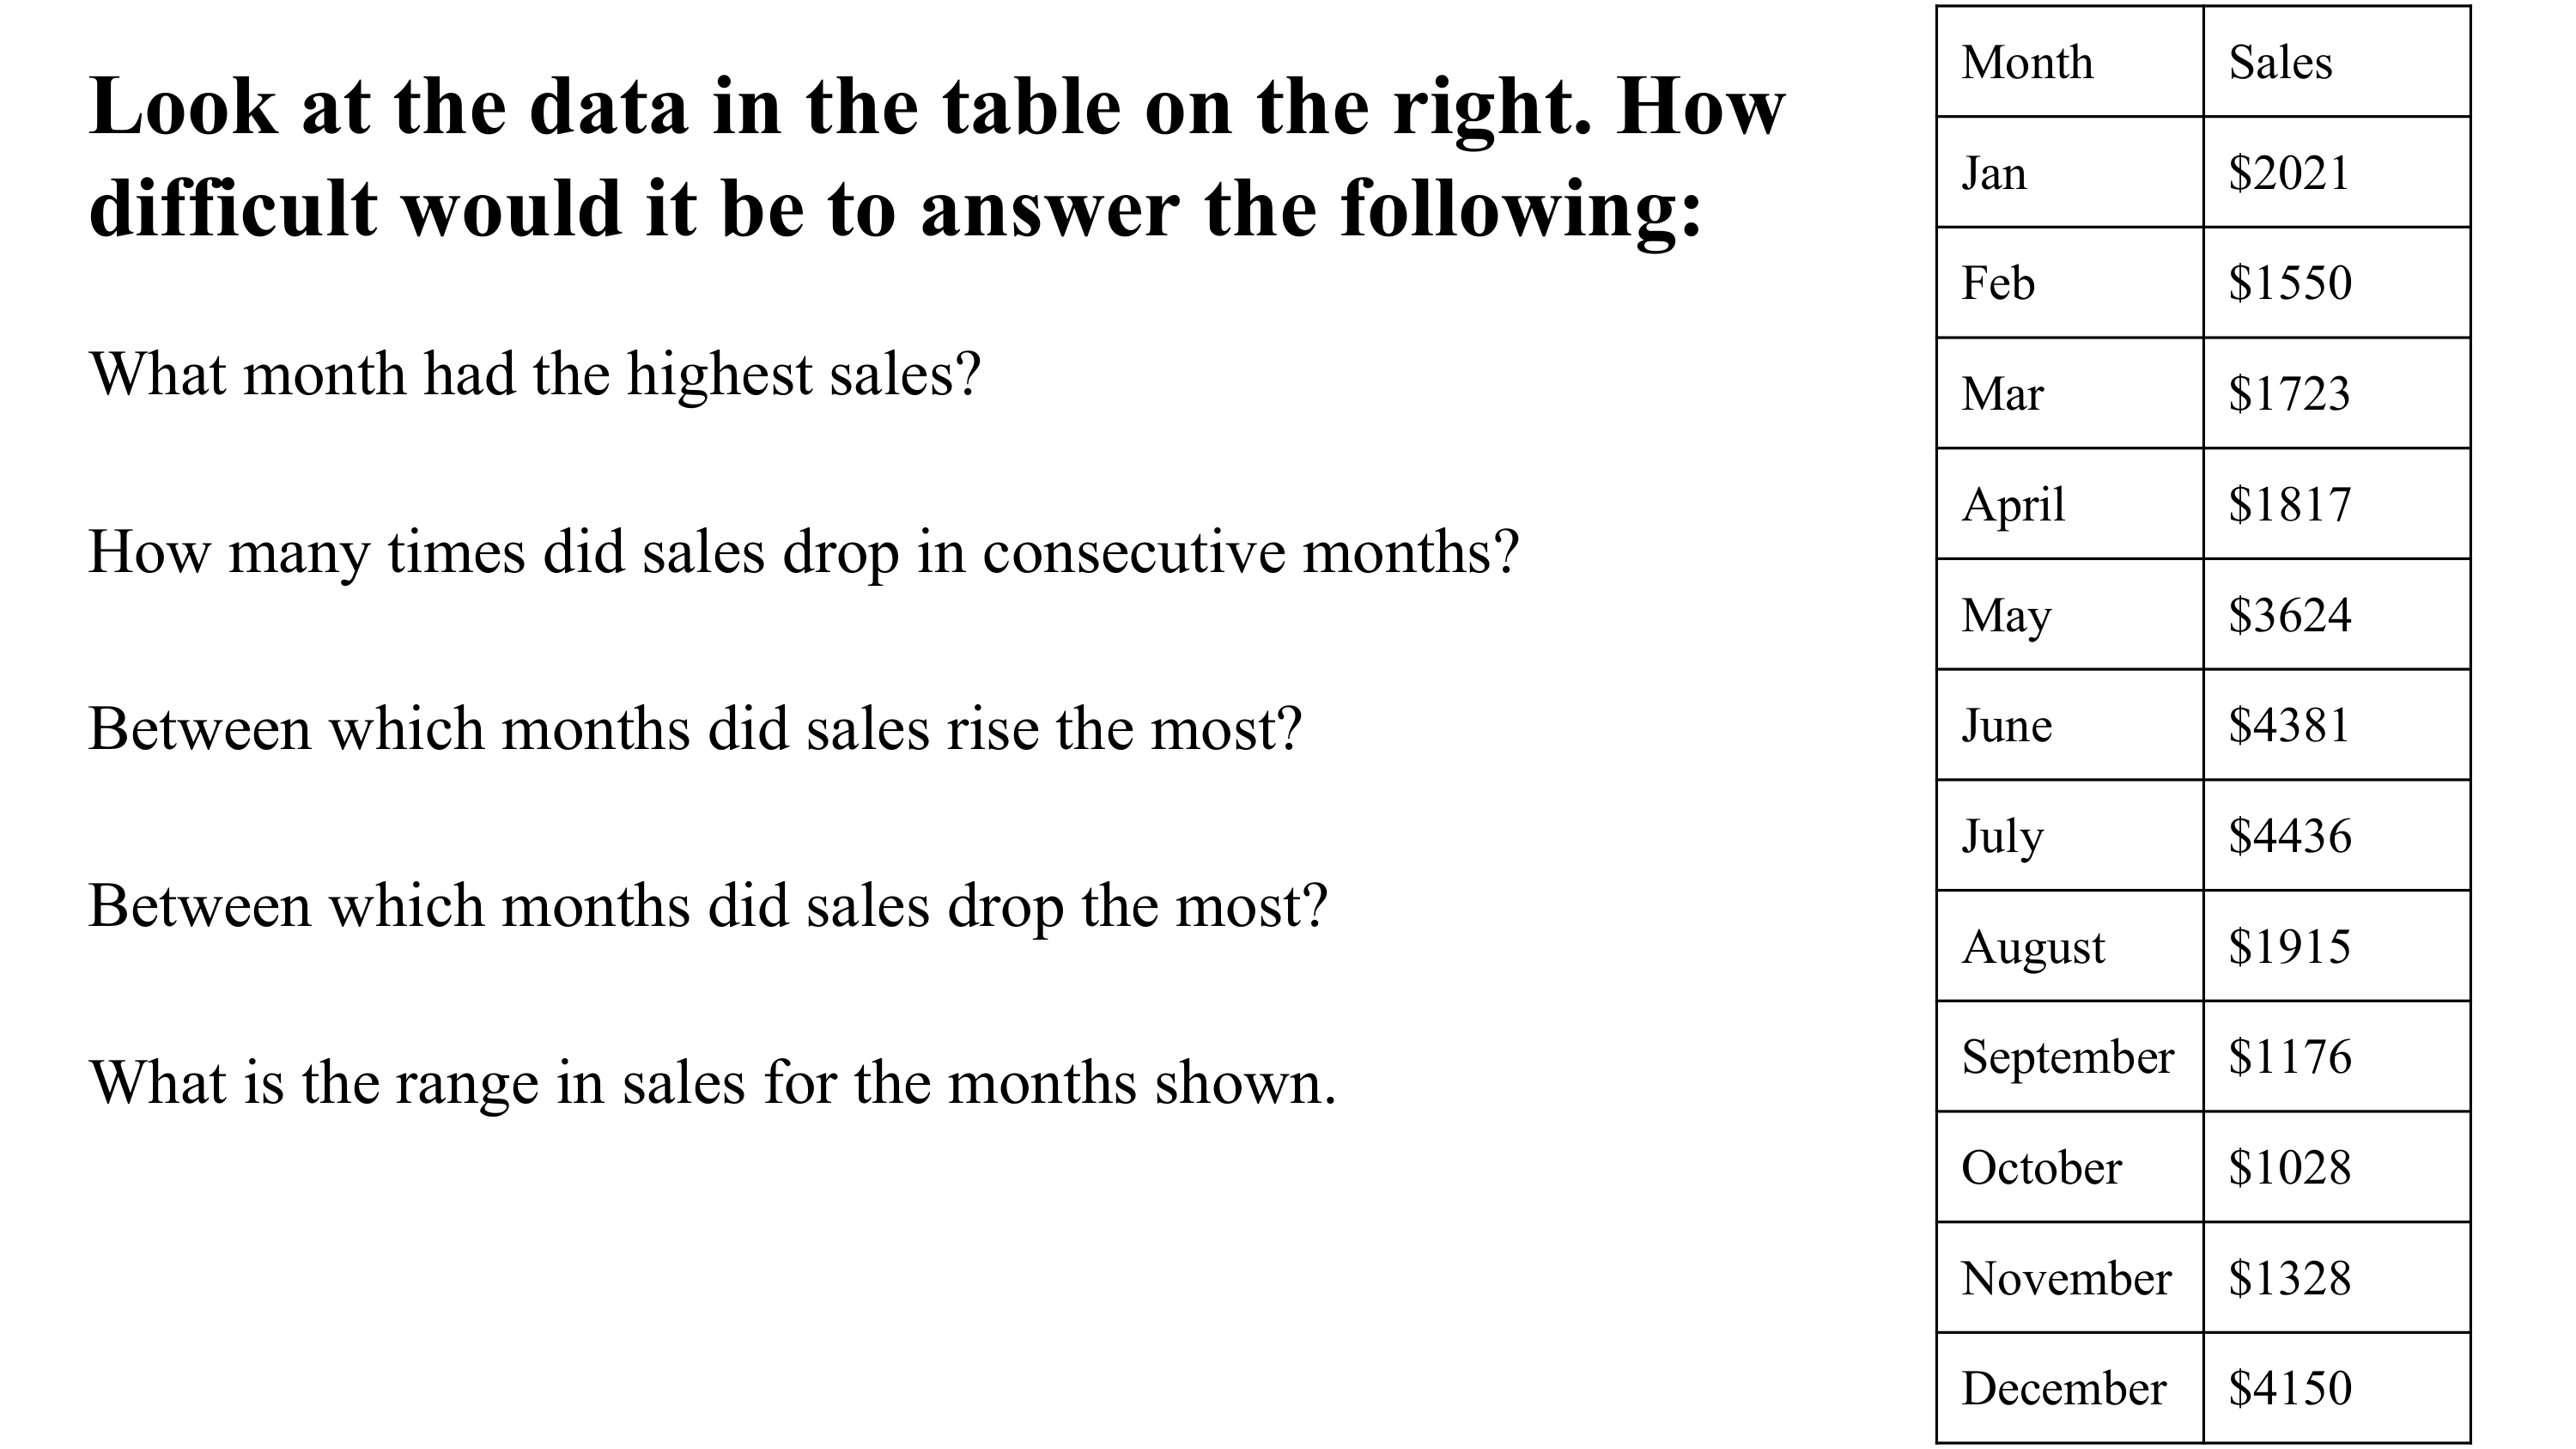
How difficult would it be to answer the questions based on the table?
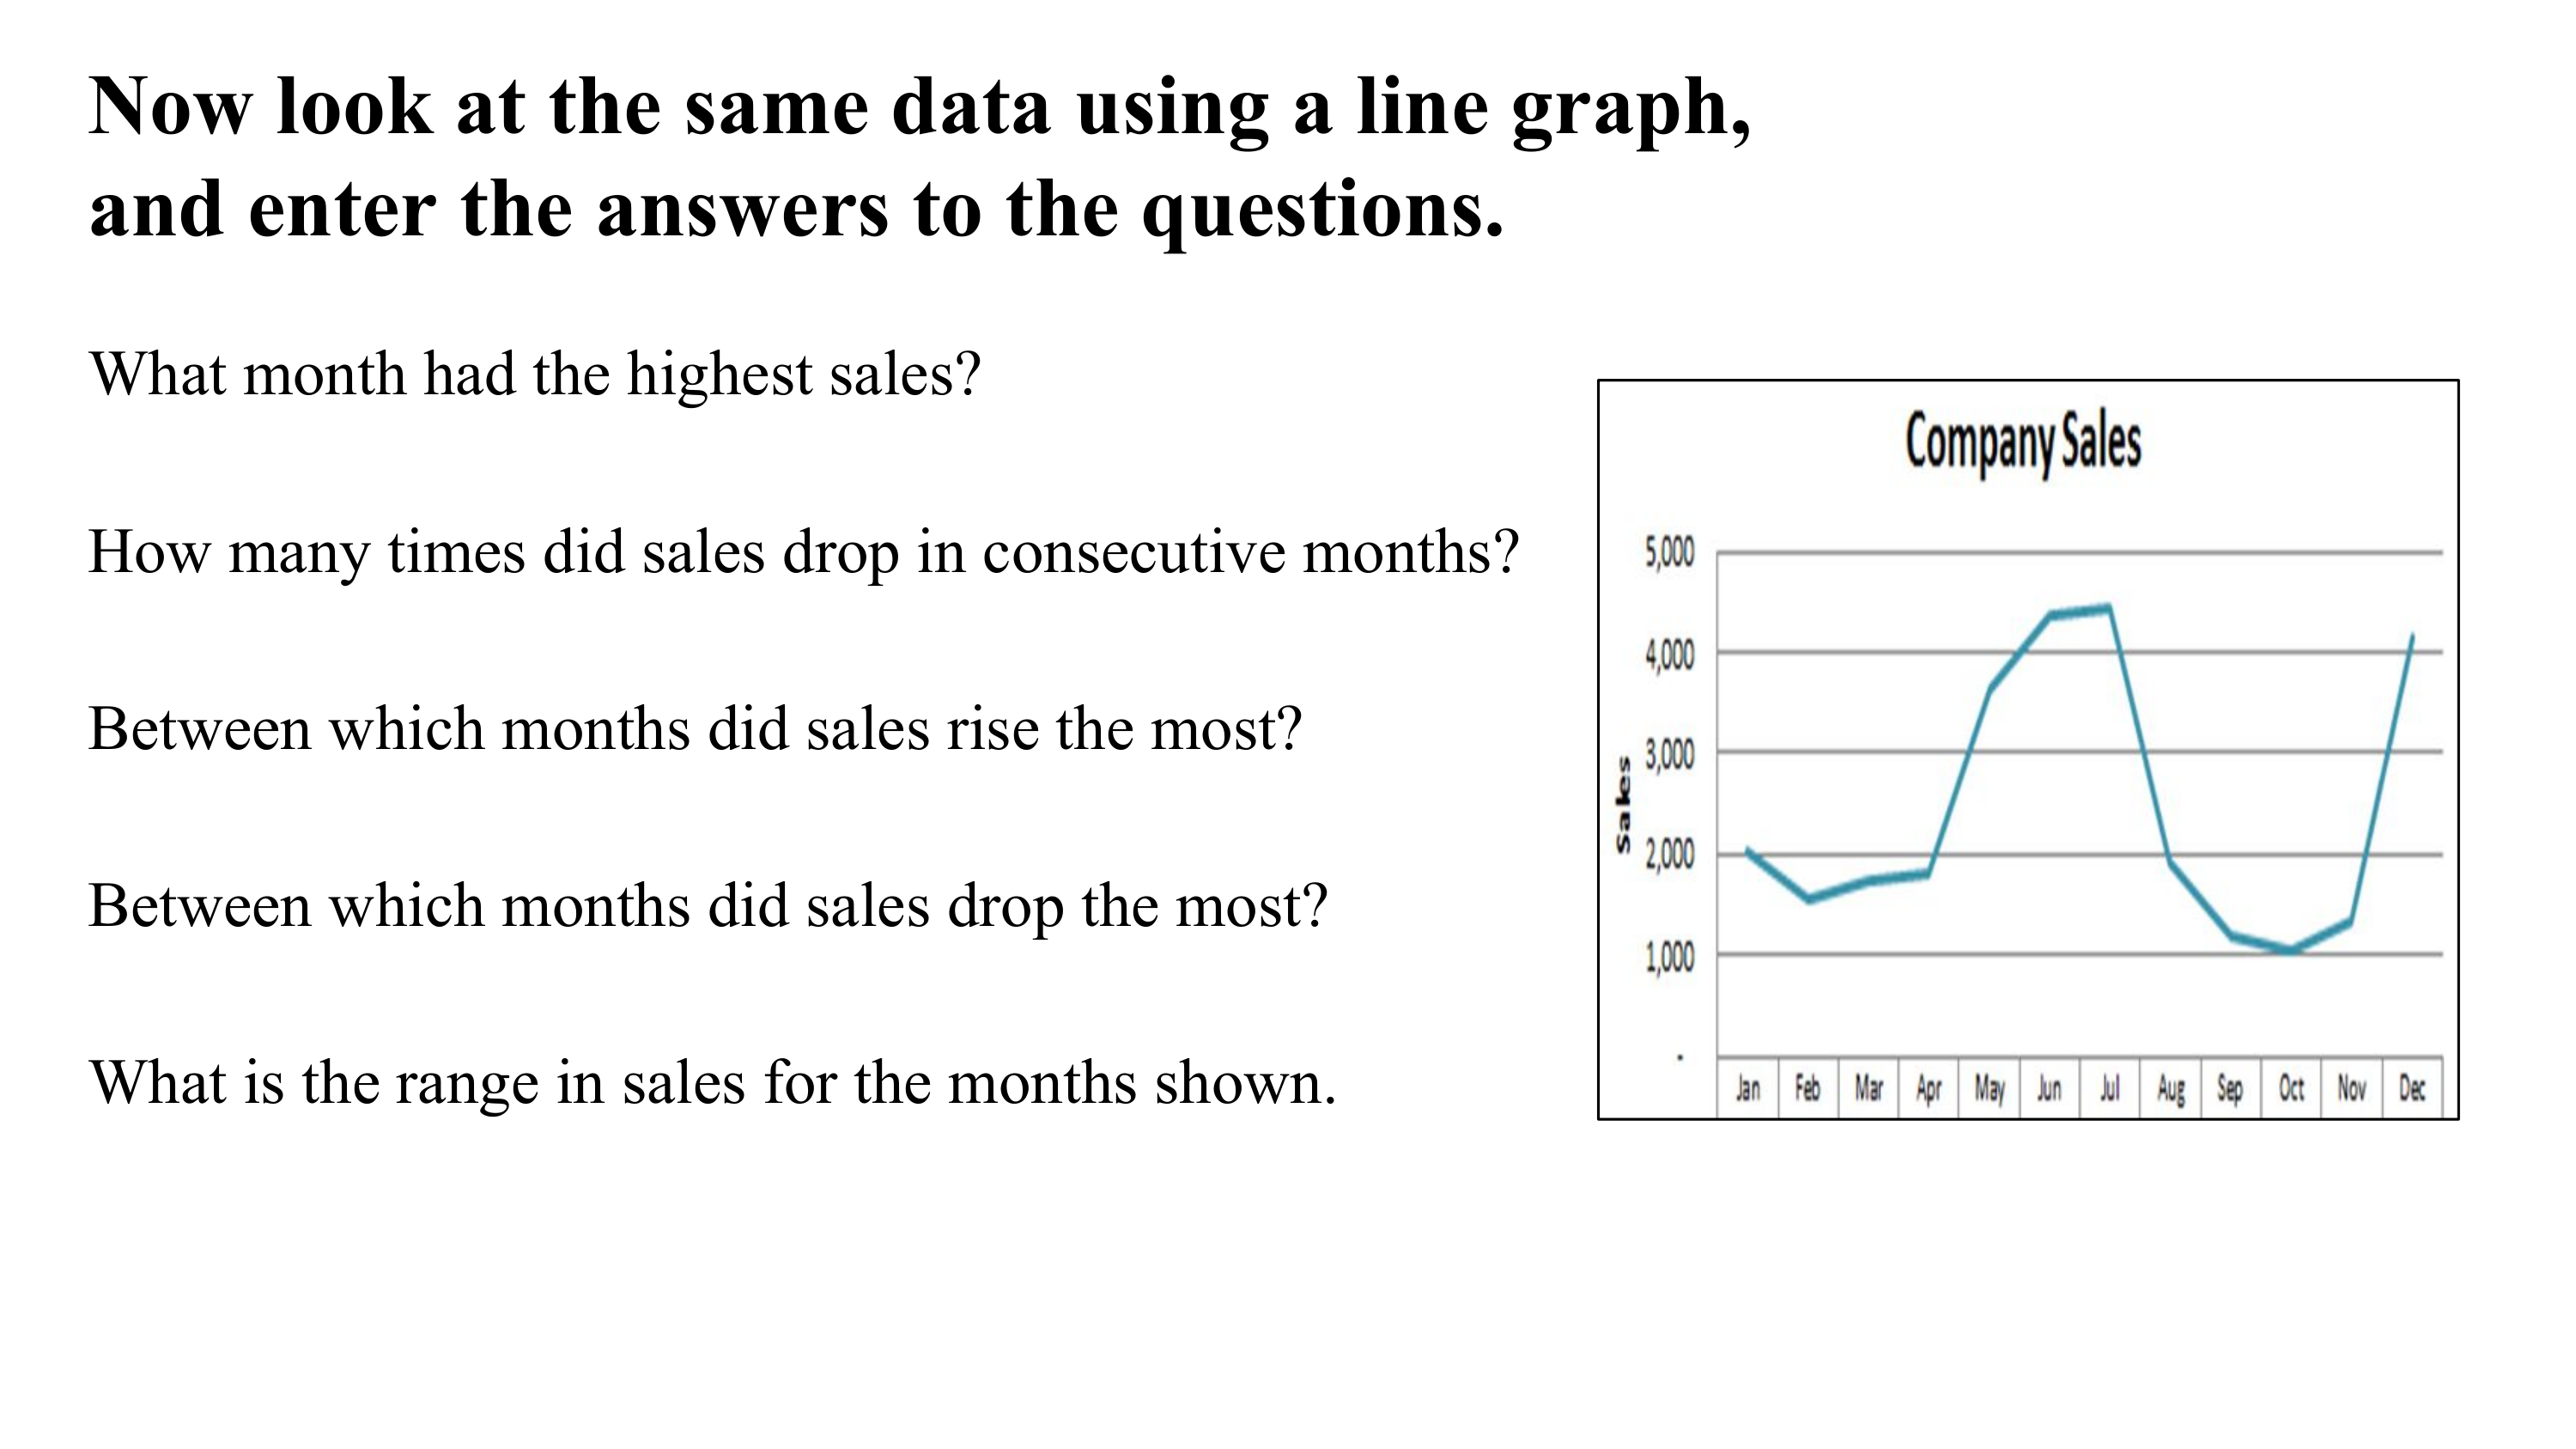
What month had the highest sales?
How many times did sales drop in consecutive months?
Between which months did sales rise the most?
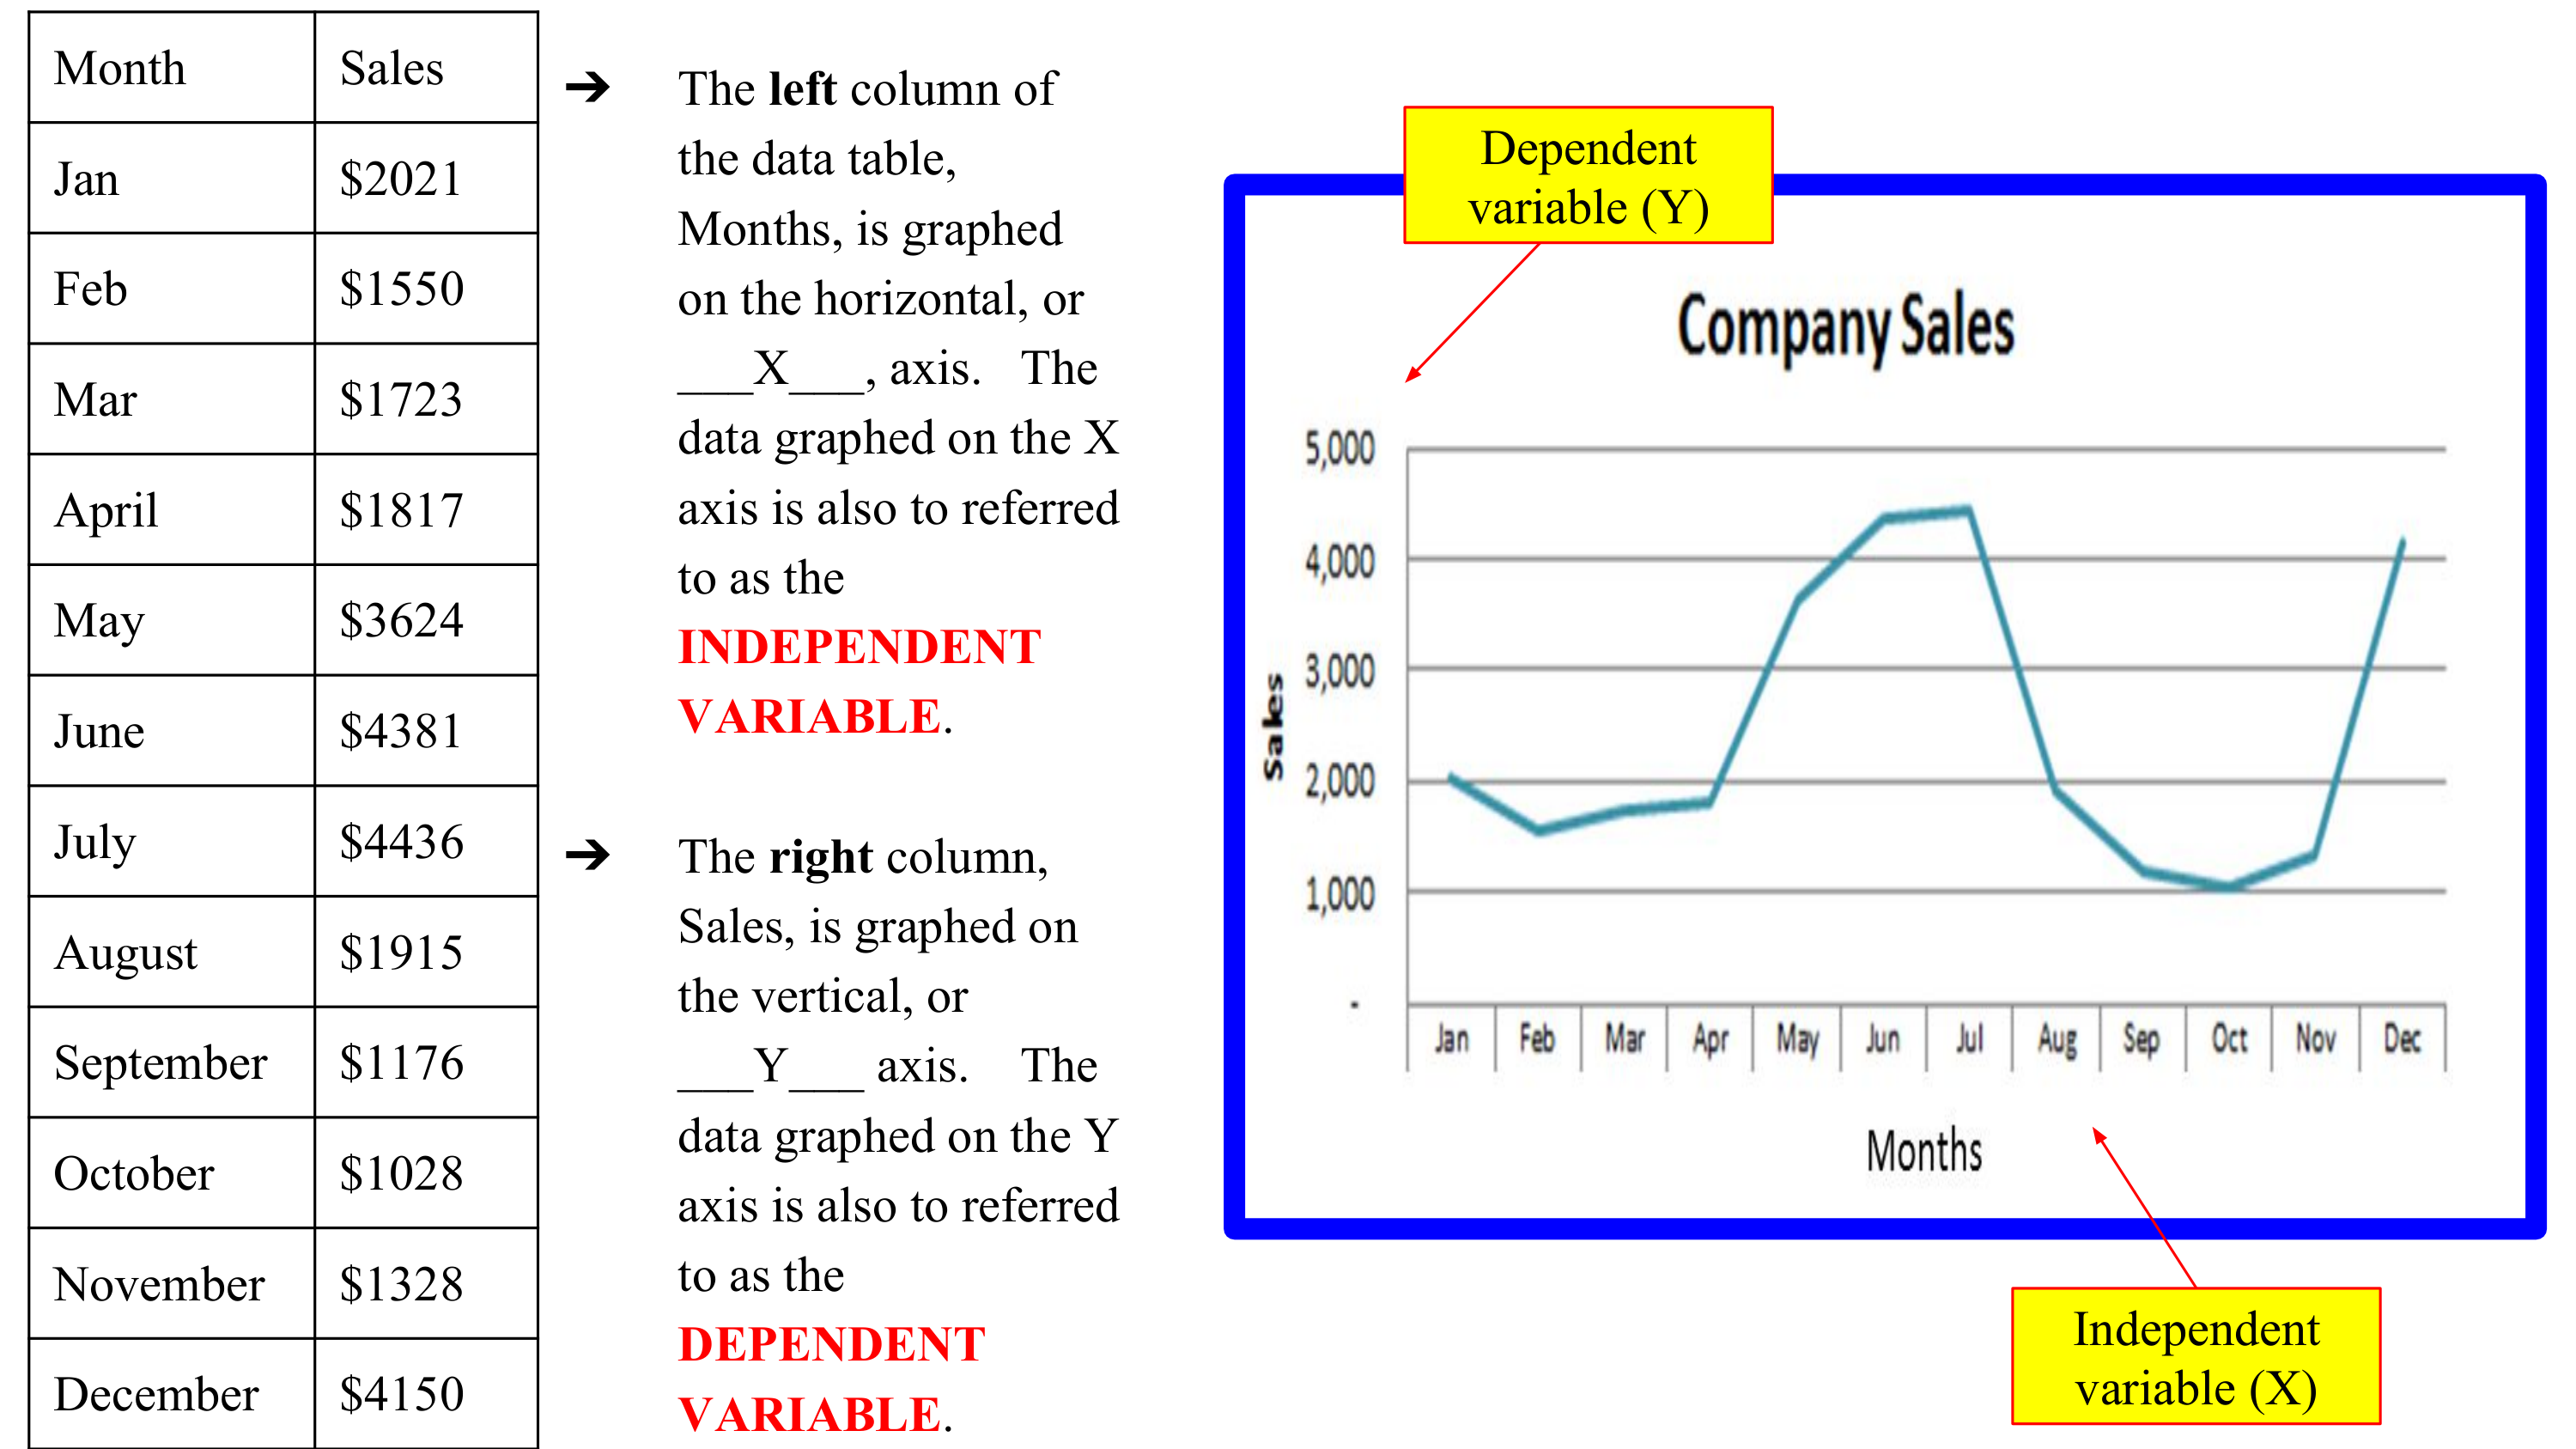
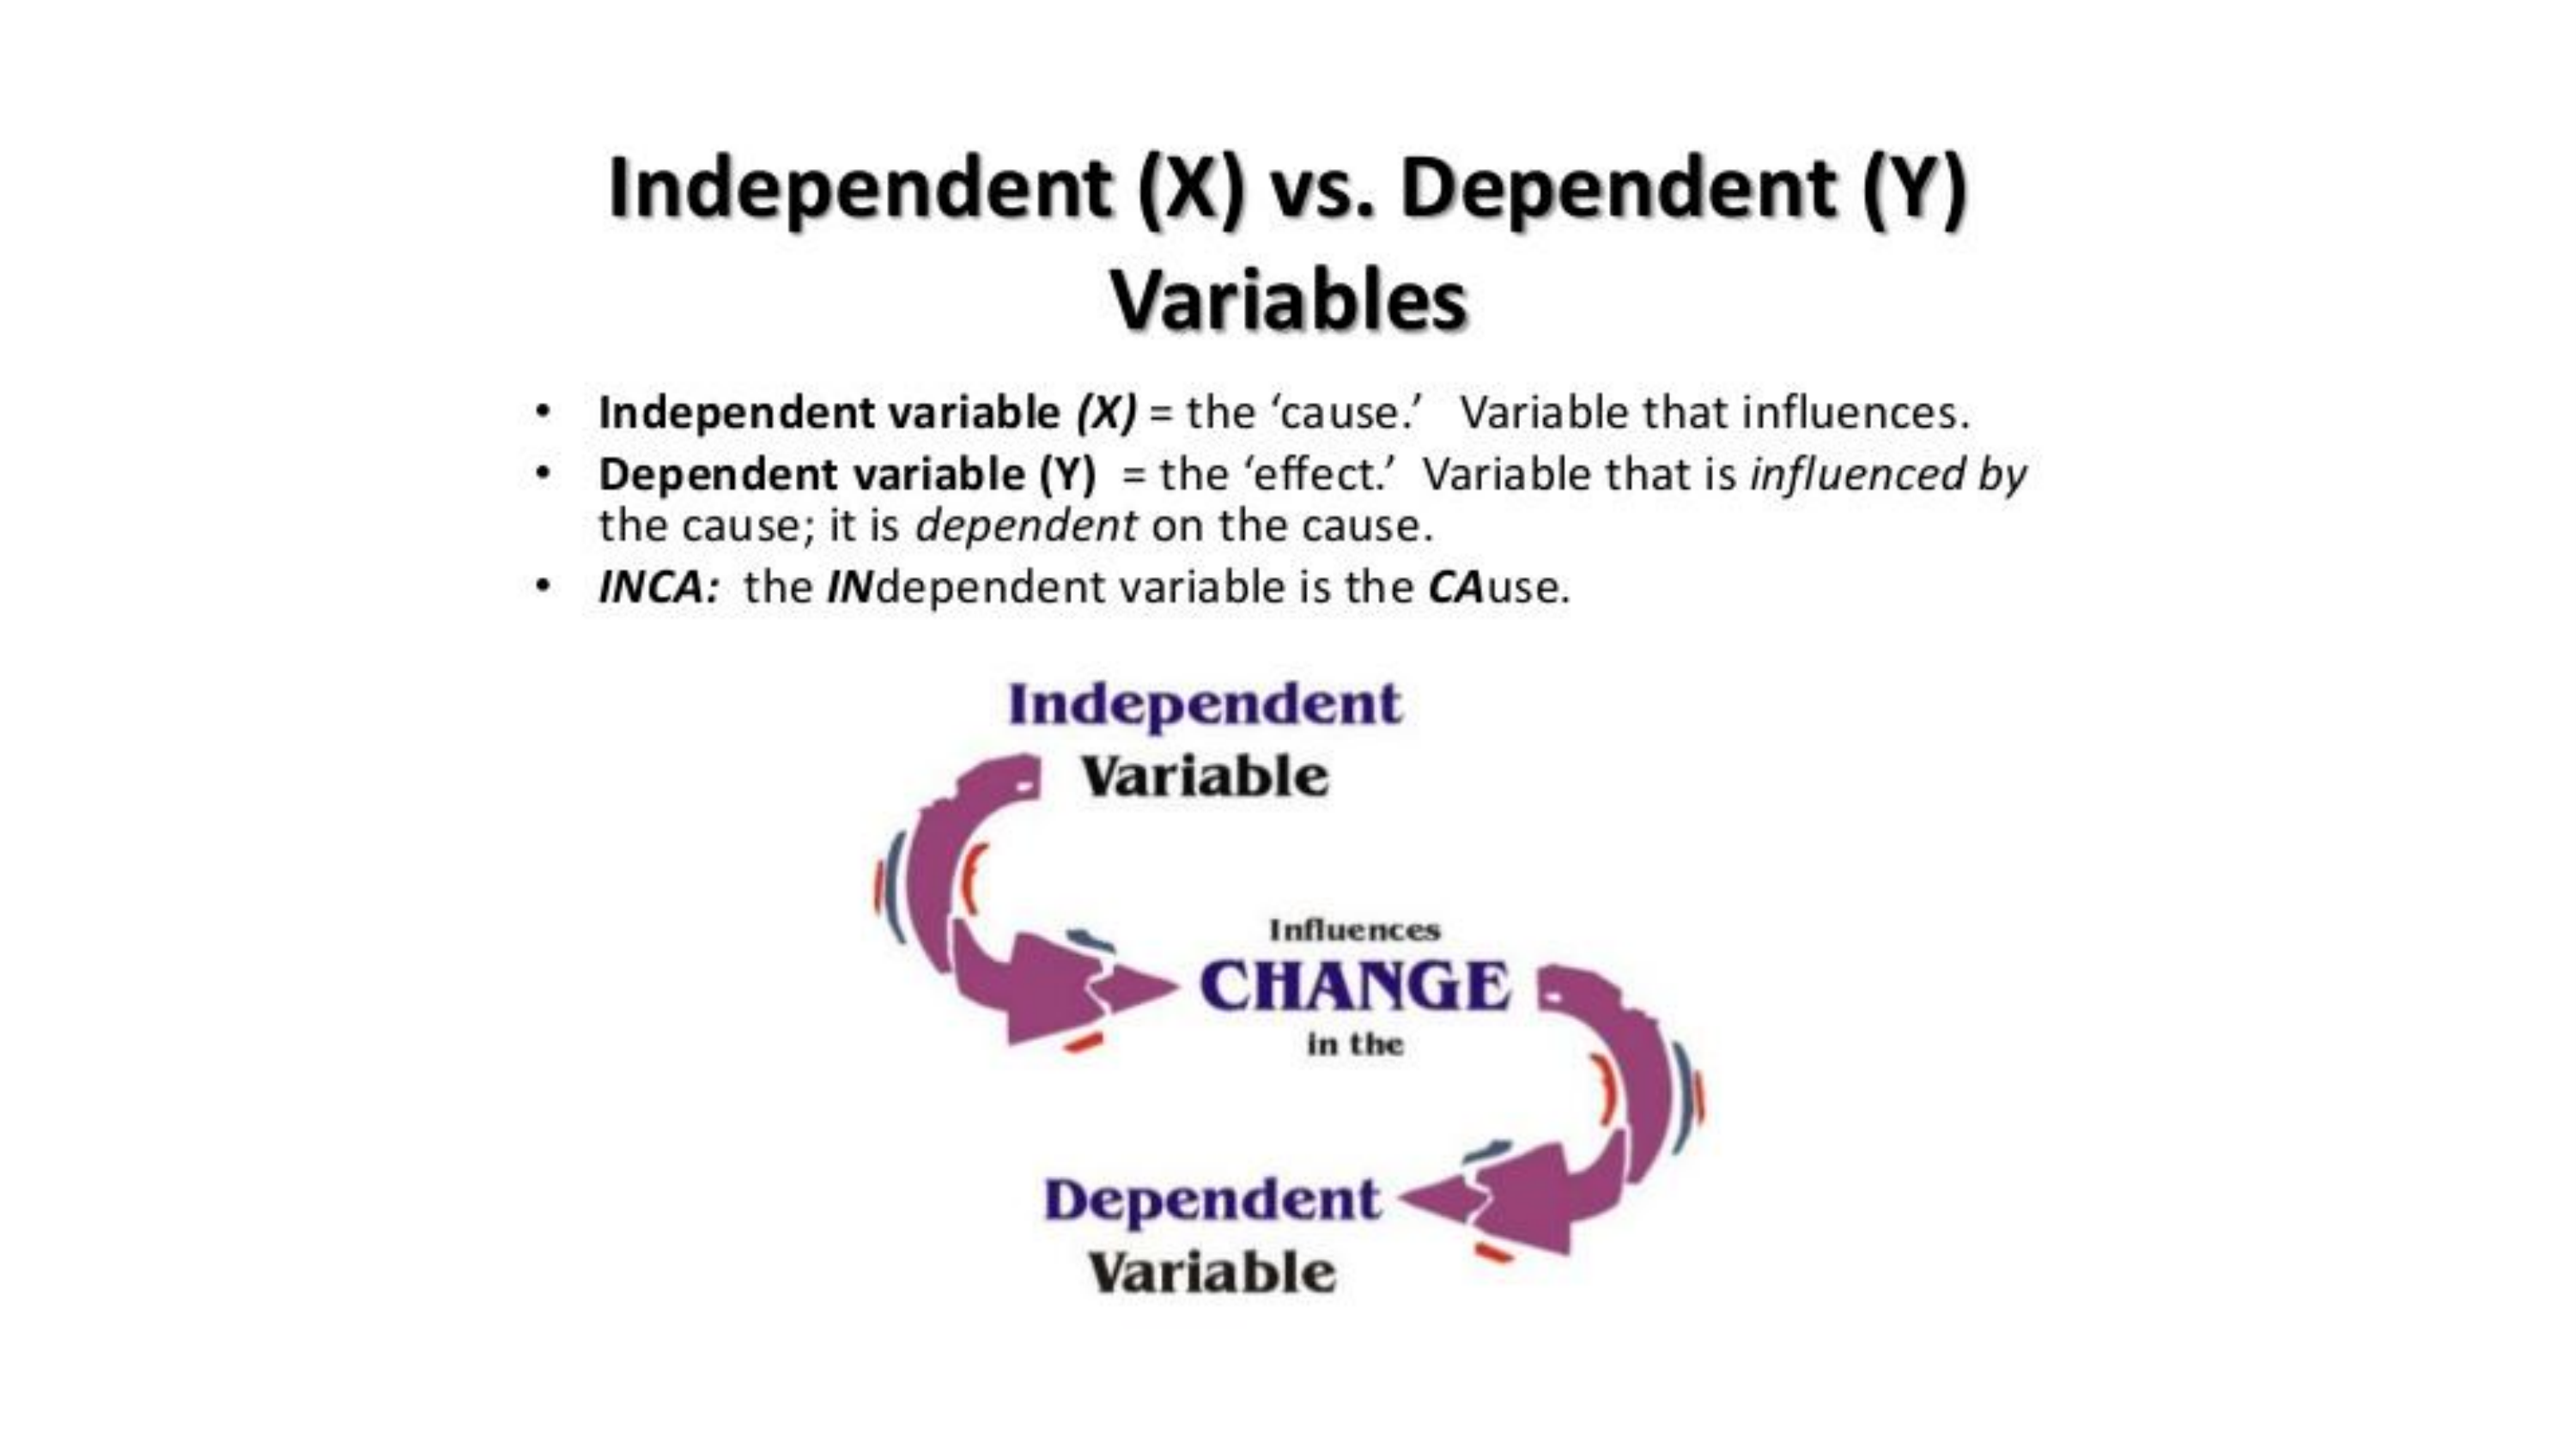
The independent variable is (select all that apply)
The dependent variable is (select all that apply)
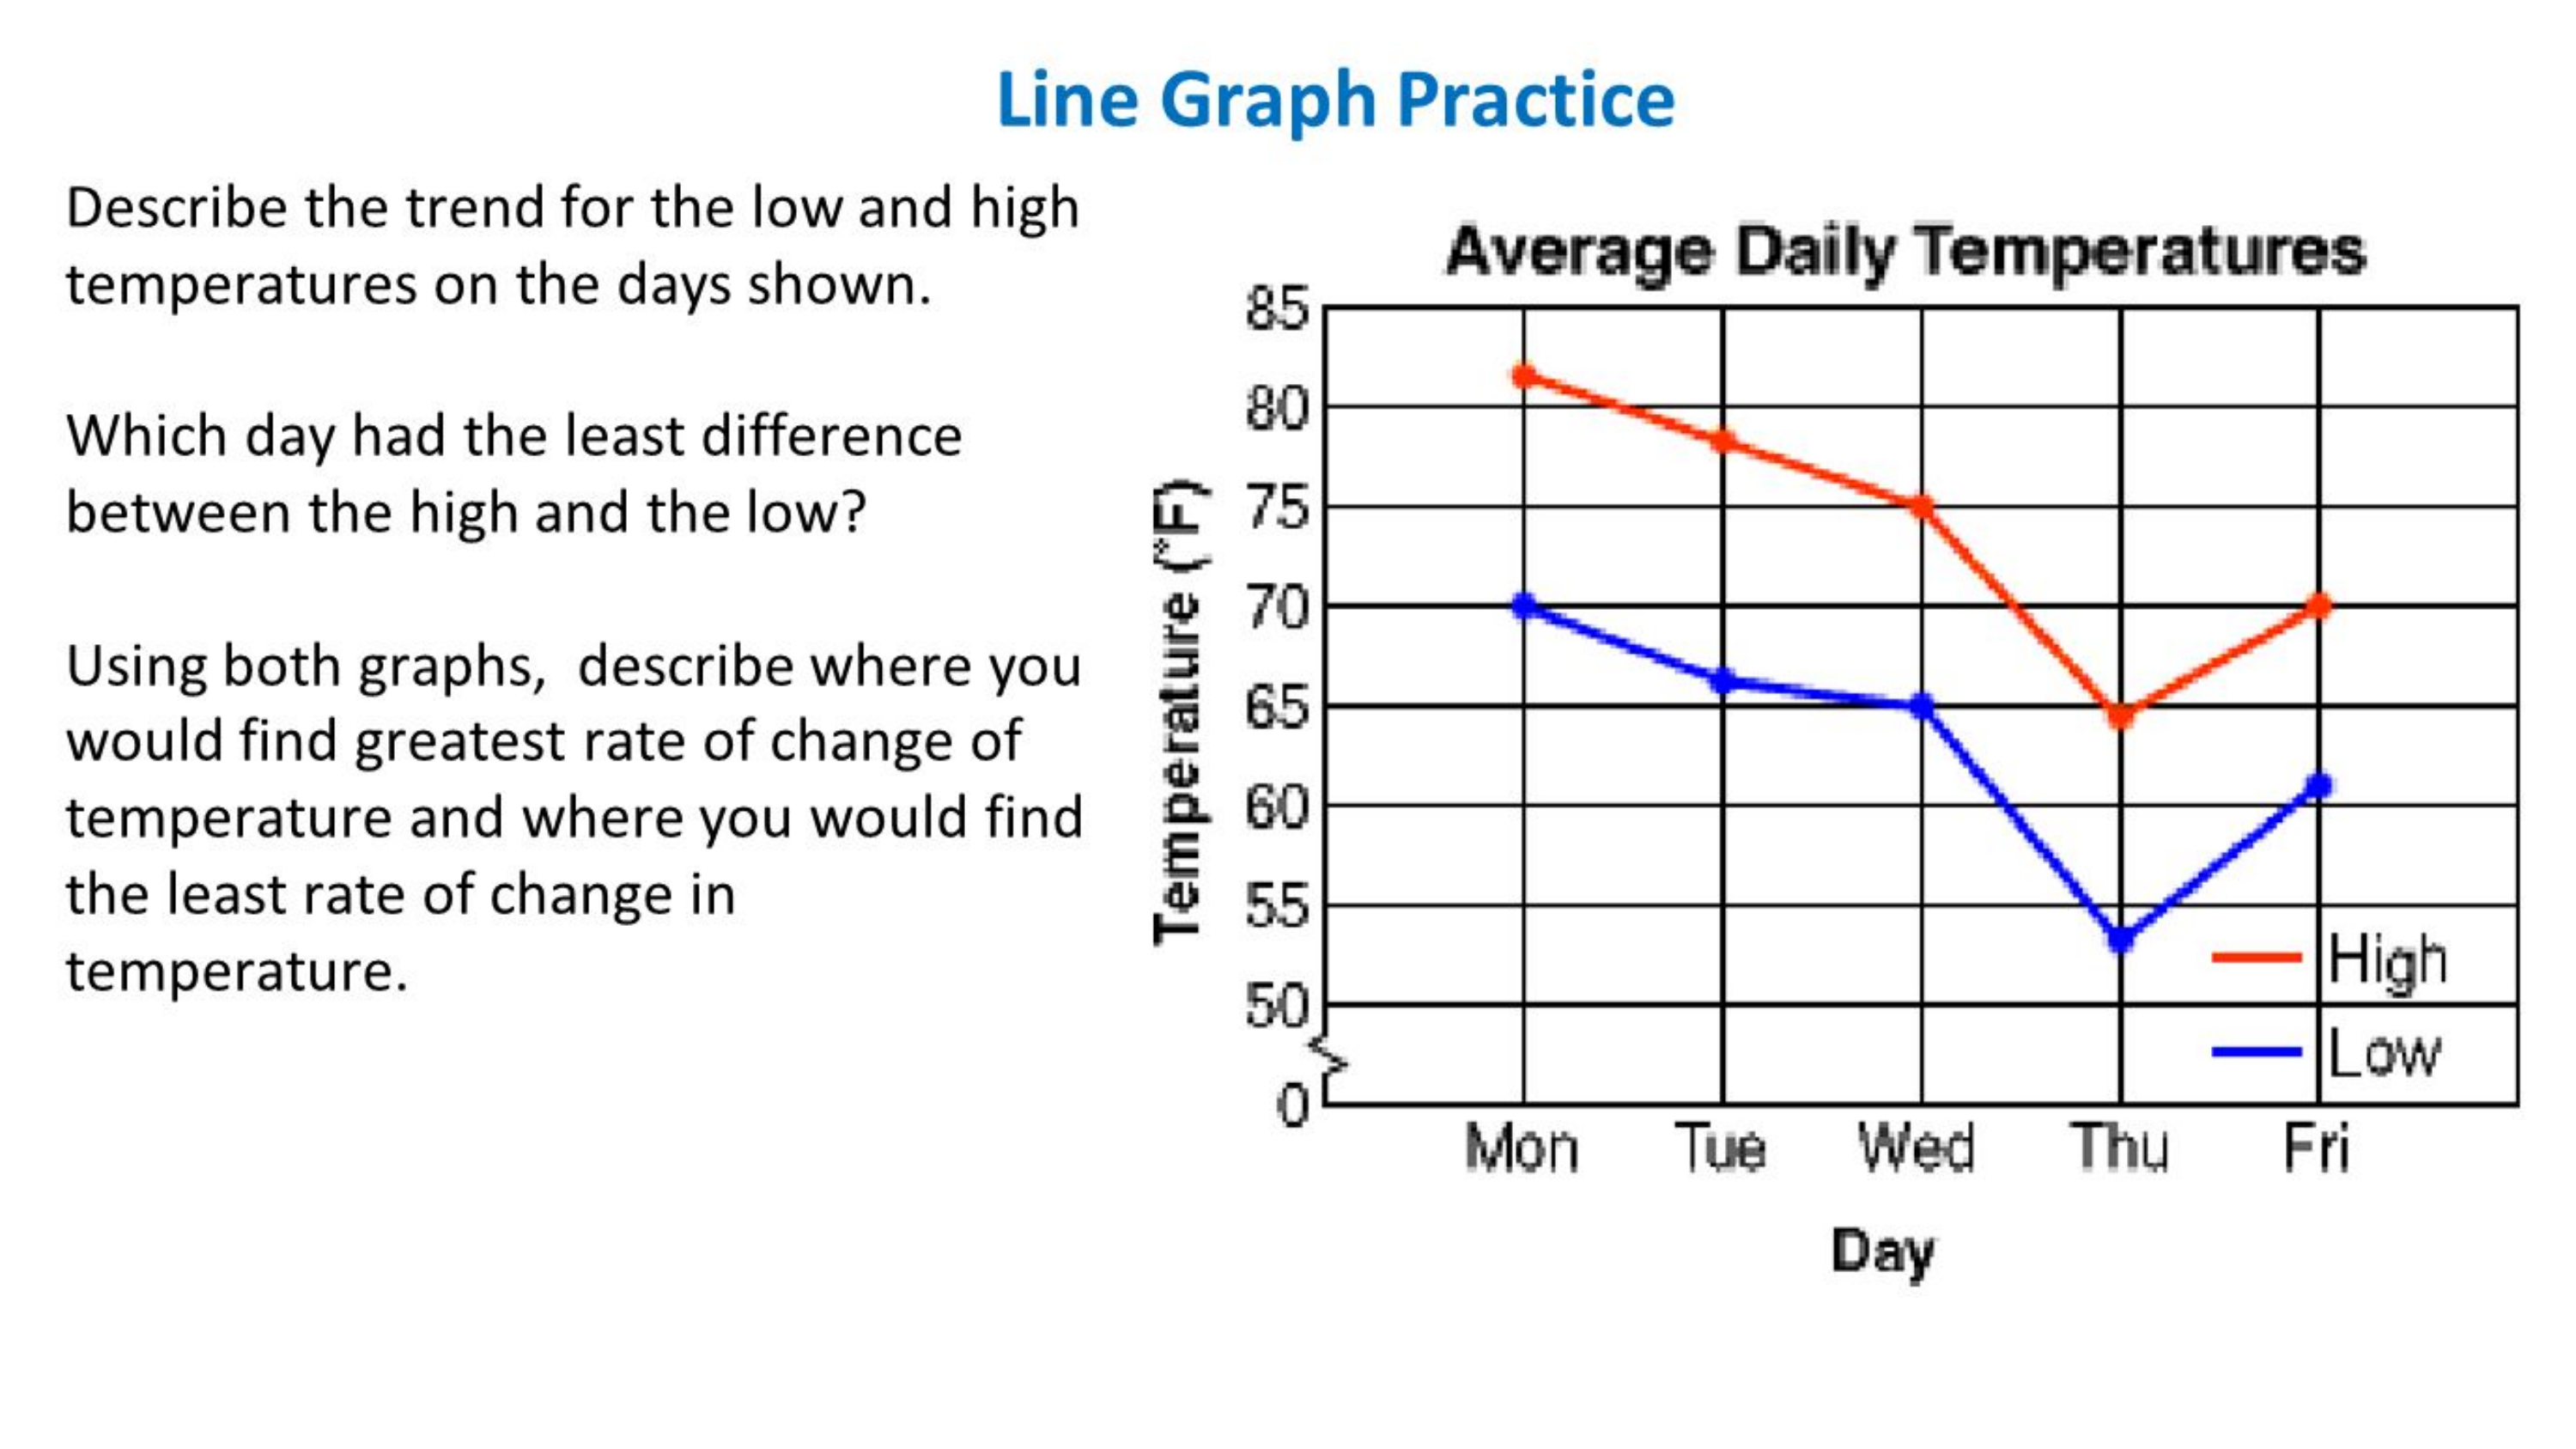
Describe the trend for the low and high temperatures on the days shown.
What did you learn from this lesson? Please write 3-5 sentences reflecting on the lesson and how you feel about reading line graphs.
Between which months did sales drop the most?
What is the range in sales for months show?
(If you don't remember how to calculate range, take a look here,
Which day had the least difference between the high and low?
Using both graphs, describe where you would find greatest rate of change of temperature.
Using both graphs, describe where you would find the lowest rate of change of temperature.