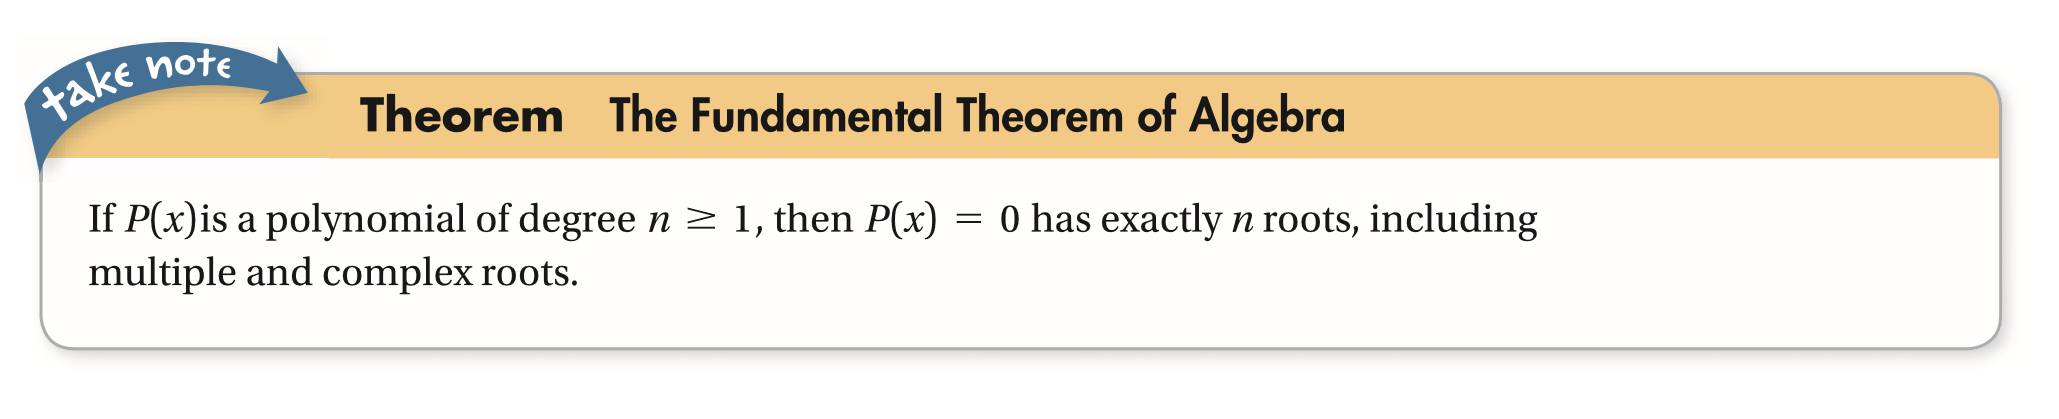
Algebra 2 5-6 Mixed Review: The Fundamental Theorem of Algebra
star
star
star
star
star
Posljednje ažuriranje over 3 years ago
5

30
30
8
A.SSE.1.a

8
9
Review Lesson 4-3:
Create a table and plot the points at desmos.com.
Create and graph a quadratic regression model for the data. Recall Desmos' quadratic regression notation: y1~ax1^2+bx1+c
Determine whether the quadratic regression model is appropriate for the data.
If the quadratic regression model is not appropriate, remove it. Otherwise, leave it on your graph.
Zoom and pan your graph to establish an appropriate viewing window.
Take a screenshot of your graph and upload or paste it onto the Formative canvas.
Review Lesson 4-2: Match each polynomial in factored form on the left with it's standard form on the right.
Vocabulary Review: Classify each expression based on whether or not it is a trinomial.
Trinomial
NOT a trinomial
Use Your Vocabulary: Classify each statement as true or false.
The fundamental idea of geometry is the study the provable properties of shapes.
A fundamental idea in the Declaration of Independence is that all people have the right to life, liberty, and the pursuit of happiness.
A fundamental rule of history is that kings are always right.
True
False