Algebra 2 5-9 Mixed Review: Transforming Polynomial Functions
star
star
star
star
star
Posljednje ažuriranje over 3 years ago
8

30
30
20
10
F.IF.1

10
10
8
G.CO.2
Review Lesson 4-3:
Create a table and plot the points at desmos.com.
Create and graph a polynomial function that includes ALL of the given points. Use Desmos' regression notation.
Zoom and pan your graph to establish an appropriate viewing window.
Take a screenshot of your graph and upload or paste it onto the Formative canvas.
Review Lesson 2-4: Graph the lines described below.
Graph 1
slope:
includes the point:
Graph 2
slope:
y-intercept:
Review Lesson 2-1: Classify each relation.
Function
Not a function
Vocabulary Review: Identify the constant in the expression.
Vocabulary Review: Identify the expressions that do not contain a constant term. Select all that apply.
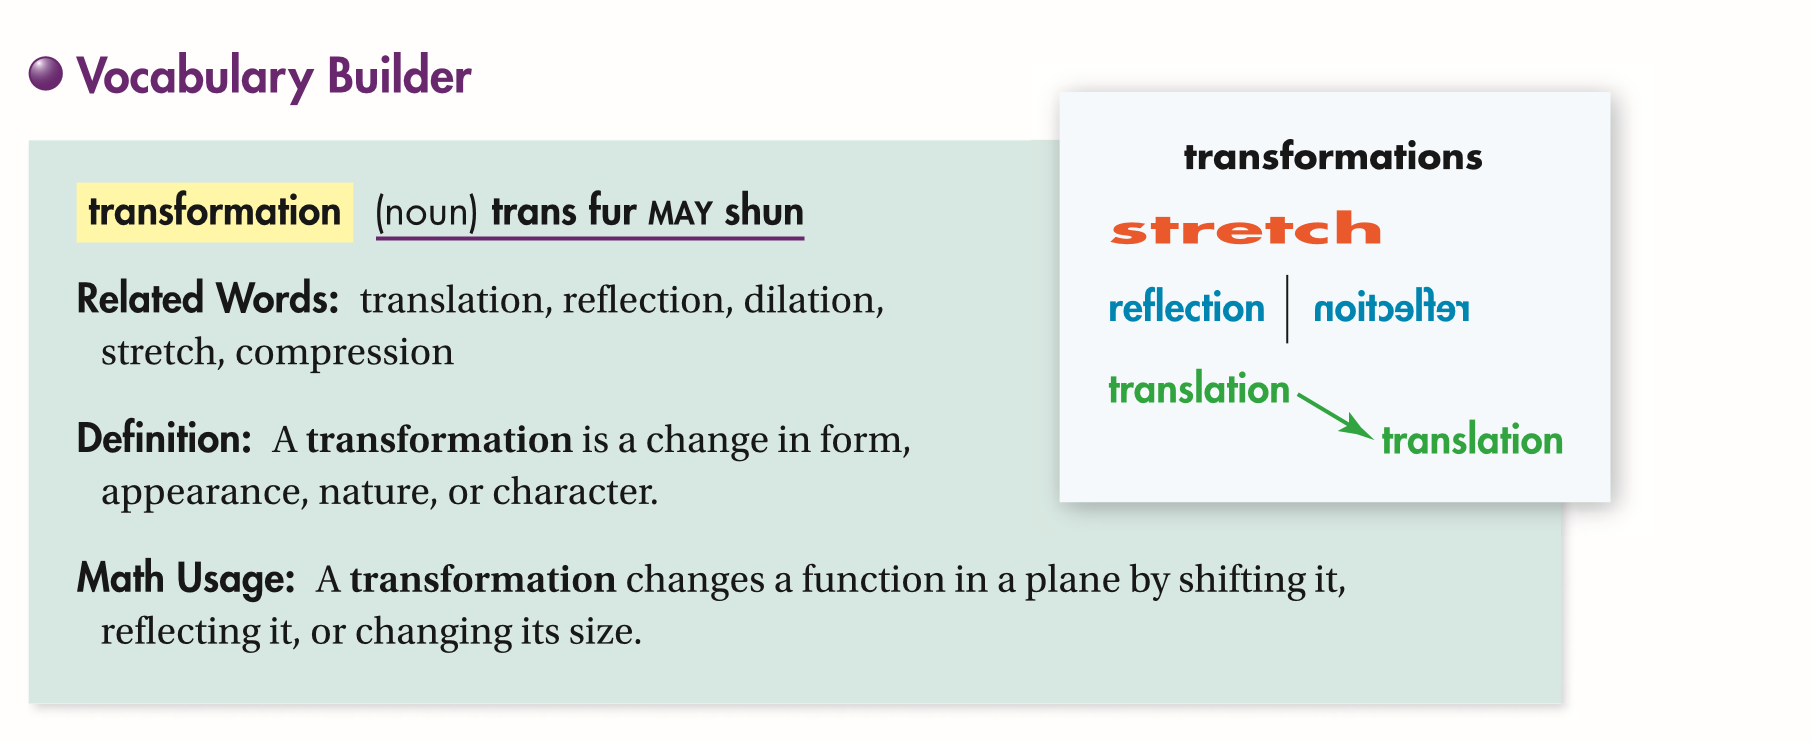
Use Your Vocabulary: Identify the translation, reflection, stretch, and compression of the word Algebra.


Translation
Reflection
Stretch
Compression

Key Concept: Identify the function(s) that are NOT Power Functions.