Twa kɔ nsɛm atitiriw so
Log in
Sign up for FREE
arrow_back
Laabri

Algebra 2 5-8 Complete Lesson: Polynomial Models in the Real World

star
star
star
star
star
Last updated over 4 years ago
26 Nsɛmmisa
Hyɛ no nsow a efi ɔkyerɛwfo no hɔ:

A complete formative lesson with embedded slideshow, mini lecture screencasts, checks for understanding, practice items, mixed review, and reflection. I create these assignments to supplement each lesson of Pearson's Common Core Edition Algebra 1, Algebra 2, and Geometry courses. See also mathquest.net and twitter.com/mathquestEDU.

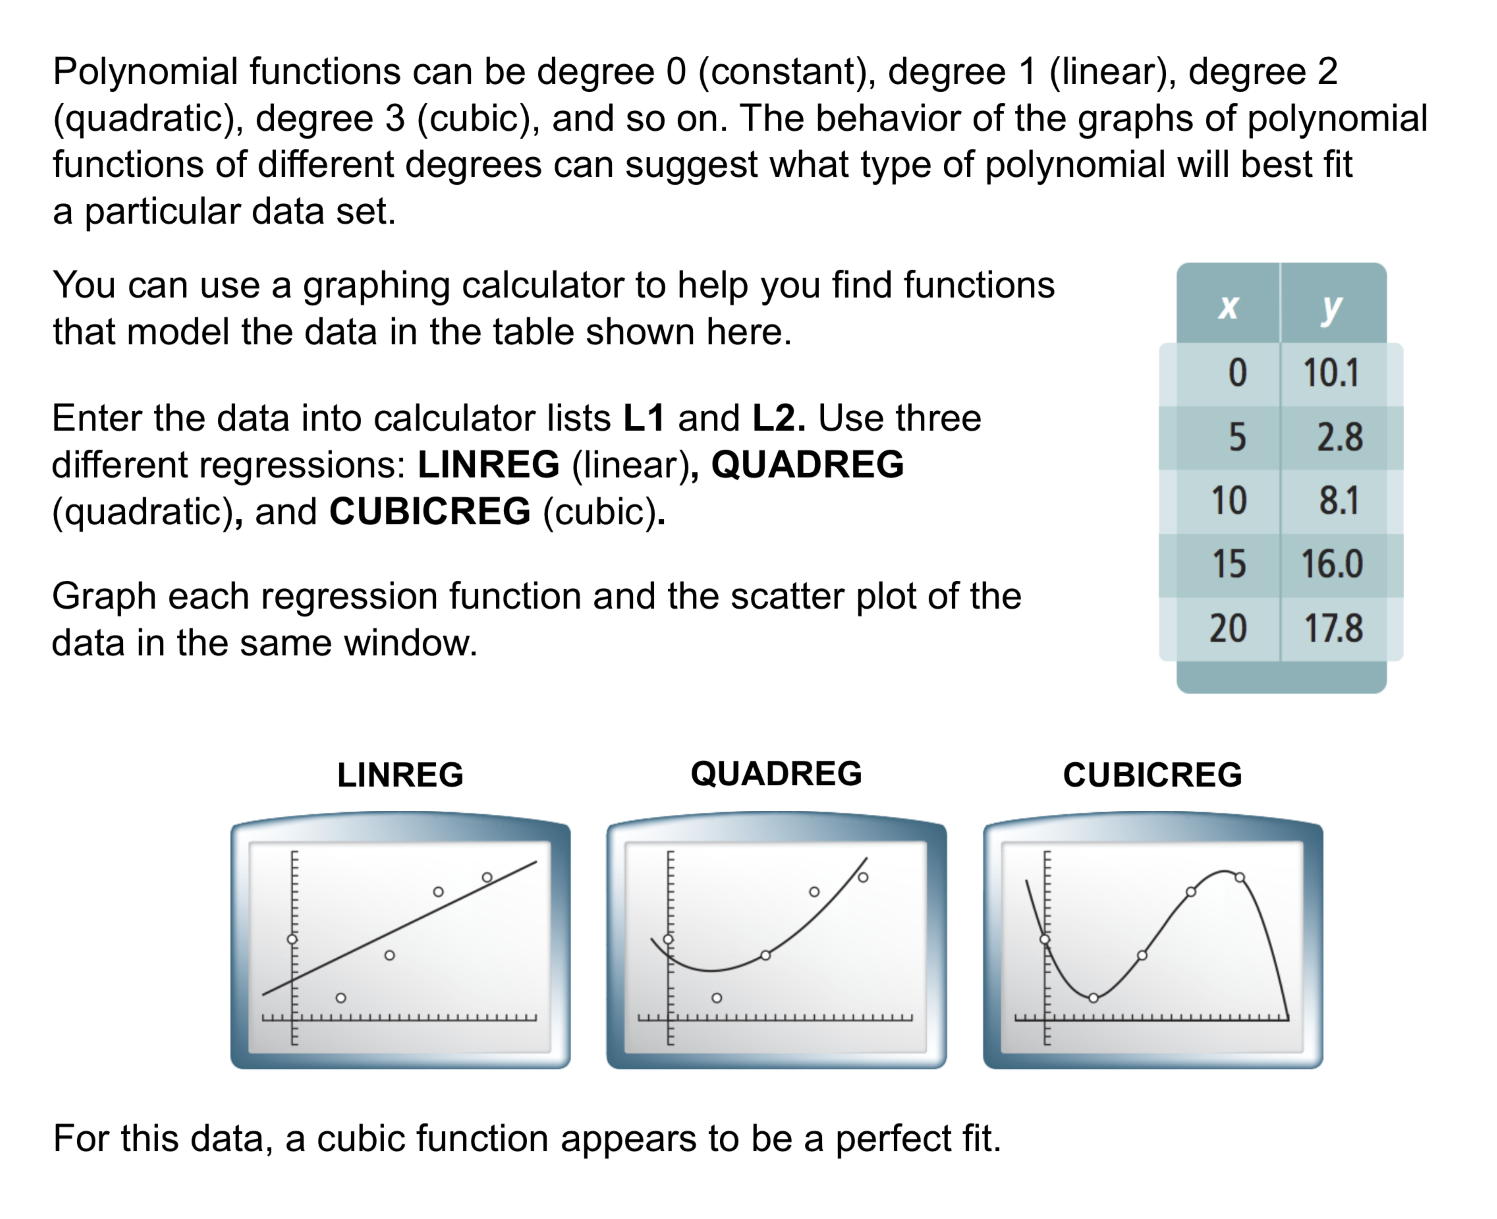
5
F.IF.5
10
F.IF.4
F.IF.5

30
F.IF.4
F.IF.5
F.IF.6
10
F.IF.5
F.IF.6

10
F.IF.5
10
F.IF.5
10

10
A.APR.5
10
A.APR.5
10
10
10
10
10
F.IF.7.a

10
10
100
10
F.IF.4
F.IF.5
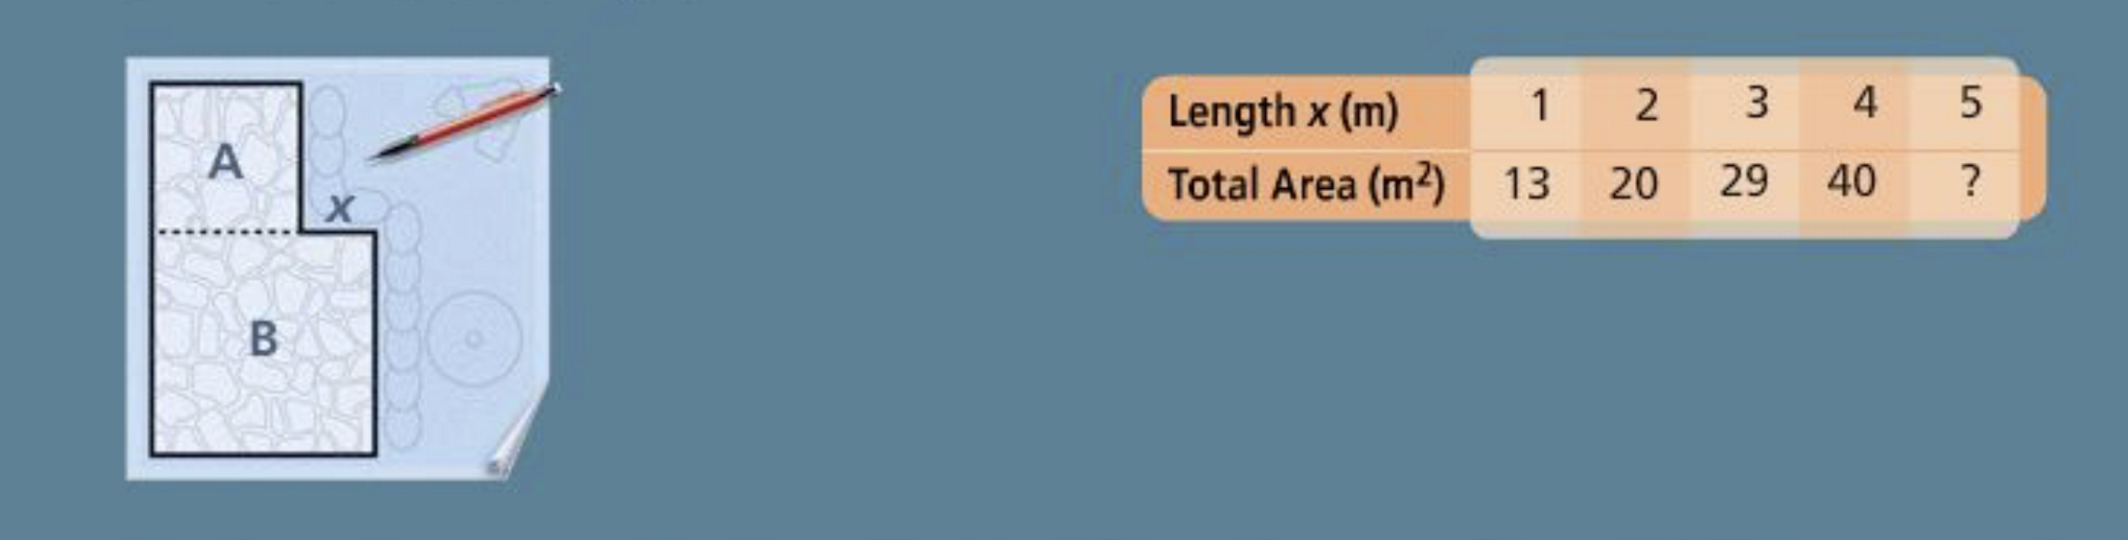
You are designing a patio. Square A is where you will place your grill. You are experimenting with your design by varying the size of square B.

The table shows the total patio area for each of five different lengths x.

10
F.IF.5
10
F.IF.5
F.IF.6
Asemmisa {{asɛmmisaAhyɛnsode}}
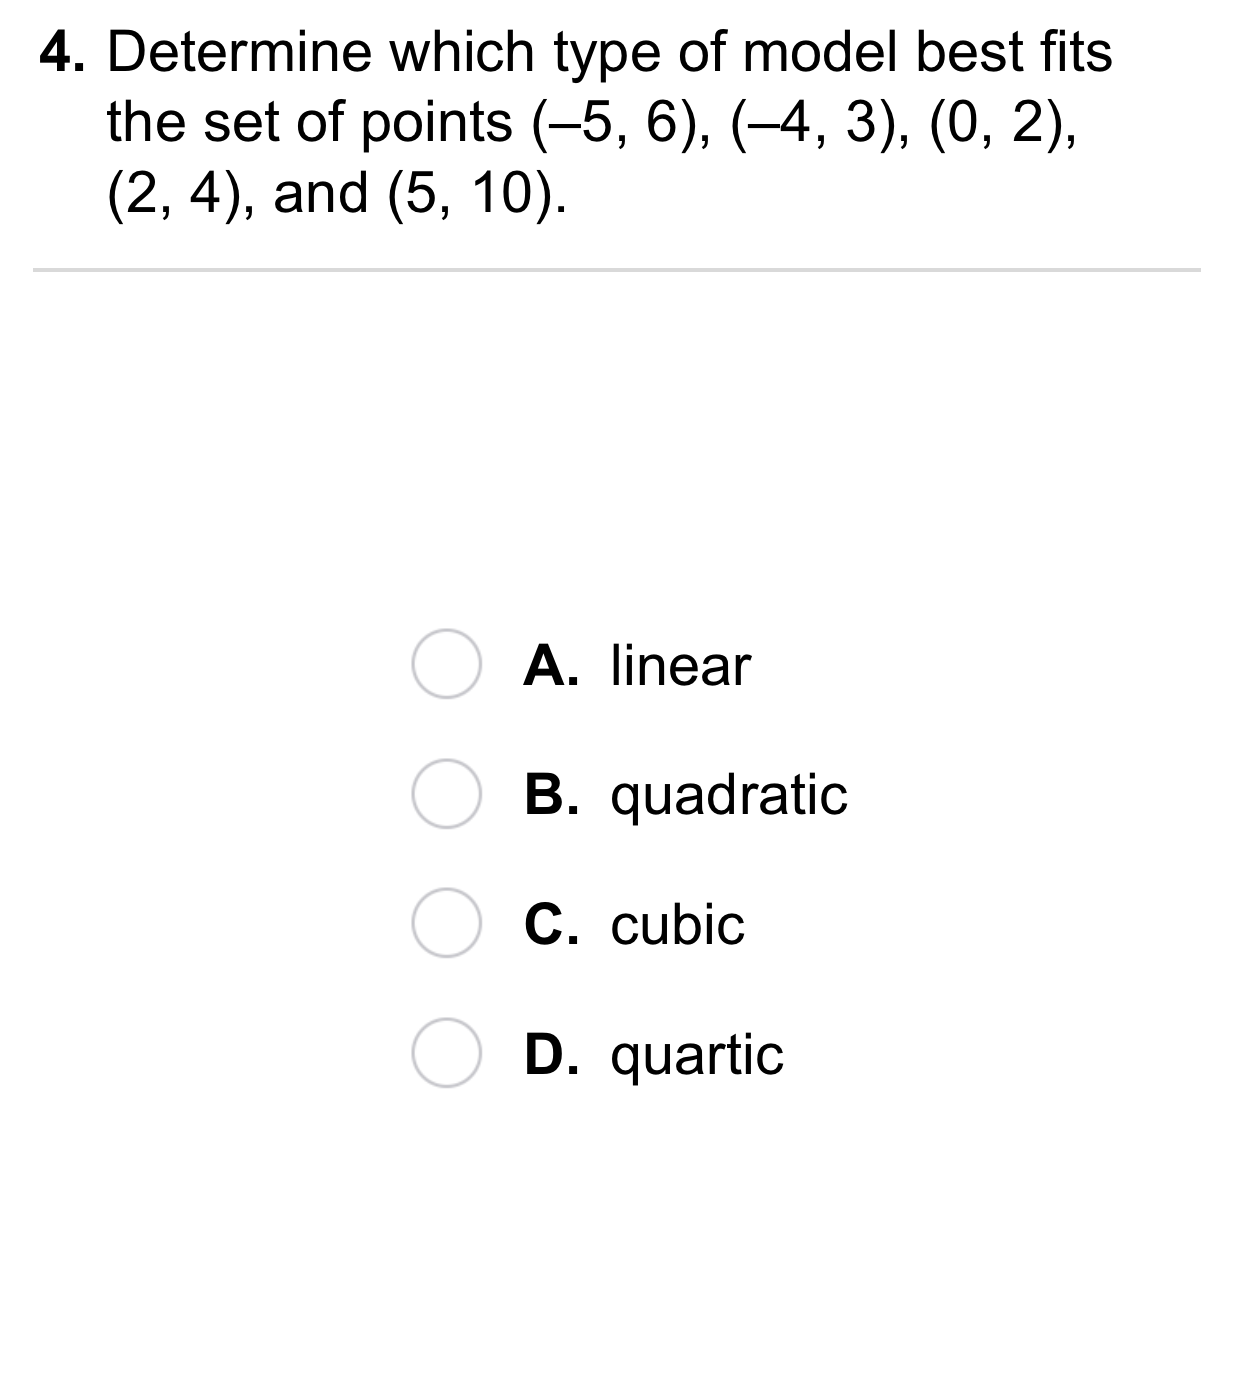
3.

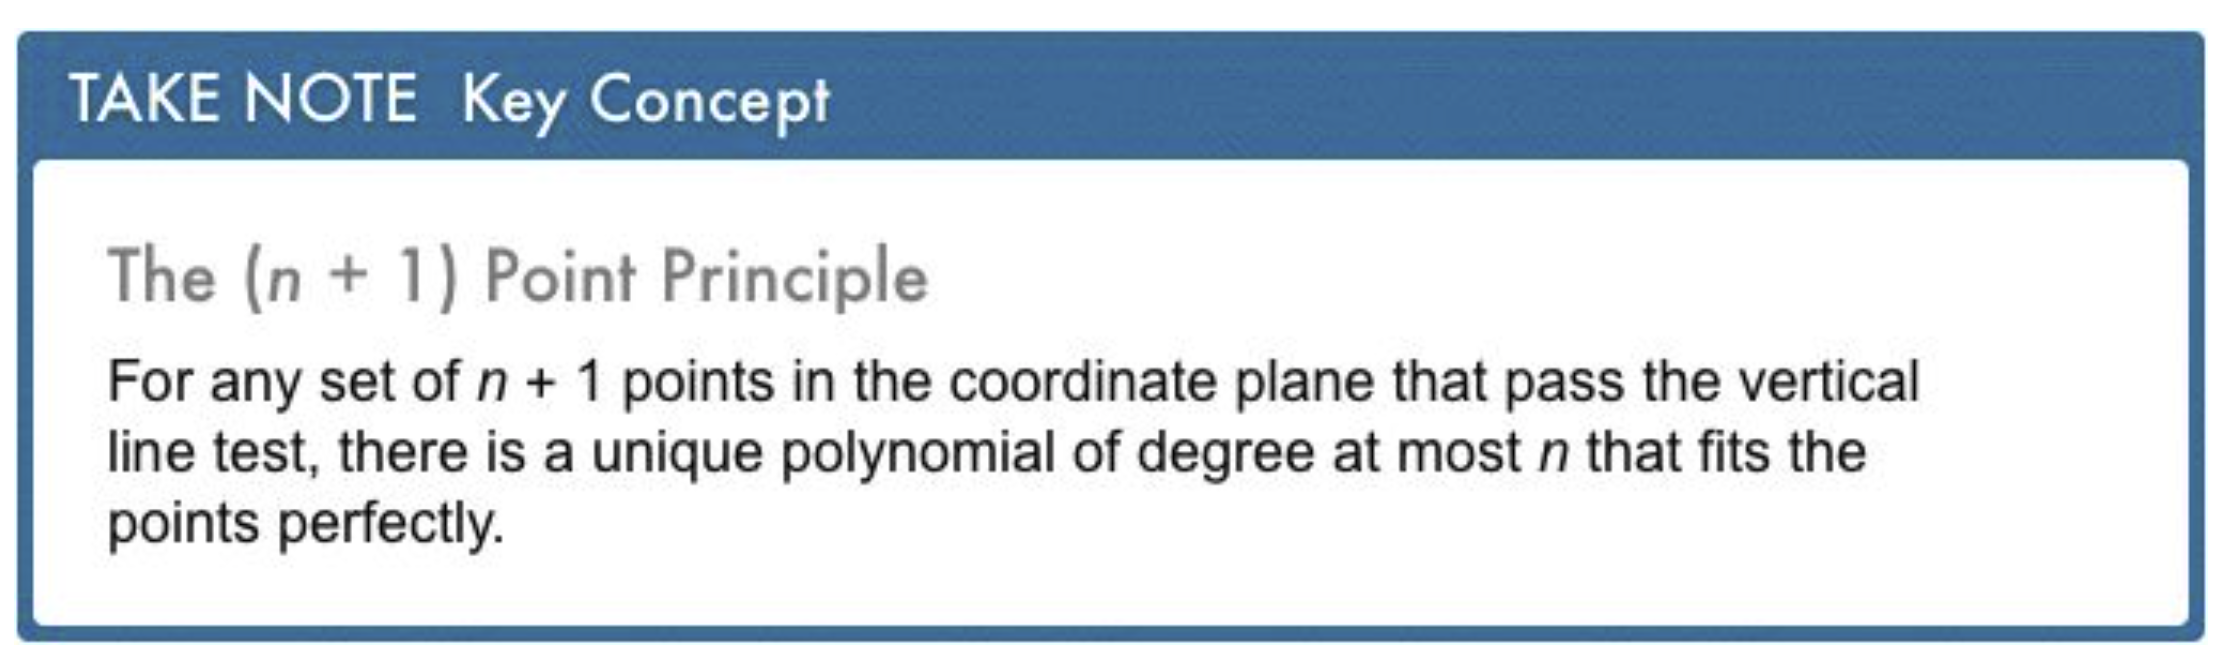
In Your Own Words: Restate the (n + 1) Point Principle in your own words.

10
Asemmisa {{asɛmmisaAhyɛnsode}}
4.

Problem 1 Got It?

10
Asemmisa {{asɛmmisaAhyɛnsode}}
5.

Problem 2 Got It?

F.IF.5
Asemmisa {{asɛmmisaAhyɛnsode}}
6.

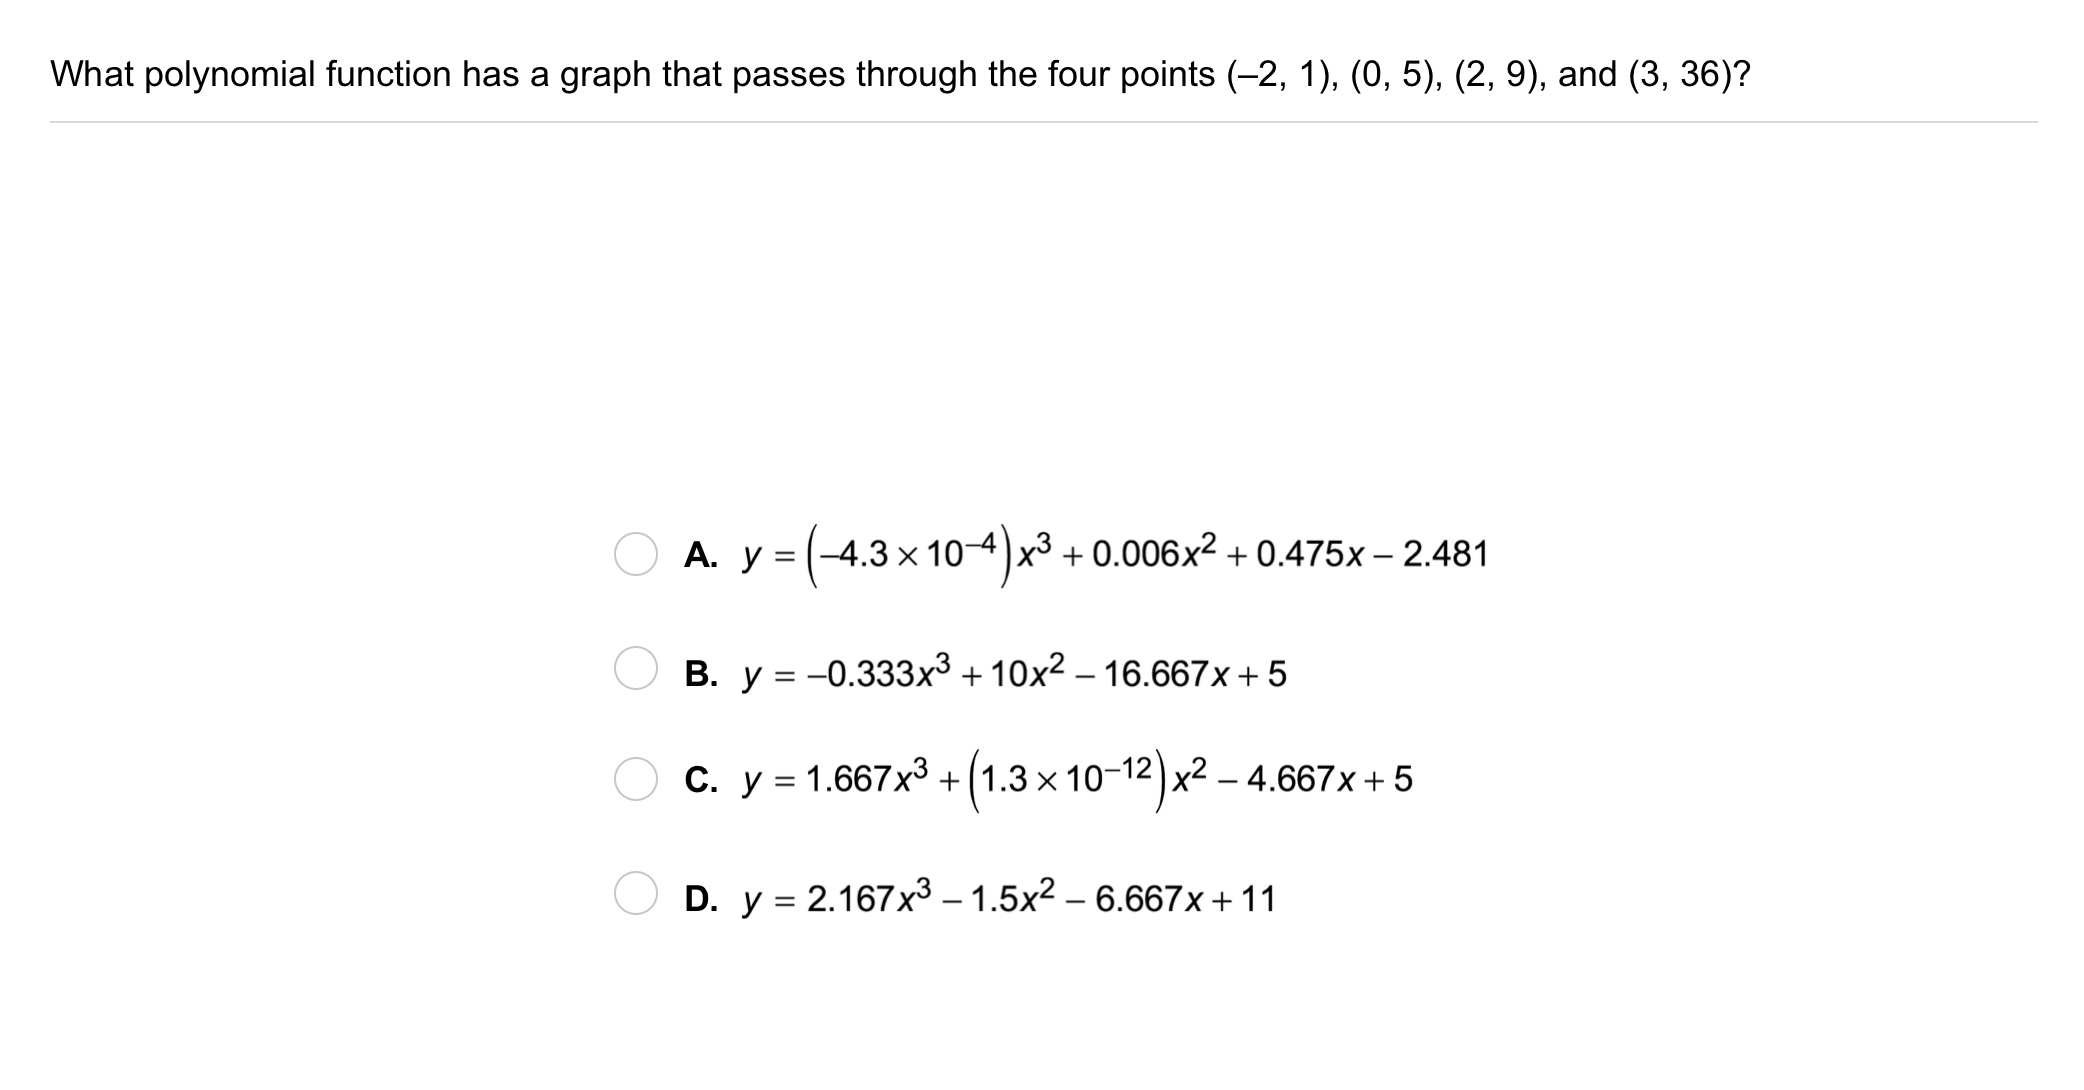
Problem 3 Got It? If four data points are given, which type of regression function guarantee ensure a perfect fit?

Asemmisa {{asɛmmisaAhyɛnsode}}
7.

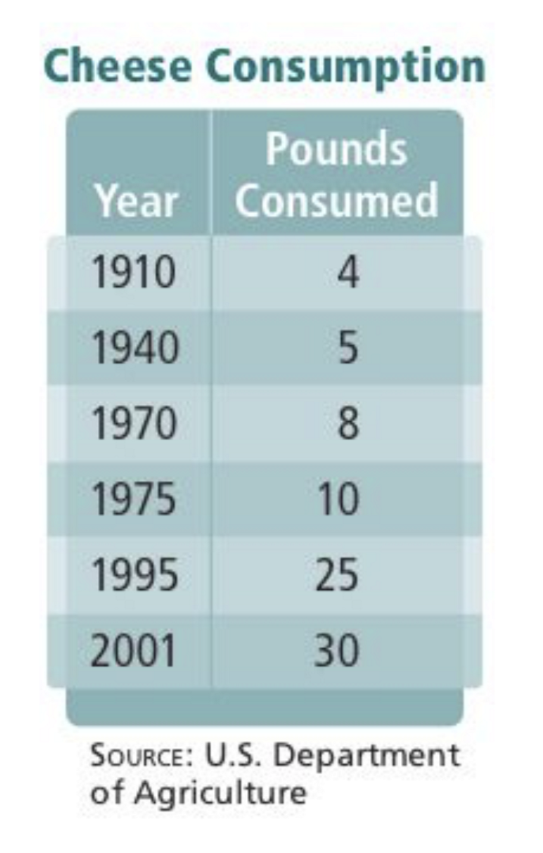
Problem 4 Got It? Create a table in the embedded Desmos utility and use it to find a linear regression model of the cheese consumption data. Let x = years since 1900.

Recall Desmos' linear regression notation: y1~ax1+b.

Zoom and pan your graph to establish an appropraite viewing window that contains all data points and the regression line.

Yɛayi Graphing asɛmmisa type foforo a wɔatu mpɔn adi! Asuafo rentumi mmua saa asɛmmisa yi bio.
Asemmisa {{asɛmmisaAhyɛnsode}}
8.

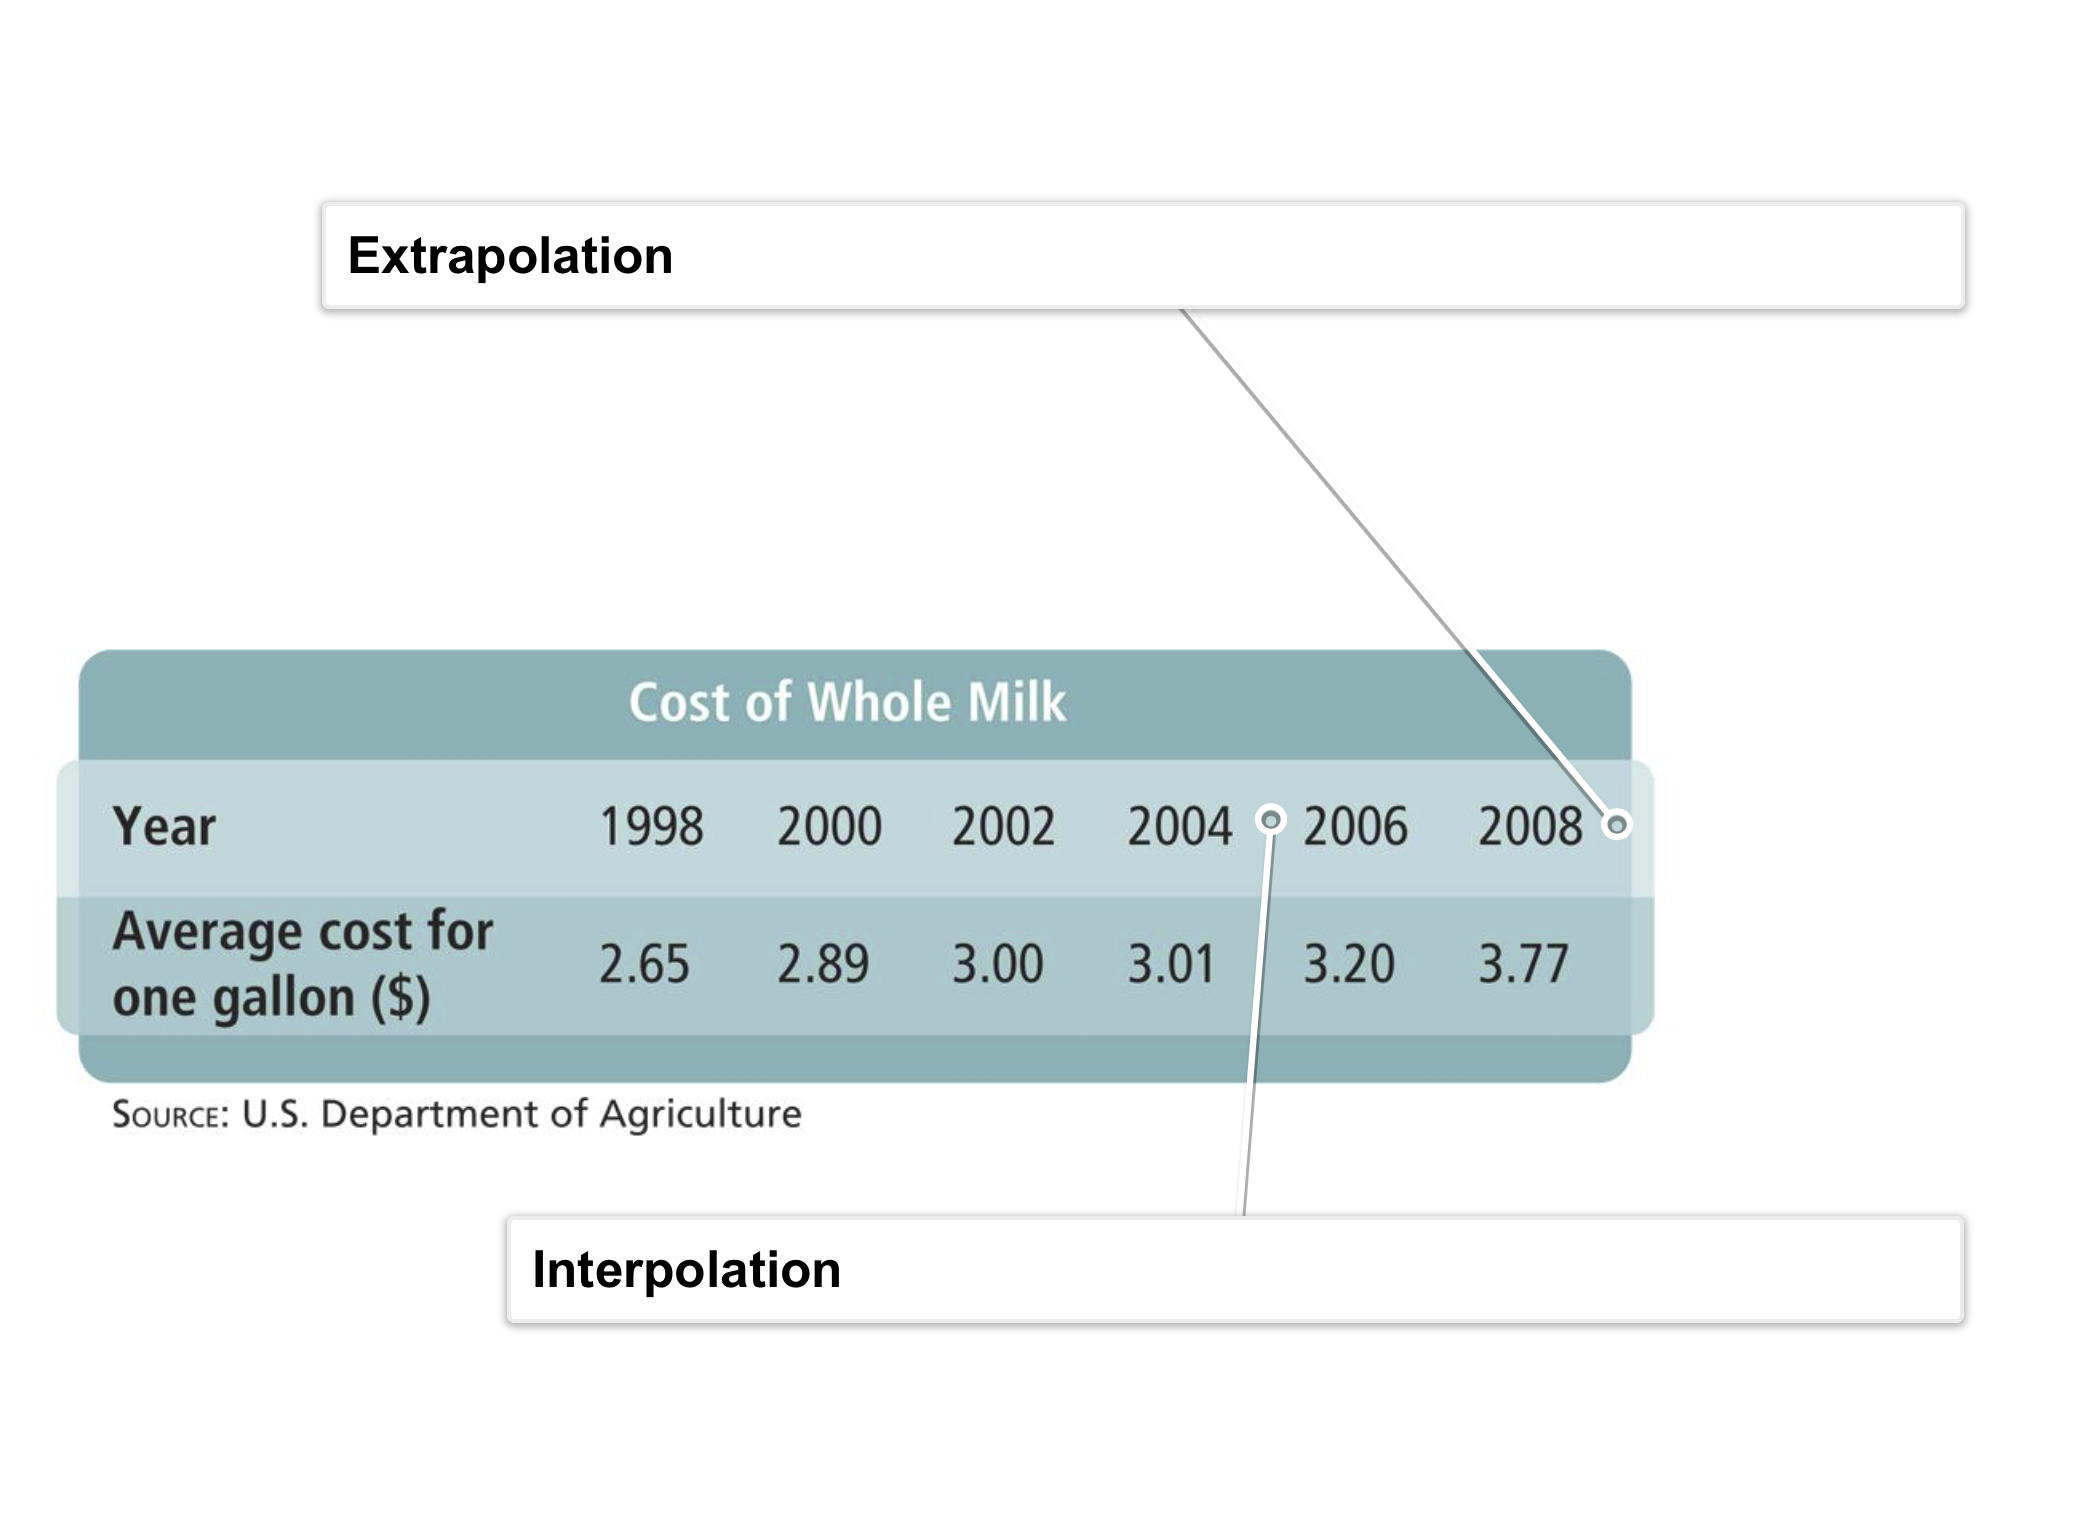
Problem 4 Got It? Use the model you created above to estimate cheese consumption for 1980, 2000, and 2012 algebraically and/or graphically. Remember that you let x represent years since 1900.

Also, identify the prediction years in which you can have the most and least confidence.

Hint: Consider interpolation vs extrapolation.

  • 26.31 lb

  • 23.07 lb

  • 21.53 lb

  • 17.7 lb

  • 1980

  • 2000

  • 2012

  • Estimated consumption in 1980

  • Estimated consumption in 2000

  • Estimated consumption in 2012

  • Two prediction years with greatest confidence

  • Prediction year with least confidence

10
Asemmisa {{asɛmmisaAhyɛnsode}}
9.
F.IF.5
10
Asemmisa {{asɛmmisaAhyɛnsode}}
10.
F.IF.5
10
Asemmisa {{asɛmmisaAhyɛnsode}}
11.
F.IF.5
10
Asemmisa {{asɛmmisaAhyɛnsode}}
12.
F.IF.5
Asemmisa {{asɛmmisaAhyɛnsode}}
13.

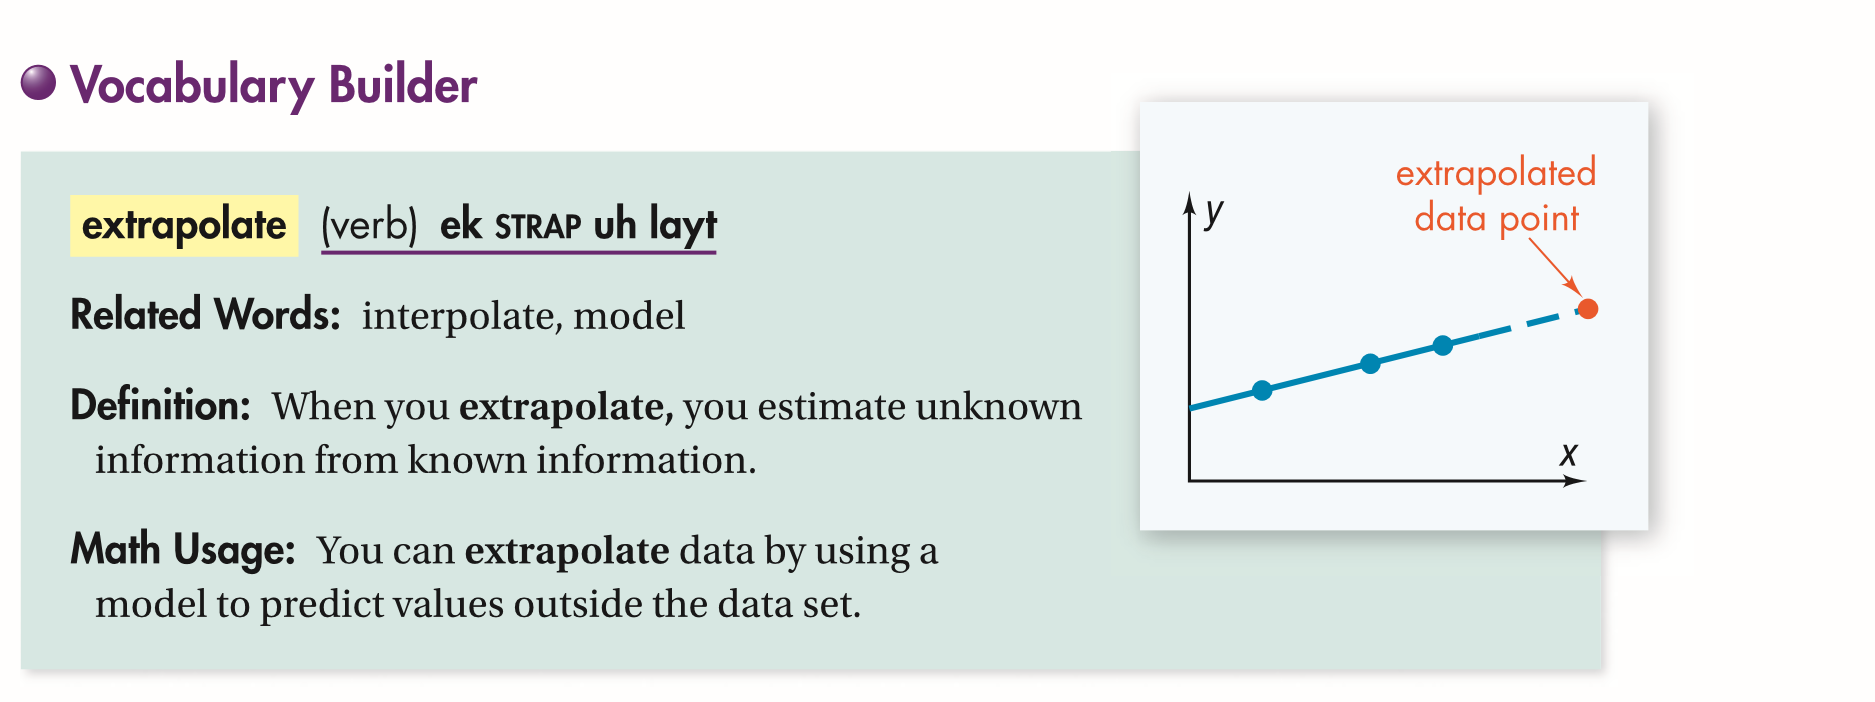
Vocabulary: Explain which form of estimation, interpolation or extrapolation, is more reliable.

Asemmisa {{asɛmmisaAhyɛnsode}}
14.

Reasoning: Is it possible to create a cubic function that passes through (0, 0), (-1, 1), (-2, 2), and (-3, 9)? Explain.

Asemmisa {{asɛmmisaAhyɛnsode}}
15.

Writing: The R² value for a quartic model is 0.94561. The R² value for a cubic model of the same data is 0.99817. Which model seems to show a better fit? Explain.

Asemmisa {{asɛmmisaAhyɛnsode}}
16.

Review Lesson 5-7: Expand the binomial.

Asemmisa {{asɛmmisaAhyɛnsode}}
17.

Review Lesson 5-7: Expand the binomial.

Asemmisa {{asɛmmisaAhyɛnsode}}
18.

Review Lesson 1-6: Write the compound inequality as an absolute value inequality.

Asemmisa {{asɛmmisaAhyɛnsode}}
19.

Review Lesson 1-6: Write the compound inequality as an absolute value inequality.

Asemmisa {{asɛmmisaAhyɛnsode}}
20.

Review Lesson 1-4: Solve the formula for the variable s.

Asemmisa {{asɛmmisaAhyɛnsode}}
21.

Review Lesson 1-4: Solve the formula for the variable r.

Asemmisa {{asɛmmisaAhyɛnsode}}
22.

Review Lesson 4-1: Graph the functions on the same coordinate plane. Zoom and pan your graph to establish an appropraite viewing window. Consider the similarities and differences between the graphs.

Yɛayi Graphing asɛmmisa type foforo a wɔatu mpɔn adi! Asuafo rentumi mmua saa asɛmmisa yi bio.
Asemmisa {{asɛmmisaAhyɛnsode}}
23.

Vocabulary Review: Drag each item from the left column to its corresponding model in the right column.

  • numerical data

  • airplane

  • house

  • floor plan

  • equation

  • model airplane

Asemmisa {{asɛmmisaAhyɛnsode}}
24.

Use Your Vocabulary: The points (1, 3) and (2, 6) are collinear. Extrapolate the y-value of the point on the same line when x = 4.

Fill in the blank: The point (4, __?__) is also on the line.

Asemmisa {{asɛmmisaAhyɛnsode}}
25.

Notes: Take a clear picture or screenshot of your Cornell notes for this lesson. Upload it to the canvas. Zoom and pan as needed.

For a refresher on the Cornell note-taking system, click here.

Asemmisa {{asɛmmisaAhyɛnsode}}
26.

Reflection: Math Success

Asemmisa {{asɛmmisaAhyɛnsode}}
1.

Solve It! Based on the pattern in the table, find the total area when x is 5.

Asemmisa {{asɛmmisaAhyɛnsode}}
2.

Solve It! What type of polynomial function does the data fit? Explain.