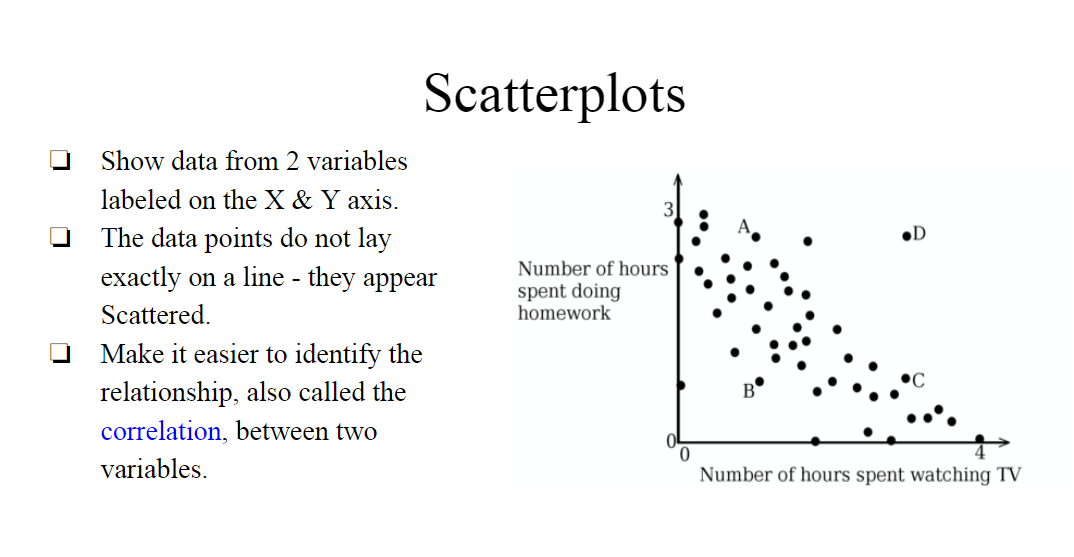
Scatterplots
star
star
star
star
star
Posljednje ažuriranje almost 7 years ago
22 questions
1
1
1
1
1
1
1
1
1
1
1
1
1
1
1
1
1
What is the X variable of the above scatterplot?
What is the Y variable of the above scatterplot?
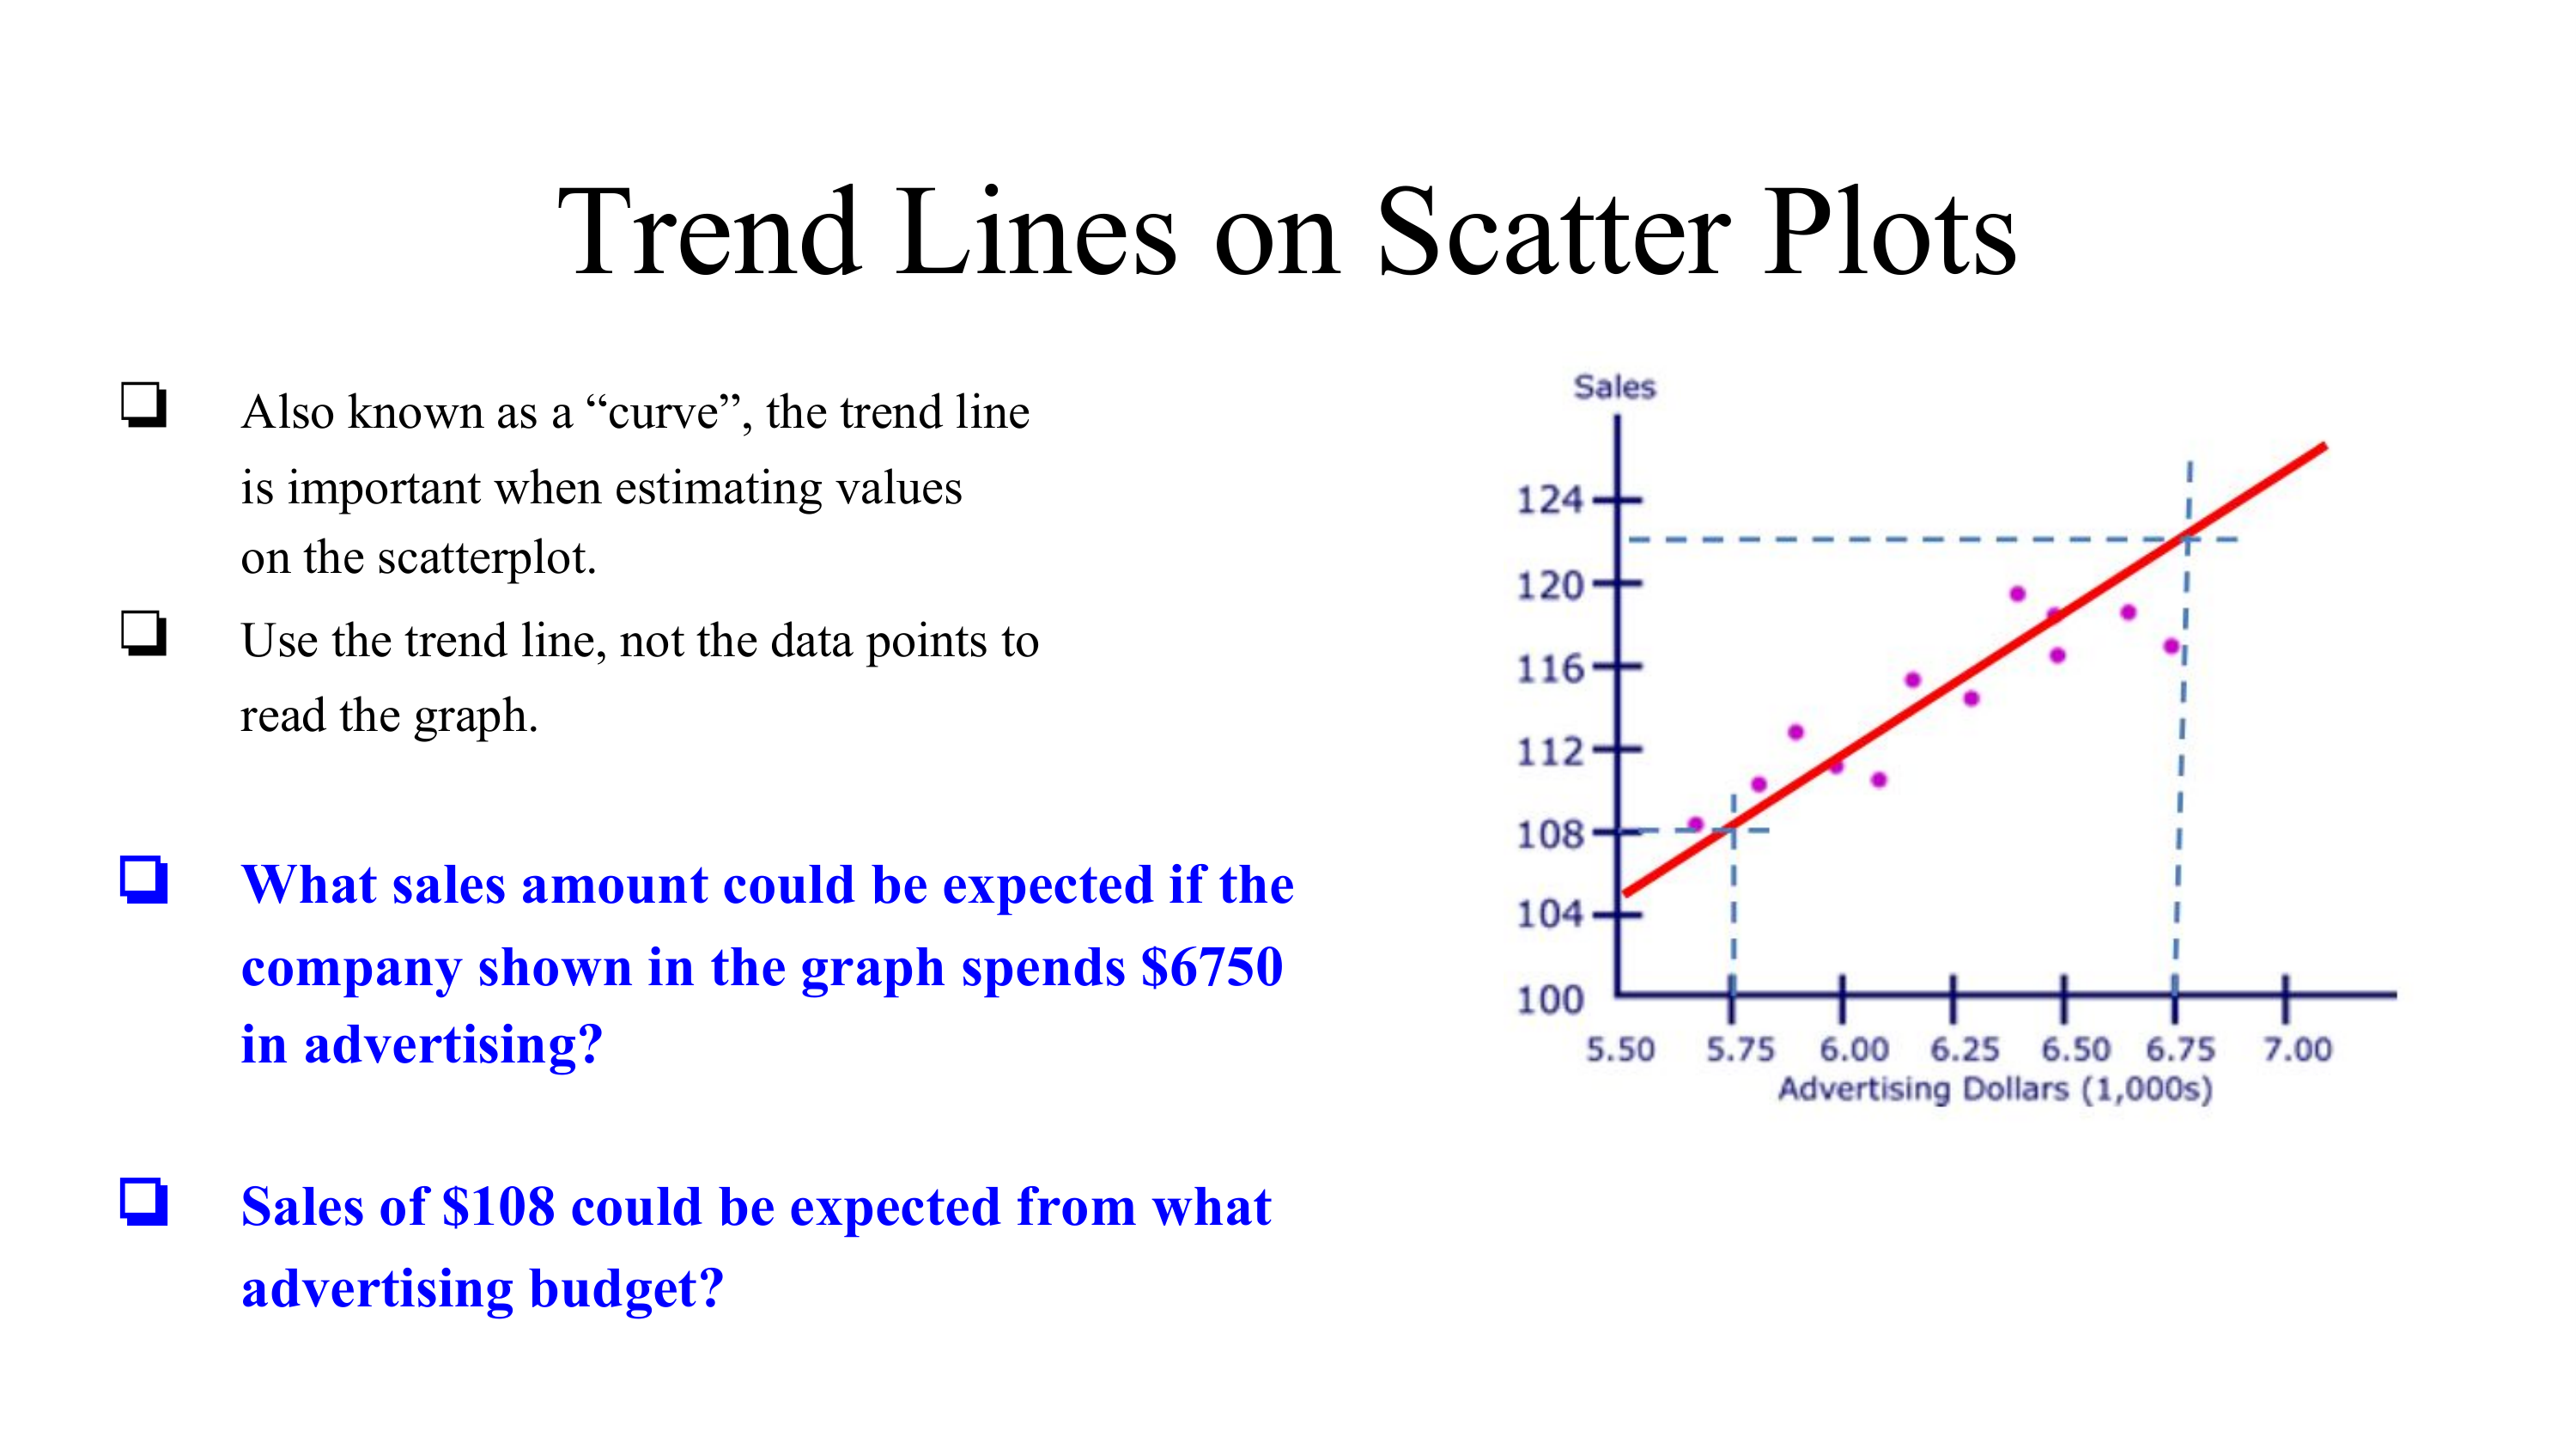
What sales amount could be expected if the company shown in the graph spends $6750 in advertising?
What type of correlation is this?
What are the variables being graphed?


Describe what happens to sales as more advertising dollars are spent?

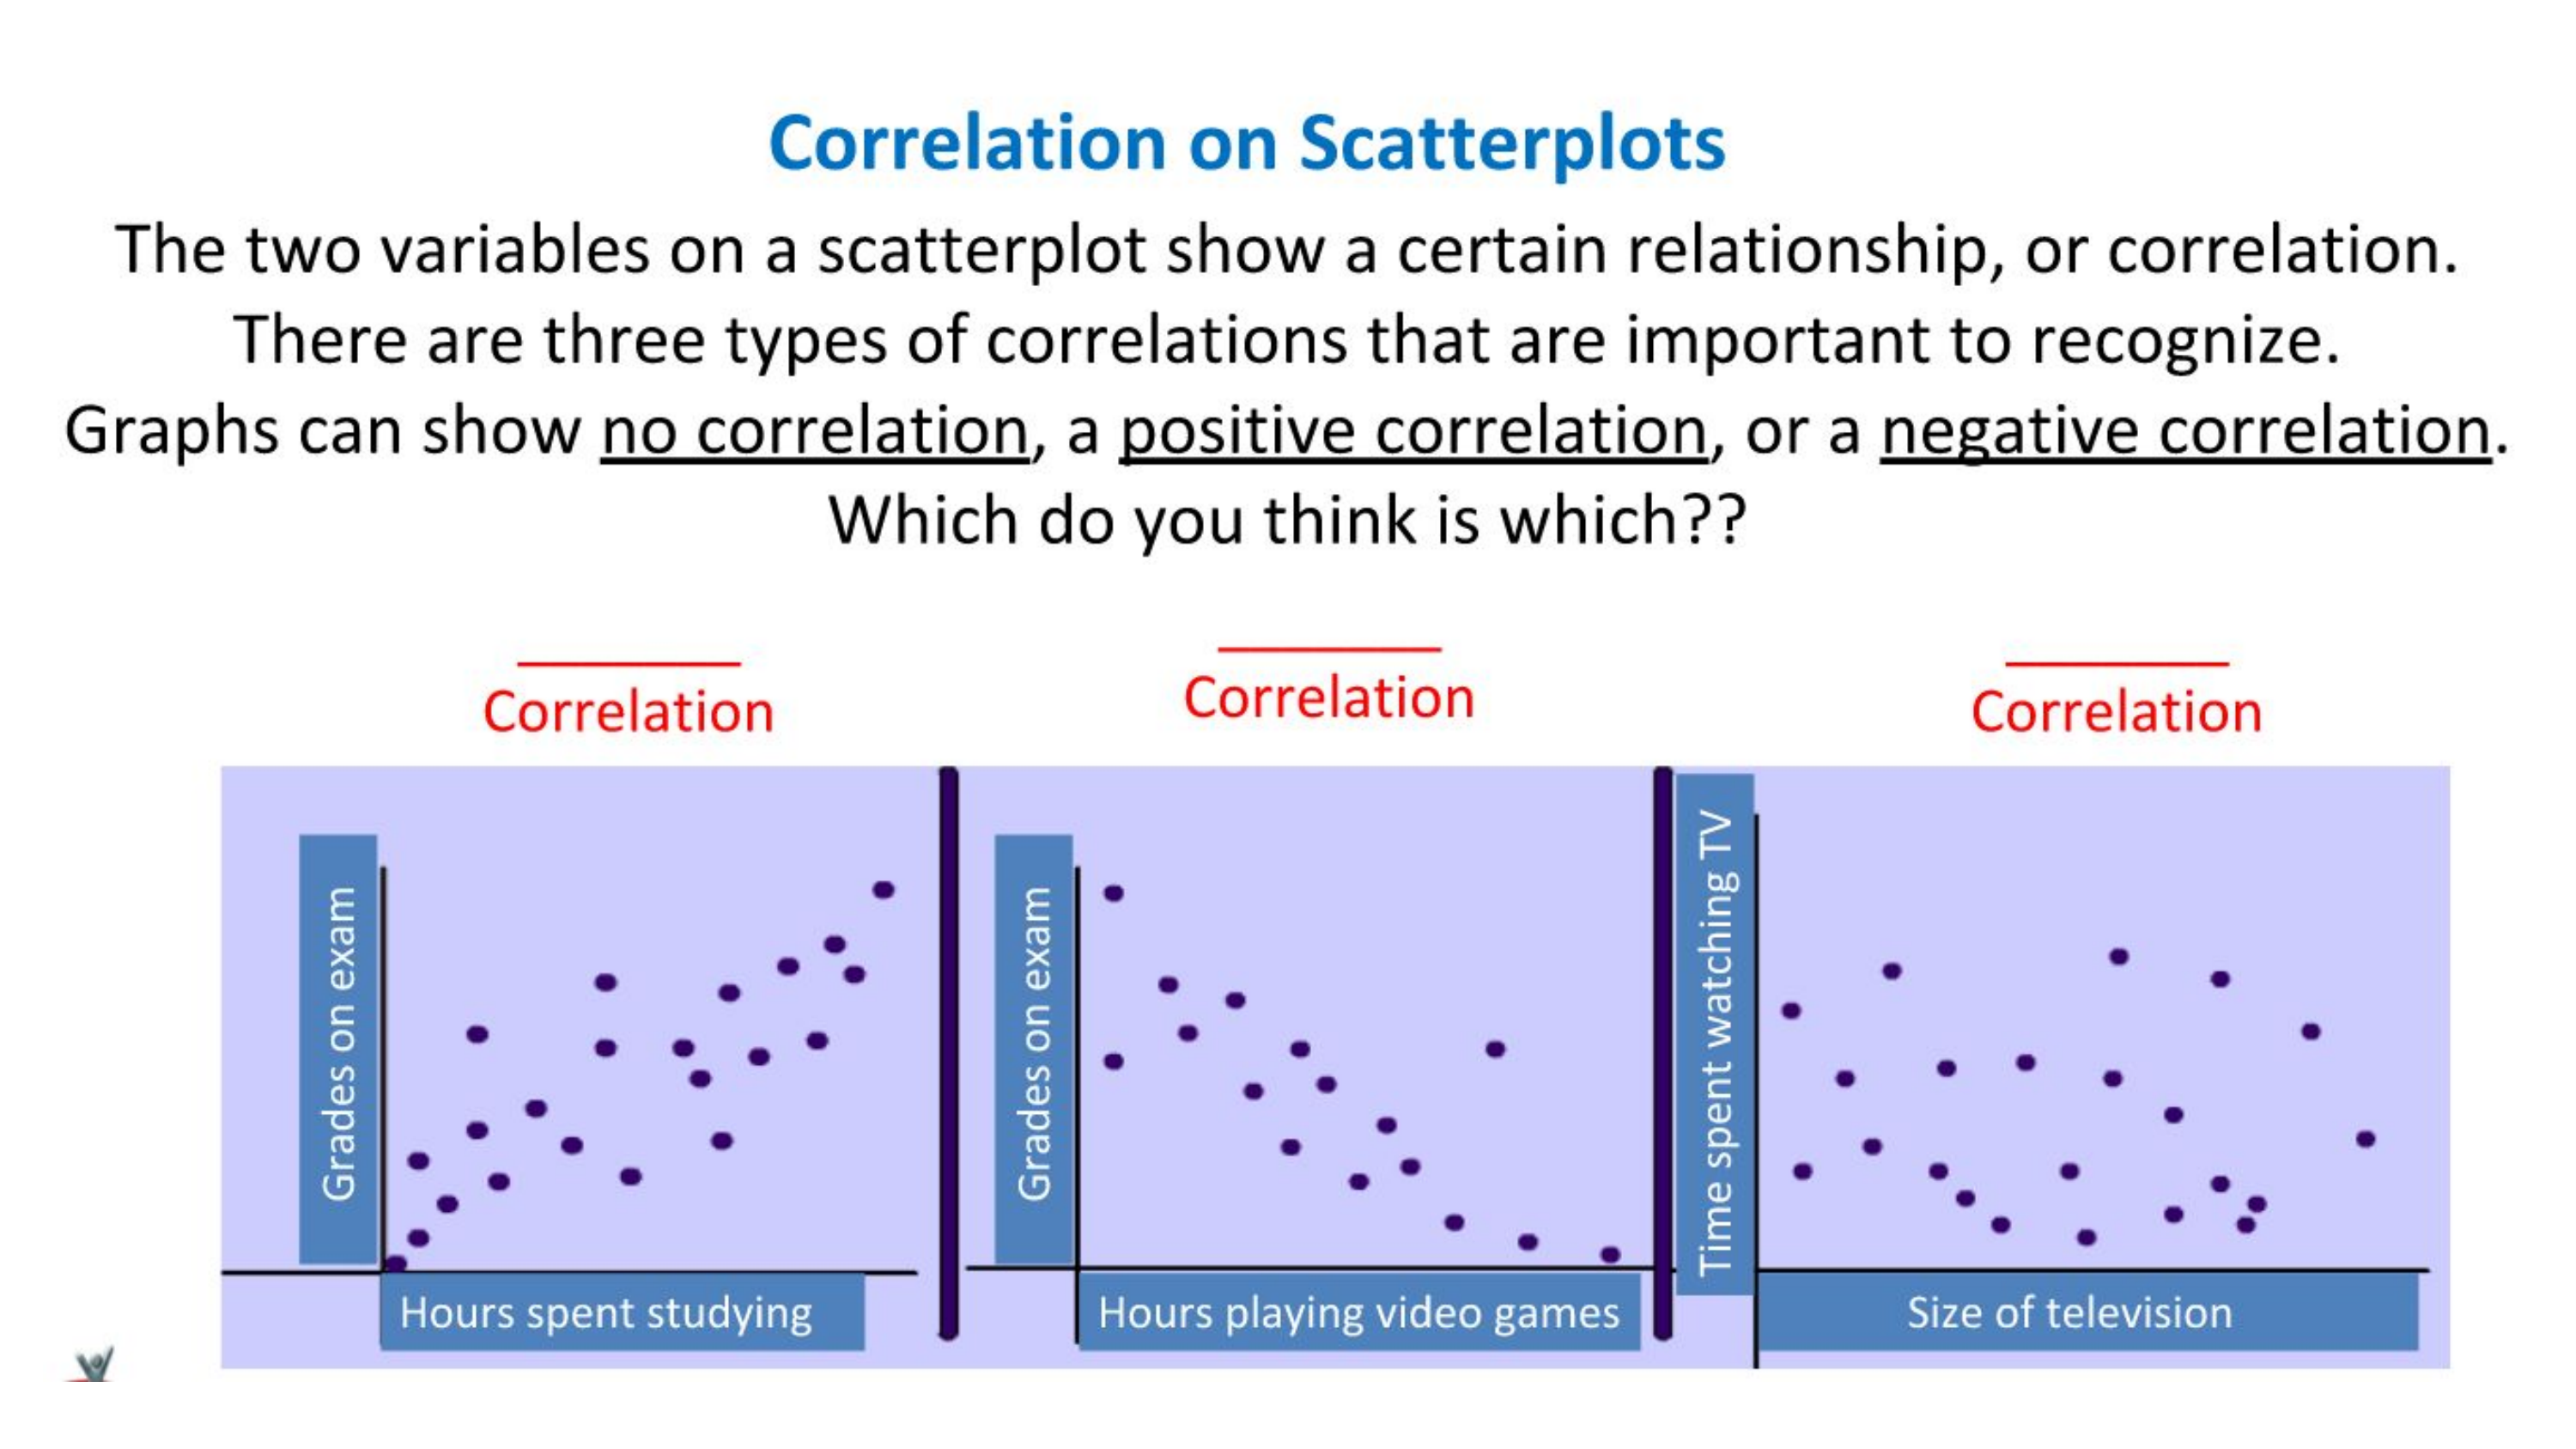
So as one variable gets larger, the other also gets larger.
This is an example of a relationship which shows
____________ CORRELATION.
What are the two variables being graphed?

As the weight of cars increases, what happens to the miles per gallon?

So as one variable gets larger, the other gets smaller.
This is an example of a relationship which shows ______________ CORRELATION.

What are the two variables being graphed?

As the temperature increases, what happens to the sales?

So as one variable gets larger, the other isn’t affected.
This is an example of a relationship which shows ______________ CORRELATION.

A car weighing 3,500 lbs. could be expected to get approximately _________ miles per gallon.

A car that gets 25 miles per gallon could be expected to weigh approximately ________ lbs.

A car weighing 3,000 lbs. could be expected to get approximately __________ miles per gallon.

Mark all that are true about the relationship shown between stopping distance and speed of cars from the 1920’s.

Complete the statement about the relationships shown by the graphs.

Graph A shows ________ correlation
Complete the statement about the relationships shown by the graphs.
Graph B shows ________ correlation
Sales of 108 could be expected from what advertising budget?
What type of correlation is this?
What type of correlation is this?