Supply and Demand Formative Assessment
star
star
star
star
star
Posljednje ažuriranje over 7 years ago
10
Napomena autora:
Economics Supply and Demand
1
SSEMI2.b
1
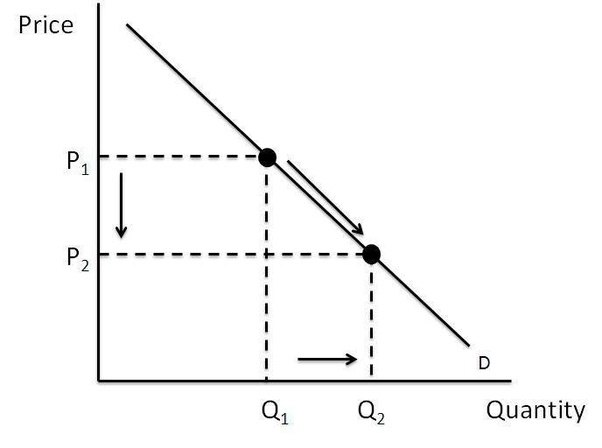
SSEMI2.a
1
SSEMI2.b
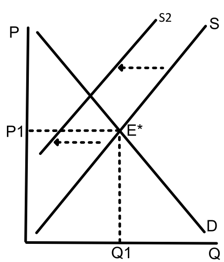
SSEMI2.f
1
SSEMI2.f
1
SSEMI2.f
1
SSEMI2.a
1
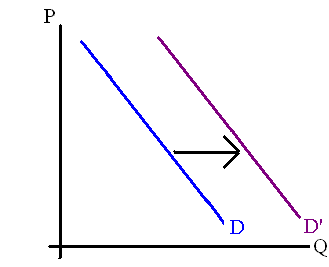
SSEMI2.e
1
SSEMI2.b
SSEMI2.e

1
SSEMI2.b
1
SSEMI2.b
SSEMI2.e