Log in
Sign up for FREE
arrow_back
Library

Unit 2 PreAssessment

star
star
star
star
star
Last updated almost 7 years ago
4 questions
1
SSEMI2.a
1
SSEMI2.a
1
1
Question 1
1.

Question 2
2.

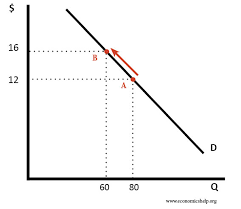
Examine the image above. Briefly describe the relationship that you see between price ($) and quantity (Q).

Question 3
3.

Curves S1 and S2 show how many chocolate bars a producer is willing to produce at an array of prices. Focus on curve S1. Describe the relationship between price and quantity as illustrated by S1.

Question 4
4.

Examine the image above. Assume that at a price of $16, people will buy 60 units of a good. At a price of $12, people will purchase 80 units of a good. Which of the following would be a logical amount for people to purchase at a price of $8?
40 units
60 units
80 units
100 units
Curves S1 and S2 show how many chocolate bars a producer is willing to produce at an array of possible prices. Which of the following statements is true?
Producers are willing to produce more chocolate bars at all prices on curve S1 than on curve S2.
Producers are willing to produce more chocolate bars at all prices on curve S2 than on curve S1.
Producers are willing to produce the same amount of chocolate bars on both curves S1 and S2.