Term 2 : Revision - Probability (Criterion A)
star
star
star
star
star
Posljednje ažuriranje over 7 years ago
24 questions
1
1
1
1
1
1
1
1
1
1
1
1
1
1
1
1
1
1
1
1
1
1
1
1
Use following link to show your work - "Math type editor"
Q1.
On a work day, the probability that Mr Van Winkel wakes up early is 4/5. If he wakes up early, the probability that he is on time for work is p. If he wakes up late, the probability that he is on time for work is 1/4
(a) Draw the tree diagram for the above given data.
The probability that Mr Van Winkel arrives on time for work is 3/5. (b) Find the value of p.
Q2.
Peter either walks or cycles to work. The probability that he walks is 0.25.
If Peter walks to work, the probability that he is late is 0.1. If he cycles to work, the probability that he is late is 0.05.
(a) Draw the tree diagram for the above given data.
On a day chosen at random, Peter walked to work.
Write down the probability that he was on time.
For a different day, also chosen at random,
(b) Find the probability that Peter cycled to work and was late.
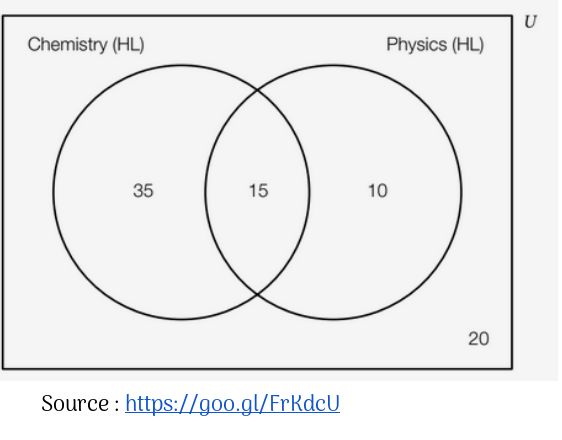
(a) Calculate the number of students took part in the survey?
(b) If one of the students is chosen at random, Calculate the probability that the student:
(i) studies Chemistry (HL)
(ii) studies both Chemistry (HL) and Physics (HL)
(iii) does not study Physics (HL)
(a) studies French
(b) studies neither language
(c) studies at least one language
(d) studies both languages
Q5.
The numbers 2, 3, 4, 5, 6, 7, 8, 9 are each written on identical pieces of card and placed in a bag.
A card is selected at random from the bag.
Let A be the event ‘an odd number is chosen’ and let B be the event ‘a square number is chosen’.
(a) Draw a Venn diagram to represent the experiment.
(b) Determine whether A and B are independent events.
(a) Draw the net - structure / Grid for both the dice rolled together.
(a) The total score is 7.
(b) The same number comes up on both dice.
(c) The difference between the scores is 1.
(d) The score on the red dice is less than the score on the blue dice.
(e) The total score is a prime number.
Two fair dice are rolled, one red and one blue.
(a) Draw the tree diagram.
Using a tree diagram, find the probability that:
(a) a double six is rolled
(b) no sixes are rolled
(c) exactly one six is rolled
(d) at least one six is rolled.