Line Plots Test
star
star
star
star
star
Last updated over 7 years ago
5 Nsɛmmisa
1
4.DS.A.3
1
4.DS.A.3
1
4.DS.A.3

1
4.DS.A.3
1
4.DS.A.1
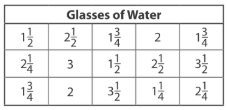
How many dots would be placed above 2 1/2 in a line plot of the data in the table titled "Glasses of Water"?
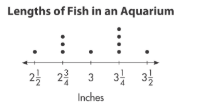
Use the line plot above titled "Lengths of Fish in an Aquarium." Select all the true statements.
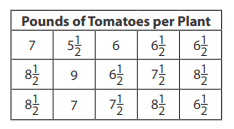
Use the data in the table "Pounds of Tomatoes per Plant." True or false?
More than half the plants produced at least 7 pounds of tomatoes.
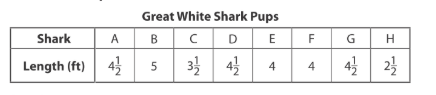
Use the tabled titled "Great White Shark Pups."
Sally said the longest pup was 3 feet longer than the shortest pup because 5-2=3. Critique Sally's reasoning. Is she correct? Explain.
Create a line plot with the data provided above in the table "Great White Shark Pups." Label the line plot correctly.