Alg1 M1 U1 -

Last updated over 6 years ago
36 questions
Note from the author:
Descriptive Statistics
Module 1, Unit 1, Part 1: Descriptive Statistics - Centers of Distributions & Describing Variability
The graph below displays the number of ice cream manufacturers in selected states in 2012 and 2007. Use the graph to answer questions 1 – 8.
2

Describe the data for 2012 as one of the following.

2

California had the most ice cream manufacturers in 2007. How many did California have?

2

How many states are represented in the 2007 data?

2

What is the median for the 2007 data?

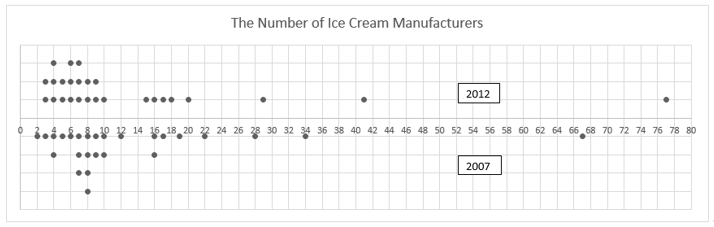
For problems 5 – 8, determine if each of the following statements is A=TRUE, B=FALSE, or C=CANNOT BE DETERMINED based on the graphs of ice cream manufacturers. 2 pts
2

There are four states that had 8 manufacturers in 2007. These same four states had more than 8 manufacturers in 2012.

2

The data point at 77 in 2012 is an outlier.

2

The mean is higher than the median for both sets of data.

2

The standard deviation for 2007 is significantly different than the standard deviation for 2012.

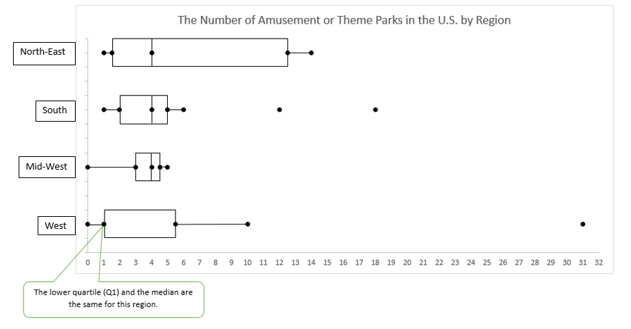
The number of schools by state in the Western U.S. is shown in the box plot.
Use the graph to answer #9 – 14.
2

The Q1 (the lower quartile) is around which of the following?

2

The IQR (interquartile range) is around which of the following?

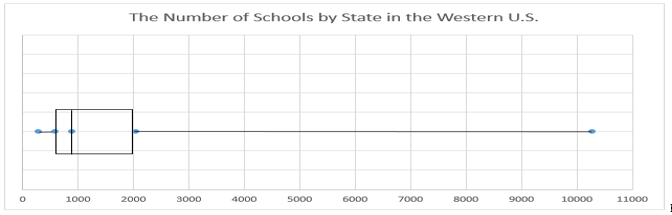
For problems 11– 14, determine if each of the following statements is A= TRUE, B=FALSE, or C=CANNOT BE DETERMINED based on the graph of the number of schools in these 13 western U.S. states.
2

There is an outlier at the upper extreme (maximum).

2

About 75% of the western states have less than 2000 schools.

2

The long segment on the right means that most of the western states have between 2000 and 10,500 schools.

2

Of the 13 states represented in this graph, exactly one has the median as its data point.

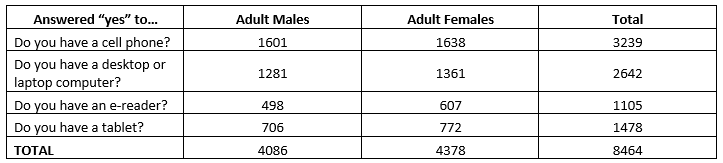
The Pew Research Center conducted an electronic devices survey in 2014.
Use this data for Questions 15 and 16.
2

What is the conditional relative frequency of someone having a cell phone, given that they are male?

2

If you asked 100 random adult males if they had a tablet, about how many would you expect to answer “yes”?

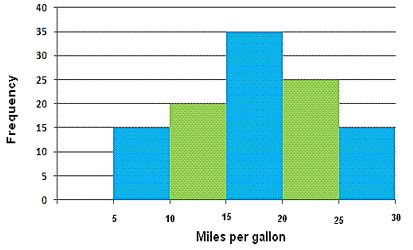
Use the histogram to answer #17-20. The graph shows gas efficiency (in miles per gallon) of cars at a dealership.
2

Fifteen cars have fuel efficiencies greater than or equal to 25 but less than 30 miles per gallon.

2

There are 110 cars at the dealership in total.

2

This distribution is best described as bimodal.

2

The minimum efficiency (in miles per gallon) is 5 miles per gallon.

4

The box plot above shows the number of amusement parks and theme parks in the U.S. by region. Use the plot to determine which of the statements are true. Choose all that apply.

Module 1, Unit 1, Part 2: Descriptive Statistics - Centers of Distributions & Describing Variability
The data in the table below gives the number of thrift stores (second-hand stores) in five north western states. The standard deviation for this data is 229.54. Use this information to answer Questions 22 – 24.
3

How would the standard deviation change (increase, decrease, or stay the same) if each state had two more thrift stores? You do not need to recalculate the standard deviation.

3

If California with 1,883 thrift stores was added to this data set, how would that effect the standard deviation (increase, decrease, or stay the same)? You do not need to recalculate the standard deviation. Be sure to support your claim.

3

Kent found out that Alaska has 57 thrift stores. He says if you included Alaska and California’s thrift stores, the median is not affected. Do you agree or not? Explain your thinking.

The following data shows the percentages 17 students received on a recent math test in Algebra 1. Use this data for questions 25 – 32.

34, 42, 65, 68, 72, 73, 76, 78, 81, 83, 83, 88, 92, 92, 97, 99, 100

What is the 5-Number Summary for this data?
1

Minimum

1

Q1

1

Median

1

Q3

1

Maximum

1

What is the IQR?

2

Is there an Outlier? Justify your response

4

Create a box plot using the data from 25-31. Identify Q1, Median, Q3, Minimum, Maximum and any Outliers if they exist.

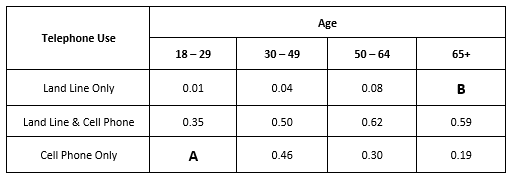
The data below, from the Pew Research Center, shows how telephones are used in homes. Use the data to complete the Table for Questions 33-34 (A and B).
2

What is the value of cell A?

2

What is the value of cell B?

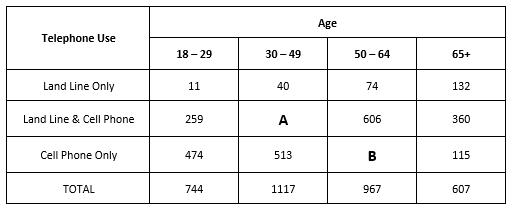
The table below gives the Column Conditional Relative Frequencies rounded to two decimal places for the telephone use data. Calculate the values for Cells A and B to answer question 35-36. Round to two decimal places.
2

What is the value of cell A?

2

What is the value of cell B?