Alg 1 M1 U2

Last updated over 6 years ago
36 questions
Note from the author:
Algebra Assessment
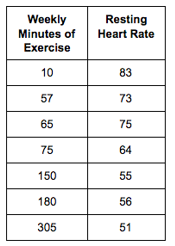
Use desmos.com to plot the data below. Then find the least squares line and the correlation coefficient.
For your answers, round numbers to the nearest thousandth. Answer questions 1-5 using the results from Desmos:
1

Least Squares Line (line of best fit, in slope-intercept form), do not include spaces, round to 3 decimals for each term:

1

Value of Correlation Coefficient (r=__________, round to 3 decimals):

2

Circle the words below that describe the correlation between resting
heart rate and weekly minutes of exercise. (Select all that apply)

1

What is the slope of your least squares line? (Round to the nearest thousandth)

1

Interpret the results of the data given the context of the problem

2

Which of the following is the correct interpretation for the y-intercept of your least squares line?

2

Does the y-intercept of your least squares line make sense in the context of the problem? Explain.

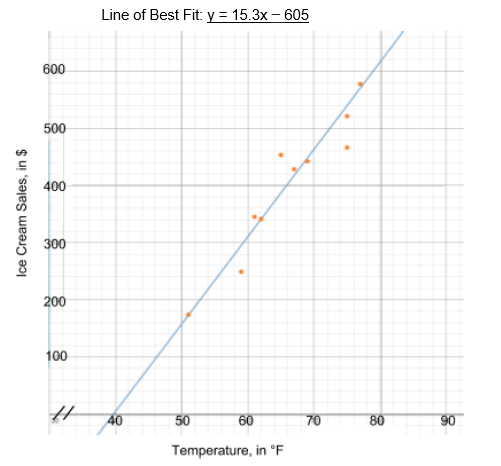
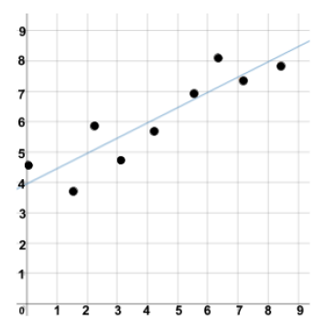
The graph shows a store’s daily ice cream sales (in dollars) and maximum temperatures for that day (in degrees Fahrenheit). The line of best fit is given
2

Use the equation of the line of best fit (not the graph alone) to predict daily ice cream sales (in dollars) on a day when the maximum temperature is 77 degrees Fahrenheit. Round your answer to the nearest thousandth.
You must show your work to receive credit!

1

Assume the actual daily ice cream sales were $548.50 on the day when the maximum temperature was 77 degrees Fahrenheit. Compare this to your previous answer from Question 5 and calculate the residual.
Round your answer to the nearest thousandth. You must show your work to receive credit!

2

Use either the graph or the equation of the line of best fit to predict maximum temperature on a day when ice cream sales were $460. (For full credit: If you use the graph, mark it to show how you found your answer; if you use the equation, show your work below the graph using a text box.)

2

Using the information from question #10 answer the following: Does the y-intercept of your least squares line make sense in the context of the problem? Explain.

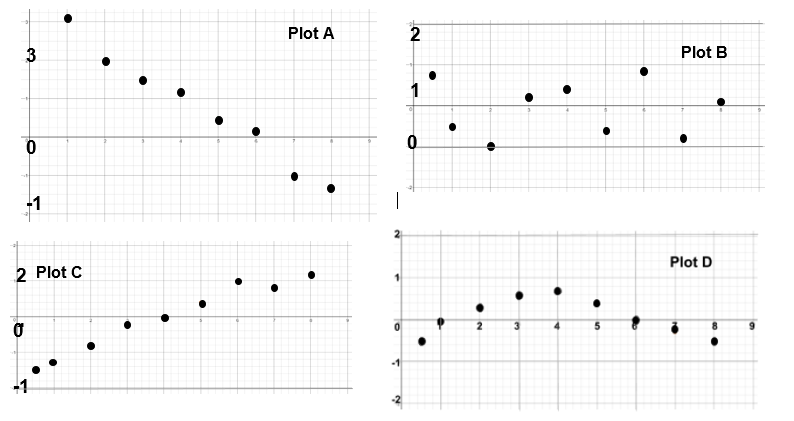
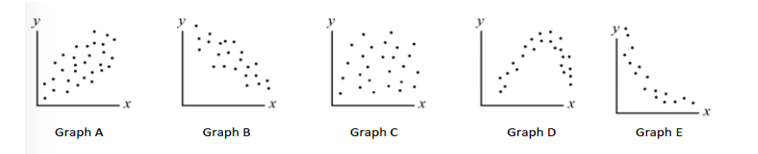
Order these graphs from strongest correlation to weakest correlation represented.
1

Very Strong Correlation

1

Strong Correlation

1

Weak Correlation

1

Weakest Correlation

Use the Graphs below to answer the questions:
2

Assume you entered data about x and y into Desmos and found a least squares regression line (a line of best fit). You then check the residuals resulting from that line. Which of the residual plot below would best indicate that the line is a good fit for the data?

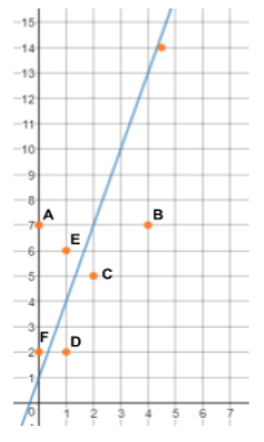
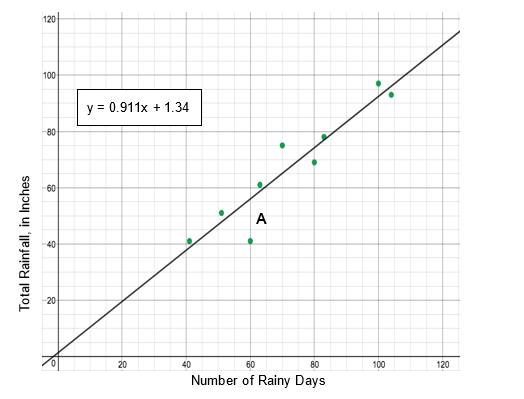
Natalie and Cam are playing “guess that point" with the data and line of best fit shown below.
2

Natalie says: I’m thinking of a point that has a residual of 2. Which point is Natalie thinking of?

Use the graph below to answer the following question:
1

Which of the following equations most closely matches the line of best fit on the scatter plot shown above?

1

Before you start working, you have $20. When you start working, you make $15 for every 1 hour you work.
Which of the following equations represents this scenario?

1

If the correlation coefficient is − 0.897, which of the following statements must be true? Select all that apply

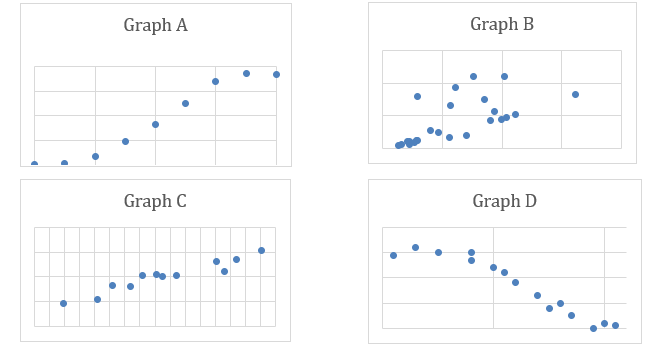
For questions 21 - 25, match each graph to the statements below. Use each graph one time only.
1

This graph shows a negative linear correlation.

1

This graph shows a nonlinear exponential relationship.

1

This graph shows a positive linear correlation.

1

This graph shows a nonlinear quadratic relationship.

1

This graph shows no correlation.

For Questions 26 – 29, match each graph to the statement that makes the most sense. Use each graph one time only. All axes labels have been deleted from the graphs.
1

Ice cream sales increase steadily as the temperature increases.

1

As the temperature increases the sales of hot chocolate decrease.

1

The number of DVD players sold took a while to increase, then increased each year and finally has reached a level period with little change in the number sold.

1

There doesn’t seem to be any pattern in the cost of toys produced versus toy sales in those countries.

Use the graph to answer problems 30-33.
1

Which of the following interpretations is correct?

1

If you added the point (85, 103) to the data set shown in this scatterplot, how would this influence the line of best fit?

1

If there were 120 rain days, based on the line of best fit, what would you expect total rainfall to be?

1

What is the value of the residual for Point A?

1

Which of the following are true? (Select all that apply)

Bonus Questions (1 point each)
On vacation, you plan to rent an electric scooter for a flat fee of $20 plus an hourly fee of $8.
0

Write an equation to represent the situation.

0

How much would you pay to use the scooter for 4 hours?