Alg1 U1-4 Fall Final
star
star
star
star
star
Posljednje ažuriranje about 7 years ago
56
1
1
1
1
1
1
1
1
1
1
1
1
1
1
1
1
1
1
1
1
1
1
1
1
1
1
1
1
1
1
1
1
1
1
1
1
1
1
1
1
1
1
1
1
1
1
1
1
1
1
1
1
1
1
1
1
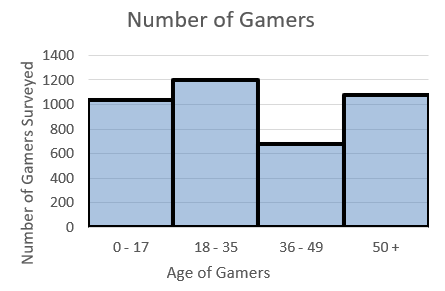
A gaming association surveyed computer and video game players. The histogram above shows the ages of 4000 gamers. About how many gamers in the survey are less than 50 years old?
What is the approximate range of this data?
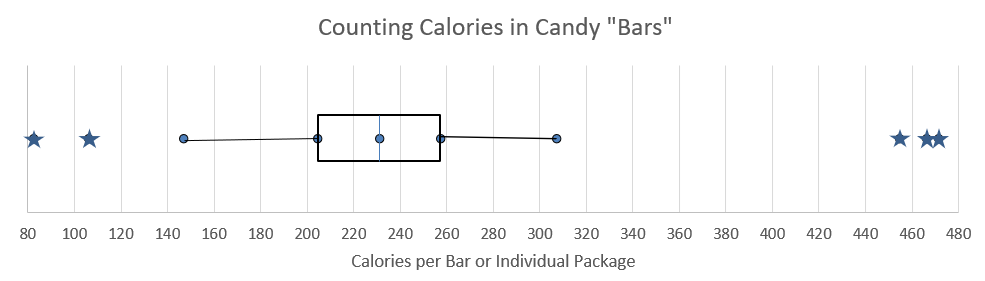
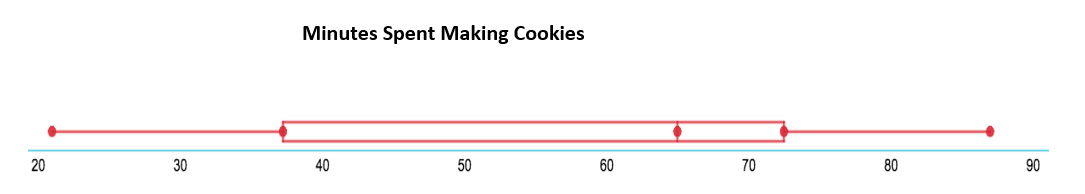
There are 41 candy “bars” represented in this box plot. About how many have 204 calories or less?
A package of Skittles has 231 calories and is represented by one of the five points that make up the box plot, excluding the outliers. Which of those five points represents Skittles?
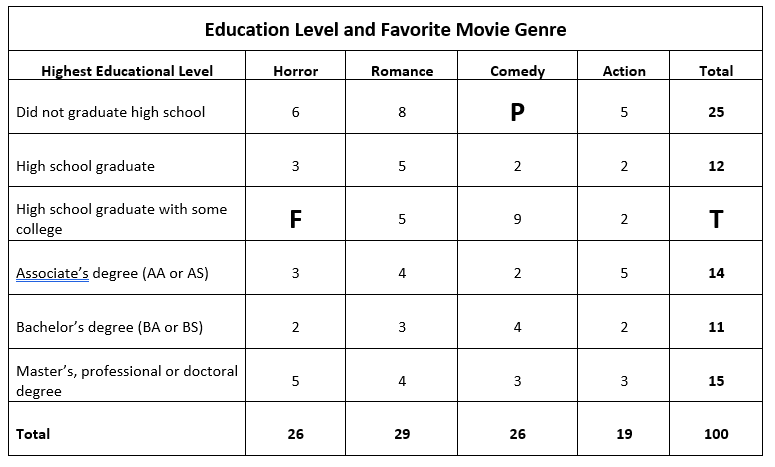
What are the amouts that belong in spaces F, P and T?
What is the probability of having Bachelor’s degree, given that they prefer Romance?
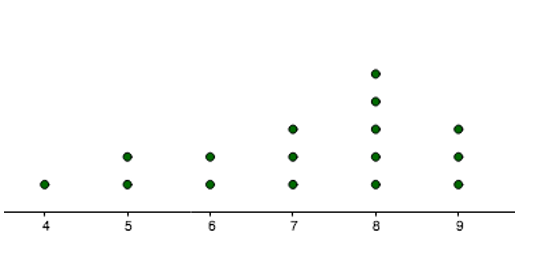
One of the advantages of graphically displaying data with a dot plot is:
What can you say about the data shown in the dot plot shown to the left.
Which of the following is true?
The statistics below provide a summary of the distribution of heights, in inches, for a simple random sample of 200 young children.
Mean: 46 inches
Median: 45 inches
Standard Deviation: 3 inches
First Quartile: 43 inches
Third Quartile: 48 inches
About 100 children in the sample have heights that are
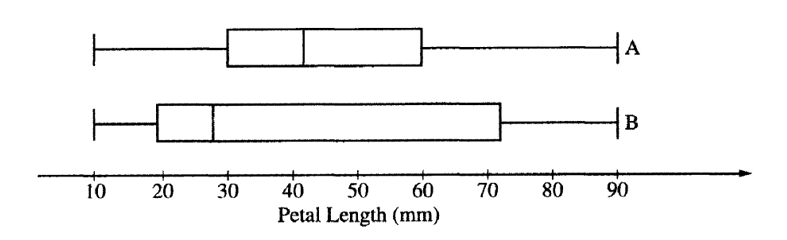
A botanist is studying the petal lengths, measured in millimeters, of two species of lilies. The box plots above illustrate the distribution of petal lengths from two samples of equal size, one from species A and the other from species B. Based on these box plots, which of the following is a correct conclusion about the data collected in this study?
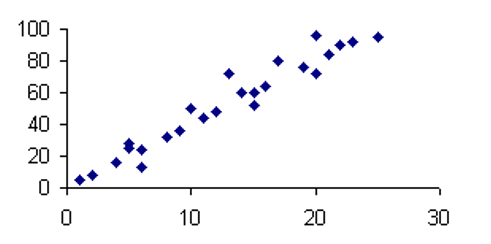
The correlation coefficient is best described as
Which is true about the data shown in the scatter plot above?
A local environmental company collected data relating the number of rainy days (x) and the total rainfall (y) in inches. The company found the equation of the least squares regression line to be y=0.911x+1.34. What is the correct interpretation of the slope?
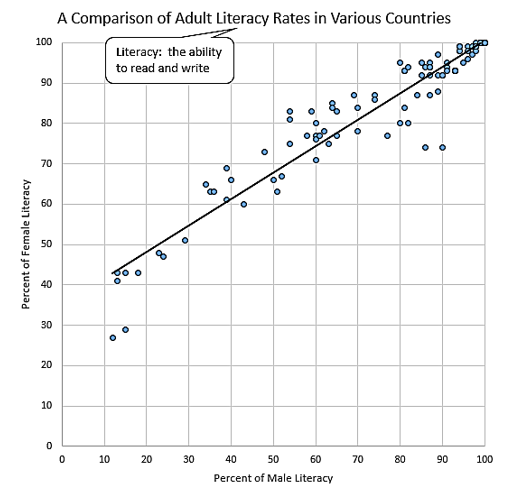
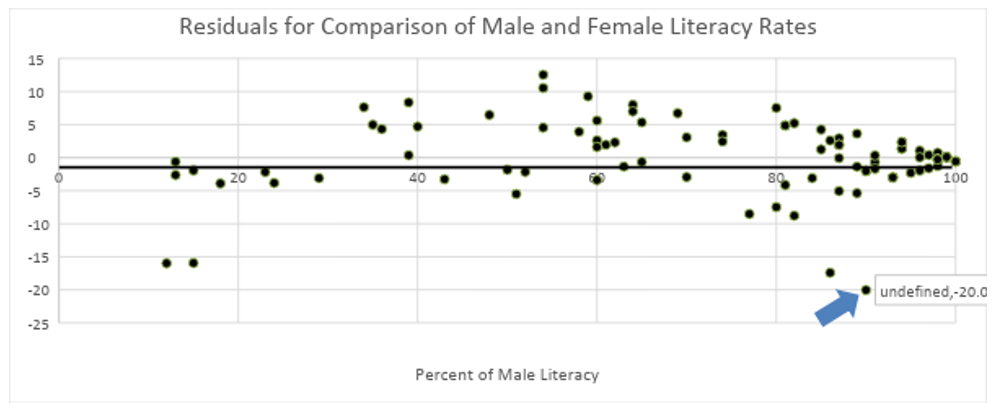
True/False: Generally in countries where male literacy is high, female literacy is low.
If a country has a male literacy of 30%, what is the predicted female literacy?
If a country has a female literacy of 80%, what is the predicted male literacy?
The standard deviation for male literacy rates is 25.4336 and 17.4664 for females. This means which of the following?
If all 99 countries represented in this data increased their male literacy rate by 2%, the standard deviation would
What does the selected data point represent?
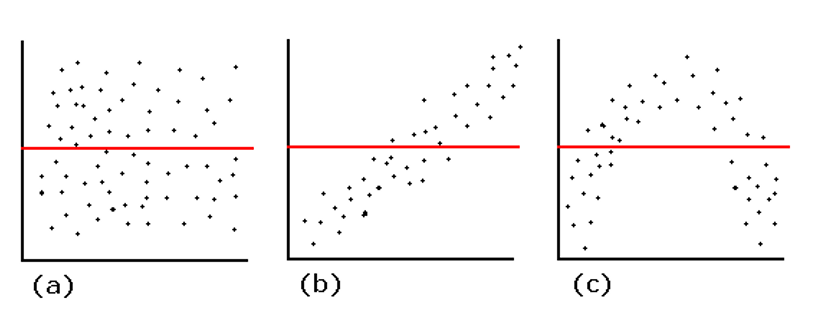
Given the residual plots below, which one demonstrates that its original linear model is a good fit?
Simplify the expression
Solve the equation
Solve for x in the equation
Solve for x in the equation
Solve the equation for
Which of the following is an example of the distributive property?
Which of the equations below fits the restrictions
Solve for x in the inequality.
Solve for x in the inequality.
You must be at least 64 and no more than 77 inches tall when standing and at least 34 and no more than 40 inches tall when sitting to be a pilot. Which inequality describes these height requirements where h represents the height?
Given
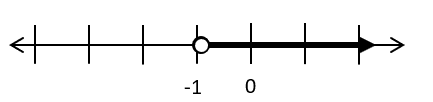
Which interval matches the graph above?
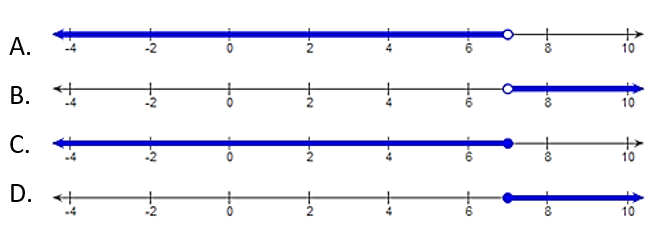
Select the appropriate graph for the inequality.
Solve the following compound inequality.
Solve for x in the equation
Solve the absolute value inequality:
Solve the absolute value inequality.
Select the appropriate interval notation for the solution to this absolute value inequality.
Identify the correct first step to take when solving the system of equations below using the elimination method.
Look at this system of equations:
Which equation could represent a step in finding the value of x for the system by elimination?
Solve the system of equations:
What is the solution to the following system of equations?
Write the equation
Which description below would fit the graph of
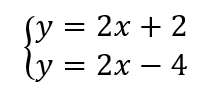
Which statement is true about the system of equations above?
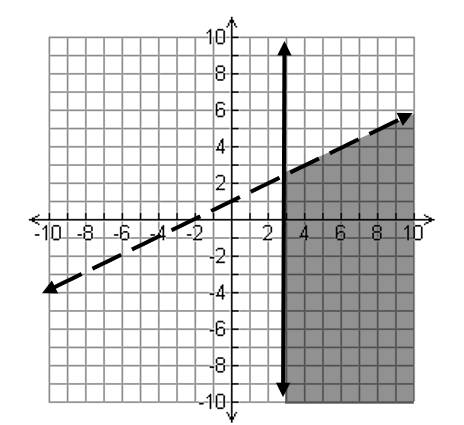
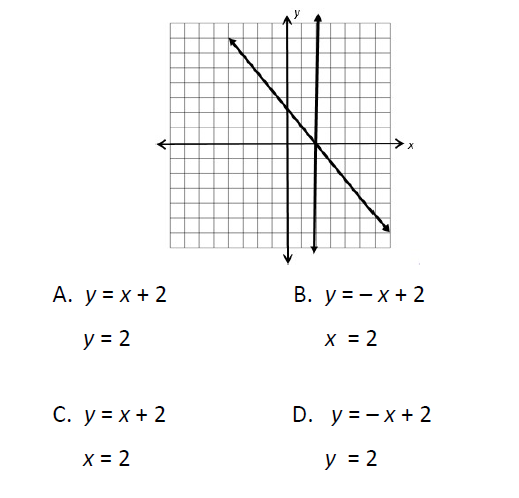
Select the system of inequality that represents the graph.
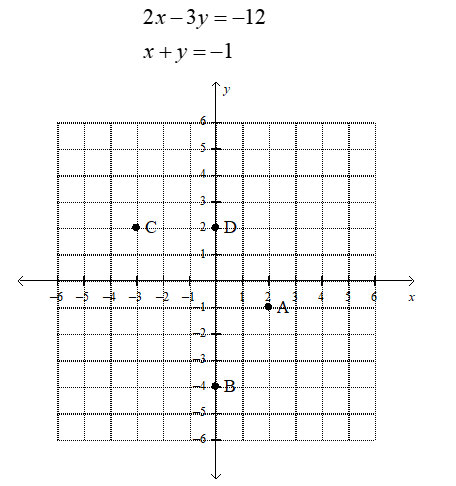
Which point on the grid below is the solution to the following system of equations?
Solution to the system of equations above.
Solution to the system of equations above.
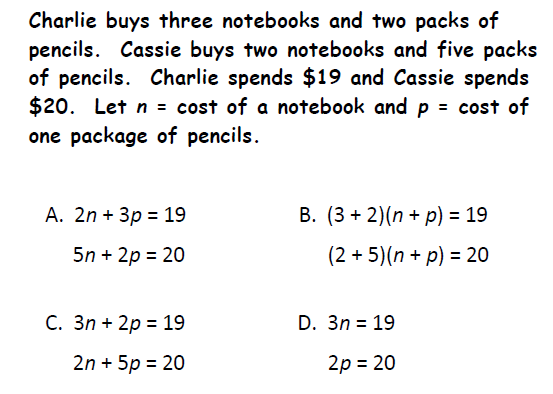
Which system correctly models the situation below?
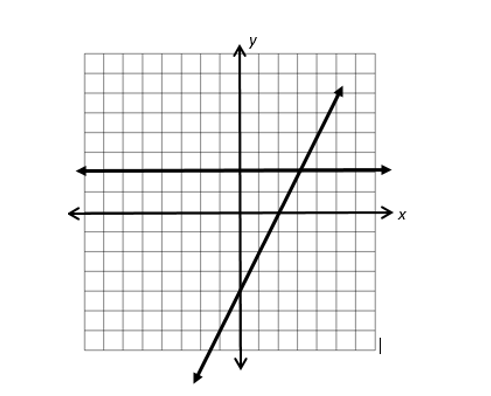
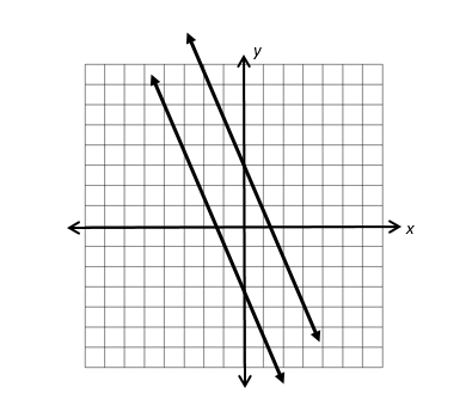
Which system correctly describes the graph below?
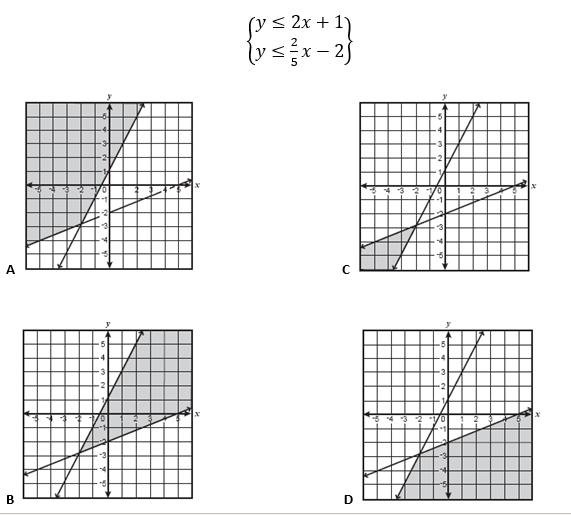
Which graph best describes the solution to this system of inequalities?
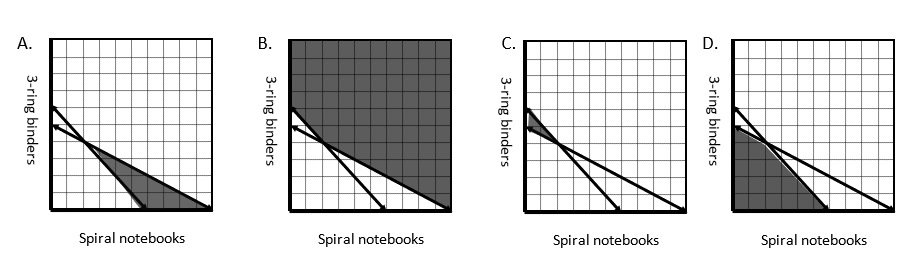
For Questions 55 and 56 use the following situation.
You are shopping for school supplies. You have 6 classes this semester and want to have at least one separate 3-ring binder or spiral notebook for each class. Binders cost $4 each and spiral notebooks cost $2 each. However, your mom only gave you $20. You are trying to figure out how many of each type you are able to get. (You do not have to worry about sales tax in this situation.)
Which of the following systems can be used to represent the above situation where x represents the number of spiral notebooks and y represents the number of 3-ring binders?
Which of the graphs above represent the set of possible solutions?
Combine like terms to simplify the expression