Algebra 2 2-8 Mixed Review: Two-Variable Inequalities
star
star
star
star
star
Posljednje ažuriranje almost 4 years ago
7

10
A.CED.2
F.IF.7.b
10
10
10

10
10
10
Review Lesson 2-7: Graph the absolute value function by translating the graph of its parent function. Use a color other than black.
Review Lesson 2-2: Tag each equation based on whether y varies directly with x. If it does, also tag it with its constant of variation.
y varies directly with x
y does NOT vary directly with x
constant of variation: -5
constant of variation: 3
constant of variation: 100
Graphing: Make a scatter plot of the data. Consider the correlation between variables. Zoom and pan your scatter plot to establish an appropriate viewing window.
🔍 Pro Tip: You may need to zoom in or out as you plot the points to keep the labels out of your way.
Describe the correlation between the variables in the previous item.
Vocabulary Review: Identify each statement based on whether or not it is an inequality.
Inequality
NOT an inequality
Vocabulary Review: Complete each inequality with an inequality symbol from the left.
<
>
-2 __?__ 1
0.05 __?__ 0.5
8/6 __?__ 16/6
|-3.5| __?__ -4
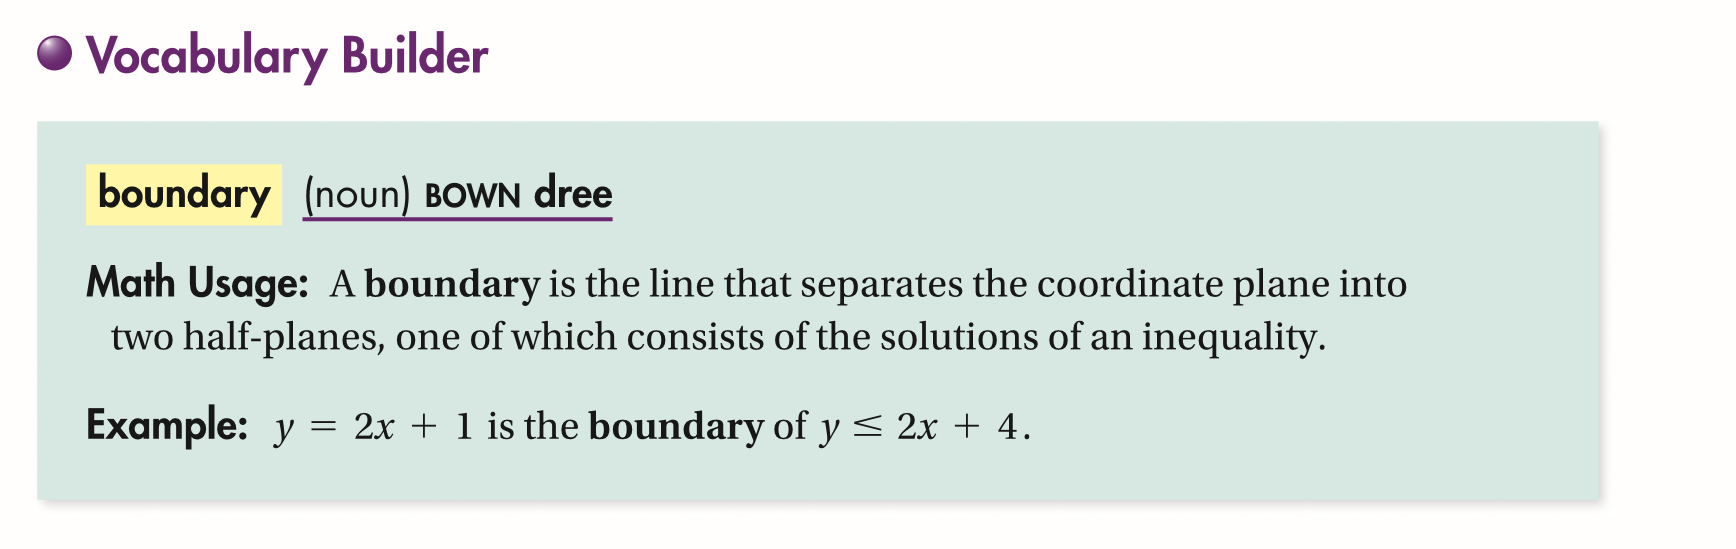
Use Your Vocabulary: Categorize each inequality based on the boundary line of its graph.
Solid boundary line
Dashed boundary line