Algebra 2 4-3 Guided Practice: Modeling With Quadratic Functions
star
star
star
star
star
Posljednje ažuriranje over 3 years ago
15

3


3
3
3
20
10
![]()
Video Check: Select all that apply with regards to the video embedded directly above this item.

![]()
Video Check: Select all that apply with regards to the video embedded directly above this item.

Take Note: When writing the equation of a quadratic function from information about its parabola, when should you use vertex form?
Take Note: When writing the equation of a quadratic function from information about its parabola, when should you use standard form?
Take Note: Summarize the process of writing the equation of a quadratic function when you know three points on its parabola.

Problem 1 Got It?
![]()
Video Check: Select all that apply with regards to the video embedded directly above this item.
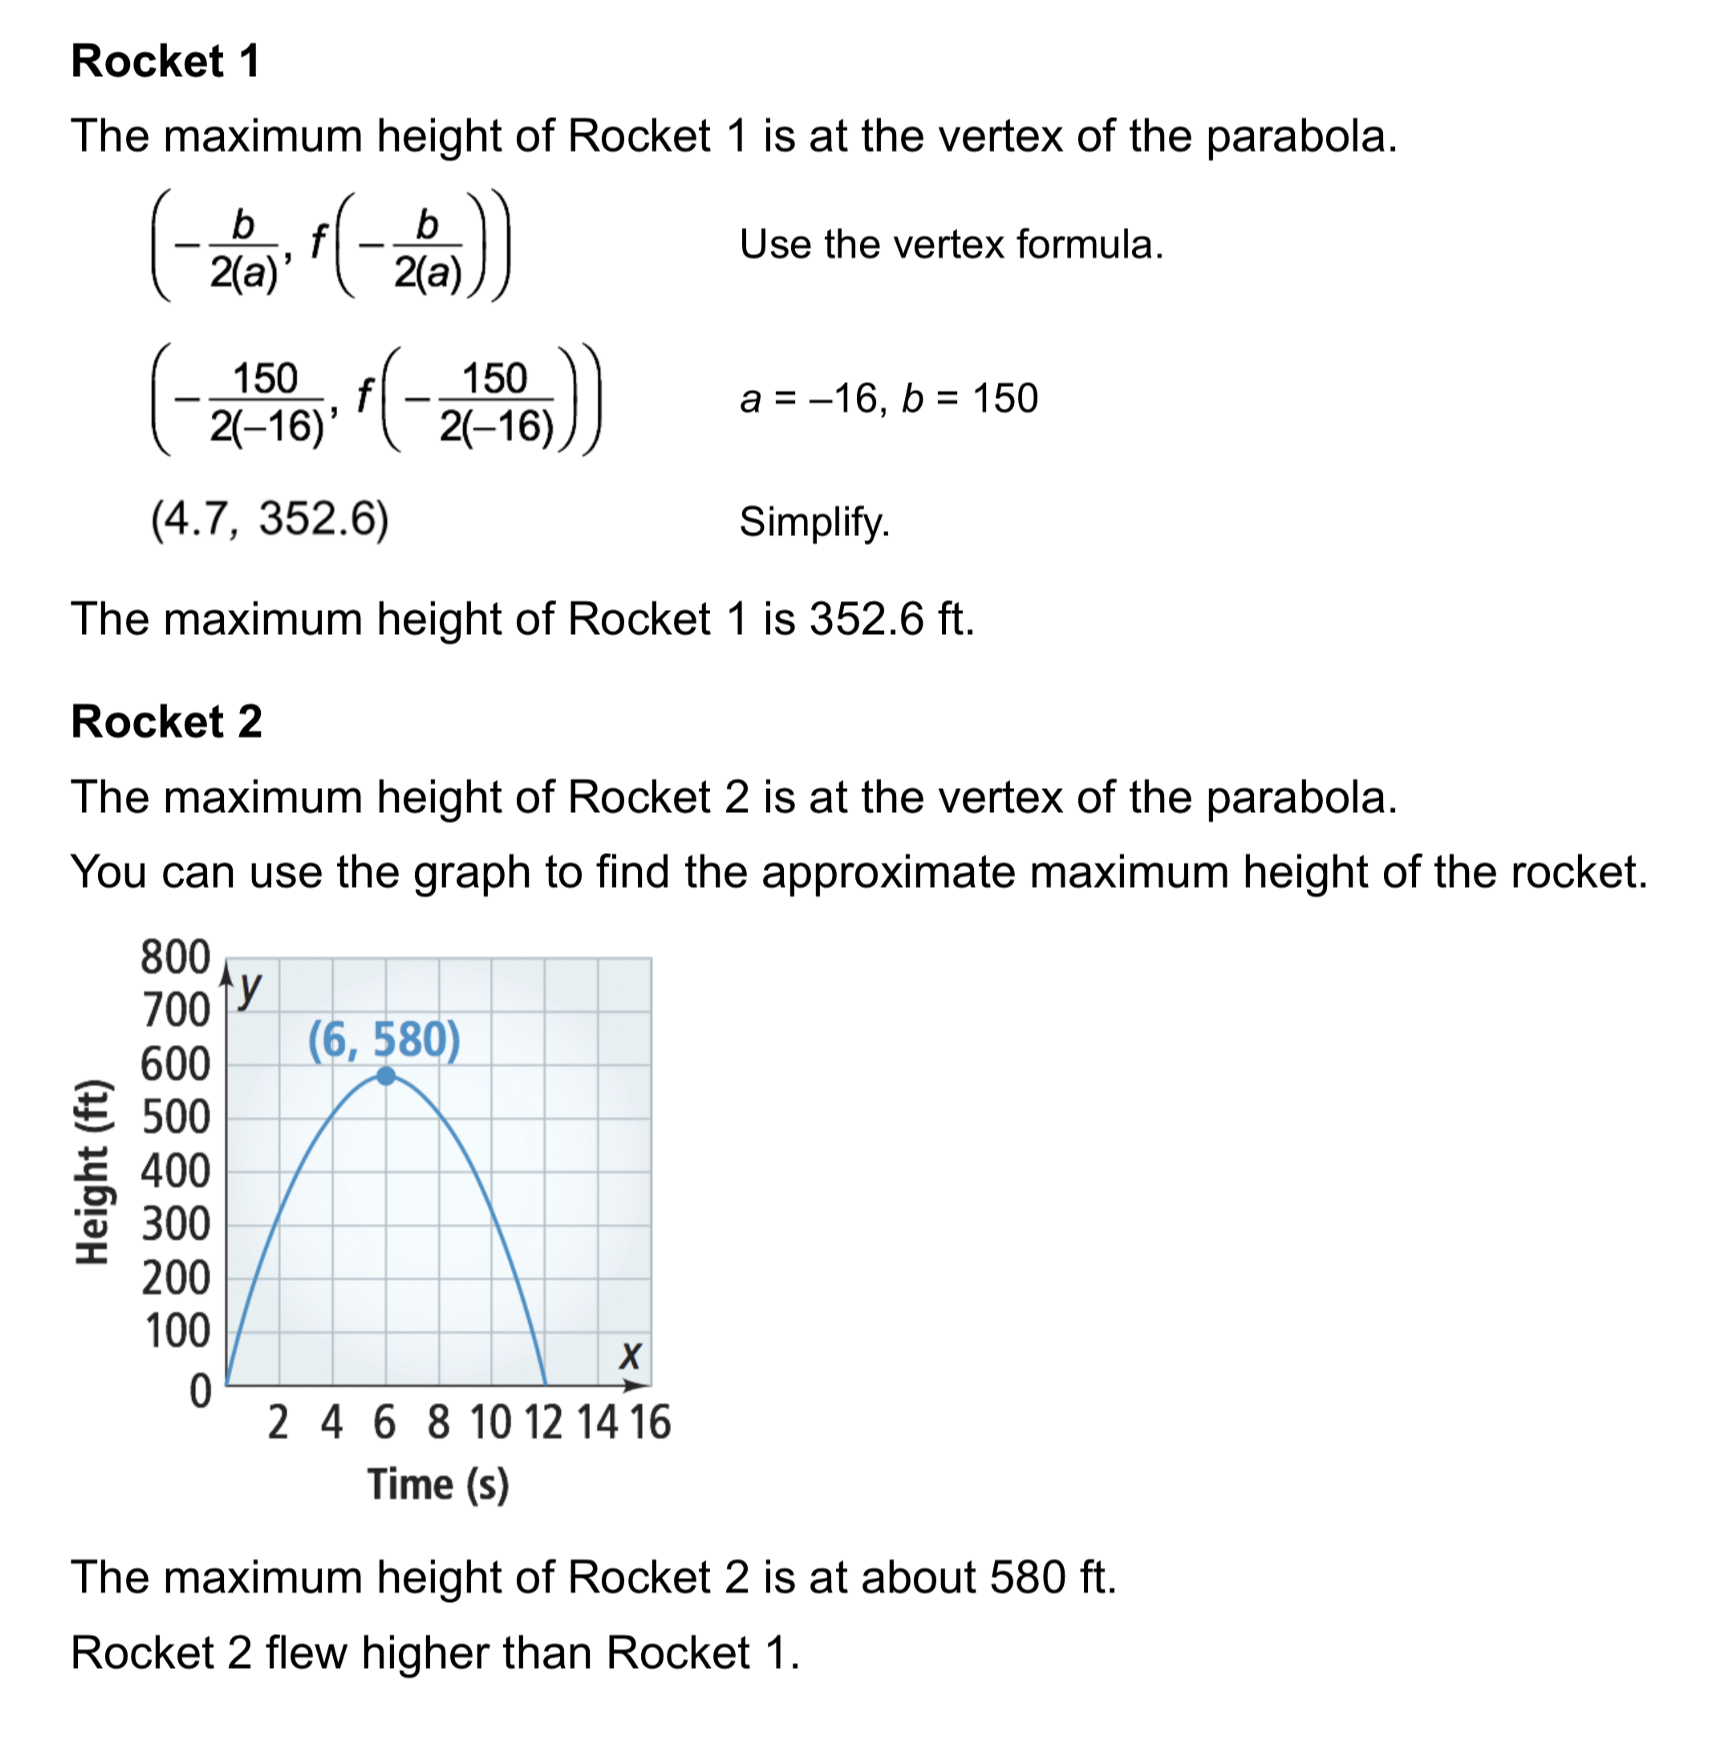
Problem 2 Got It? Refer to Rocket 1 and Rocket 2 from Problem 2, shown here. Which rocket stayed in the air longer?
![]()
Video Check: Select all that apply with regards to the video embedded directly above this item.
Problem 3 Got It? The table shows a meteorologist's predicted temperatures for a summer day in Denver, Colorado.
Complete the following steps at desmos.com/calculator.
Add a table to the Desmos graphing utility and plot the points from the meteorologist's table. As in Problem 3, use a 24-hour clock when entering times into the table. Zoom and pan your graph to establish an appropriate viewing window.
On the next Desmos row, add a quadratic regression function to model the data. Recall Desmos' regression notation: y₁ ~ ax₁² + bx₁ + c.
Zoom and pan your graph to establish an appropriate viewing window.
Use the model to predict the high temperature for the day. Click the parabola once to select it, then click at the point representing the high temperature (the vertex) of the parabola to add a label that identifies its coordinates. Be careful not to select the point from the table that is near the vertex.
Capture a screenshot of your graph and upload it to the canvas.

Problem 3 Got It? Record the approximate high temperature for the day, as indicated by your model in the previous item. Enter only a number to represent the high temperature in degrees Fahrenheit. Round to the hundredths place.

🧠 Retrieval Practice:
Summarize the mathematical content of this lesson. What topics, ideas, and vocabulary were introduced?
Solve It! What equation, in standard form, models the path of the ball? Hint: Let the x-axis model the horizontal line at waist level and use the x-intercepts.
Problem 2 Got It? What is a reasonable domain and range for each quadratic model?
R:
D:
R:
D:
Rocket 1
Rocket 2
Problem 2 Got It? Reasoning: Describe what the domains tell you about each of the models and why the domains for the models are different.