Algebra 2 5-2 Guided Practice: Polynomials, Linear Factors, and Zeros
star
star
star
star
star
Last updated over 3 years ago
29 Nsɛmmisa

3
30
F.IF.7.c
3
3
10
A.APR.3
10
F.IF.7.c
10
10
A.APR.3
10
10
F.IF.7.c

3
10
9

3
3
![]()
Video Check: Select all that apply with regards to the video embedded directly above this item.
Sovle It! Two linear equations are graphed in orange. At x =2.5, the product of the y-values on the two graphs is 1.5 • 3.5 = 5.25. The resulting product point, (2.5, 5.25), is shown in blue.

This diagram has been recreated using Desmos.

Instructions
1. Open a copy of the Desmos graph by clicking here.
2. Plot product points at inputs of 0, 0.5, 1, 1.5, and 2.
Take note of any patterns you see as you calculate and plot product points.
3. Click each product point to create coordinate labels.
4. Take a screenshot of your completed graph. Make sure you capture each product point and its label.
5. Upload your screenshot to the canvas.
6. Consider the shape that the product points are beginning to form...a parabola.
Solve It! Key takeaway:
The product of two linear functions (degree 1) is a quadratic function (degree 2). Consider (x1)(x1)=x2. That's why the graphs of two linear functions (orange lines) have a product function that is parabolic (the blue points). I'm not sure that the Solve It makes that clear, but that's the point!
![]()
Video Check: Select all that apply with regards to the video embedded directly above this item.

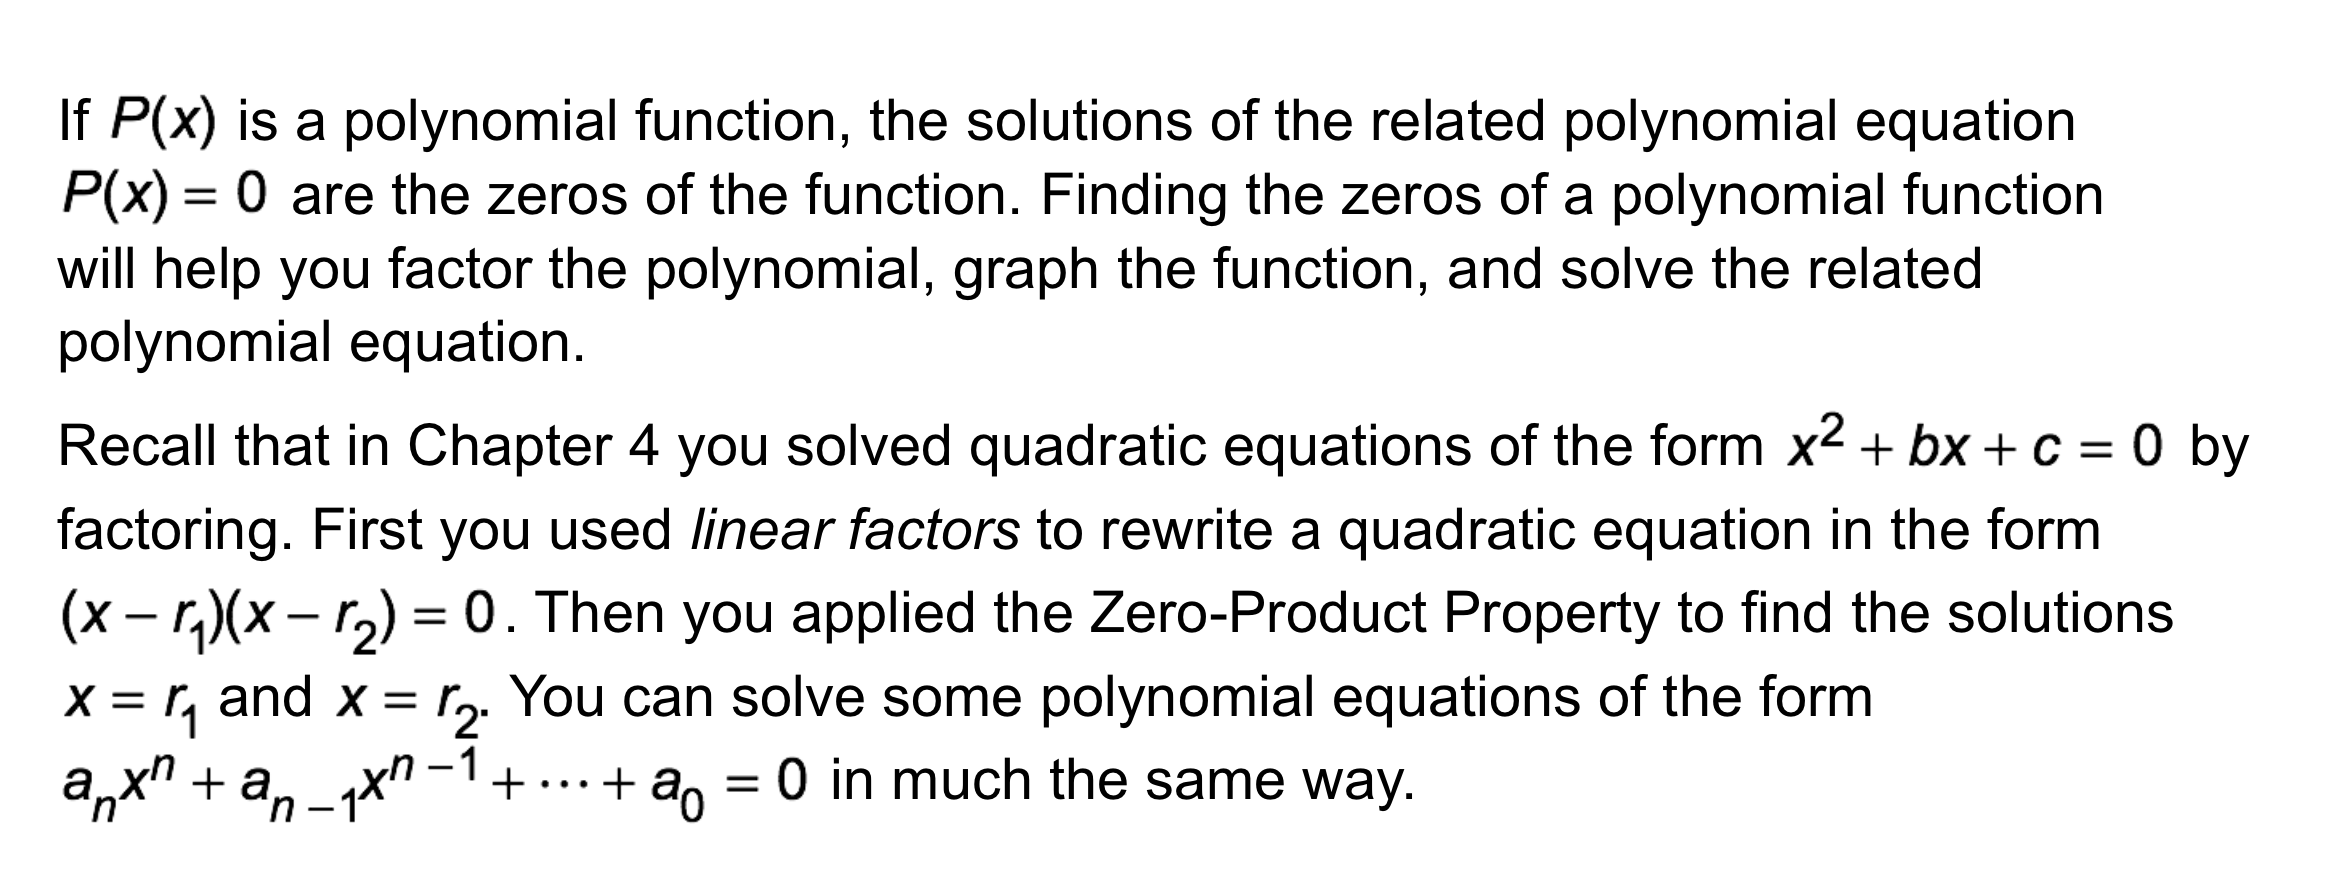
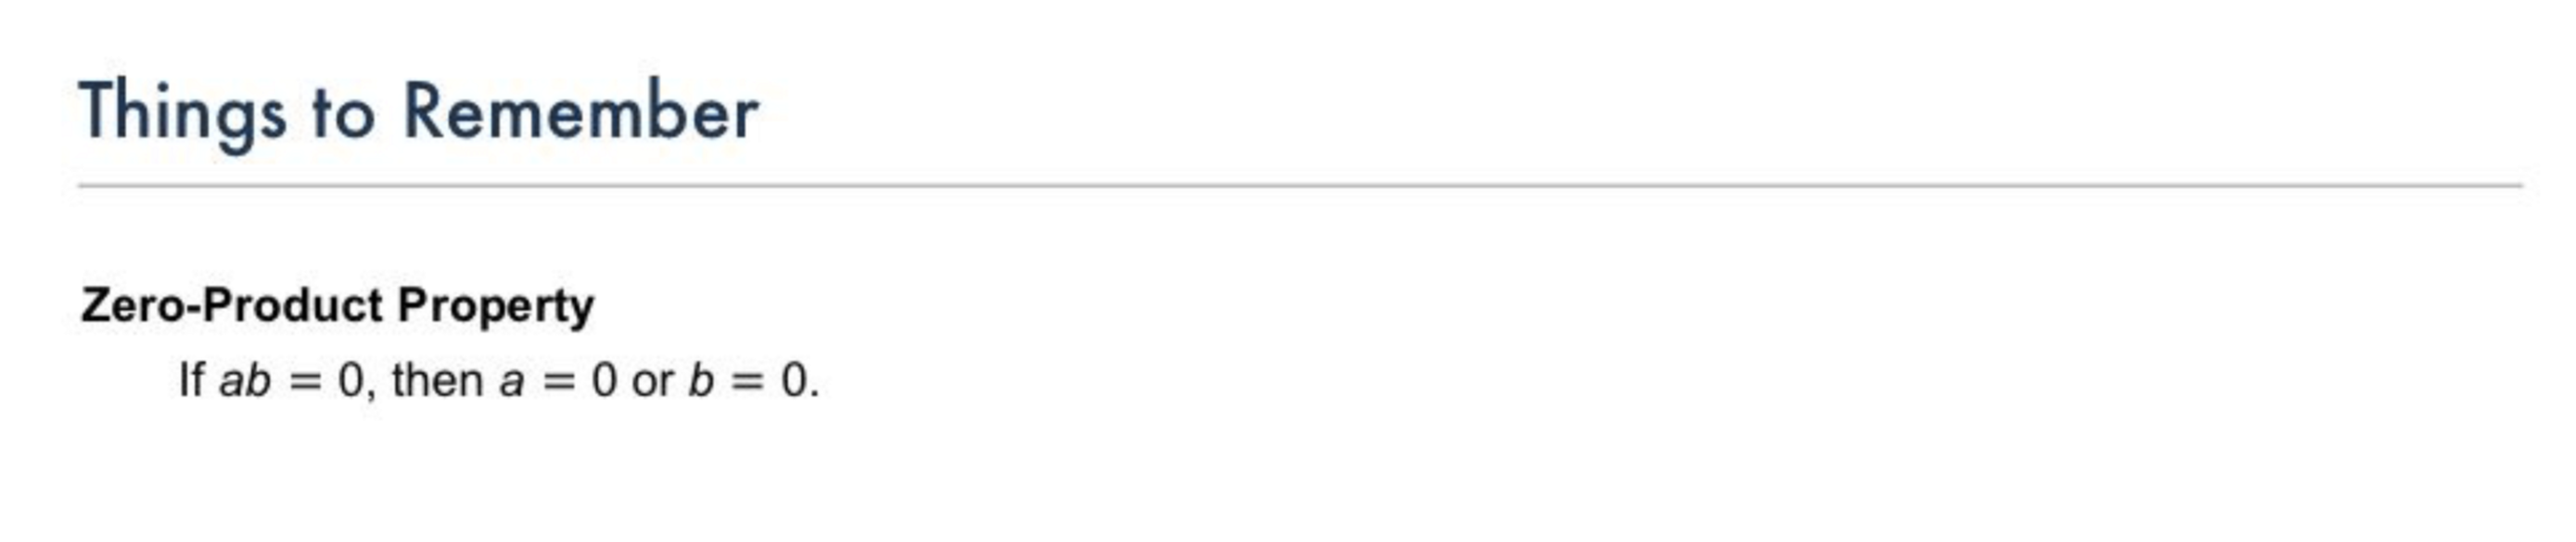
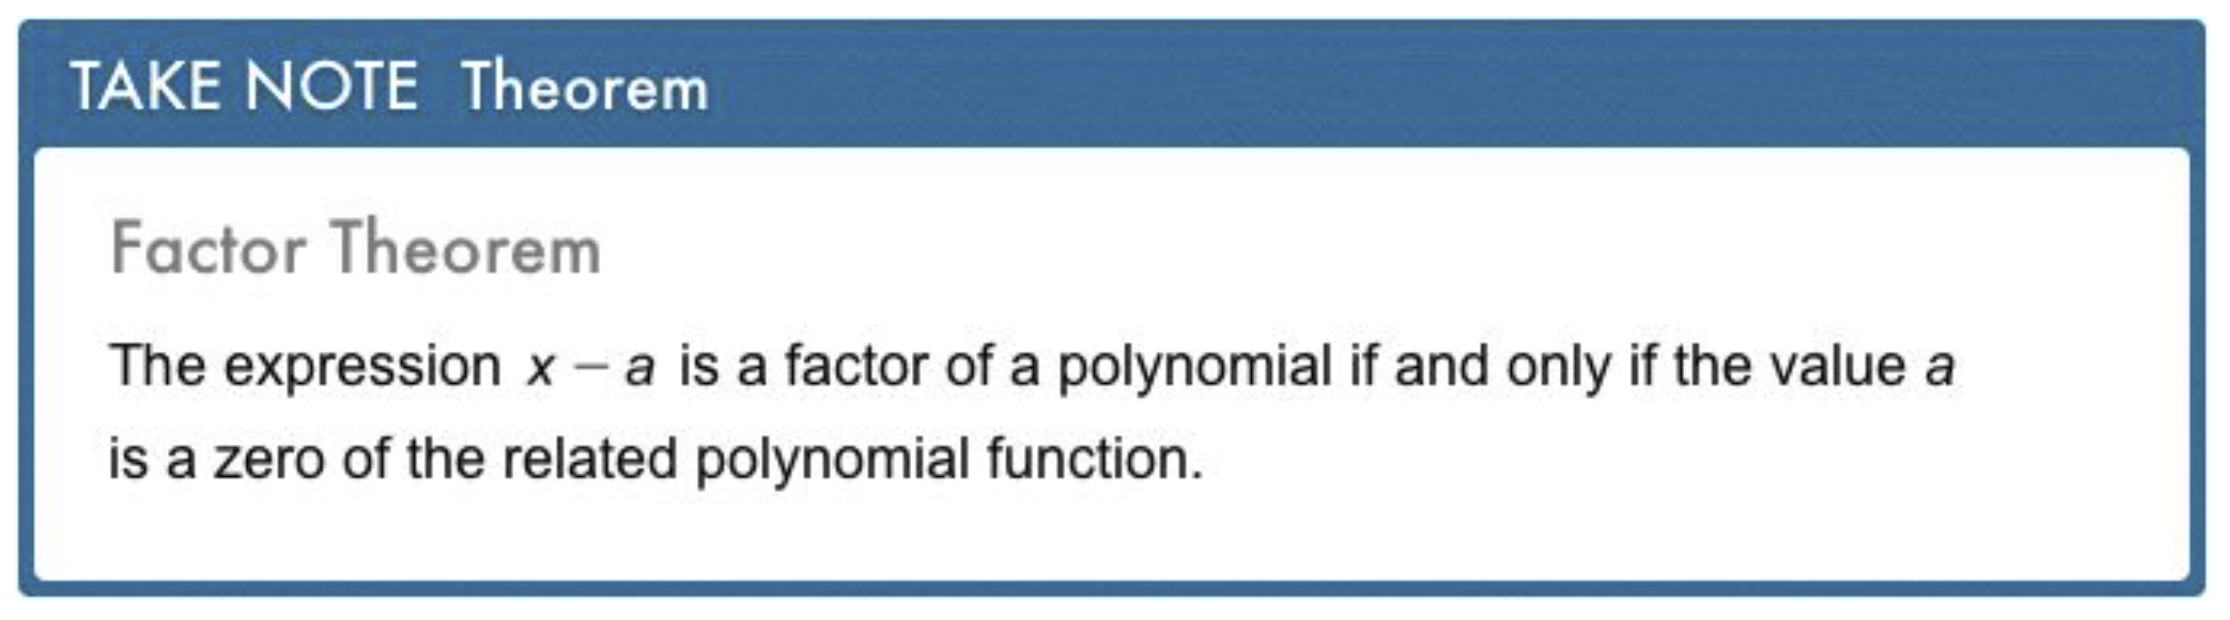
Take Note: Summarize the Zero-Product Property.
Take Note: What is the first step in factoring a quadratic trinomial written in standard form?
Problem 1 Got It?
![]()
Video Check: Select all that apply with regards to the video embedded directly above this item.
Take Note: What are the three x-intercepts of the quadratic function?
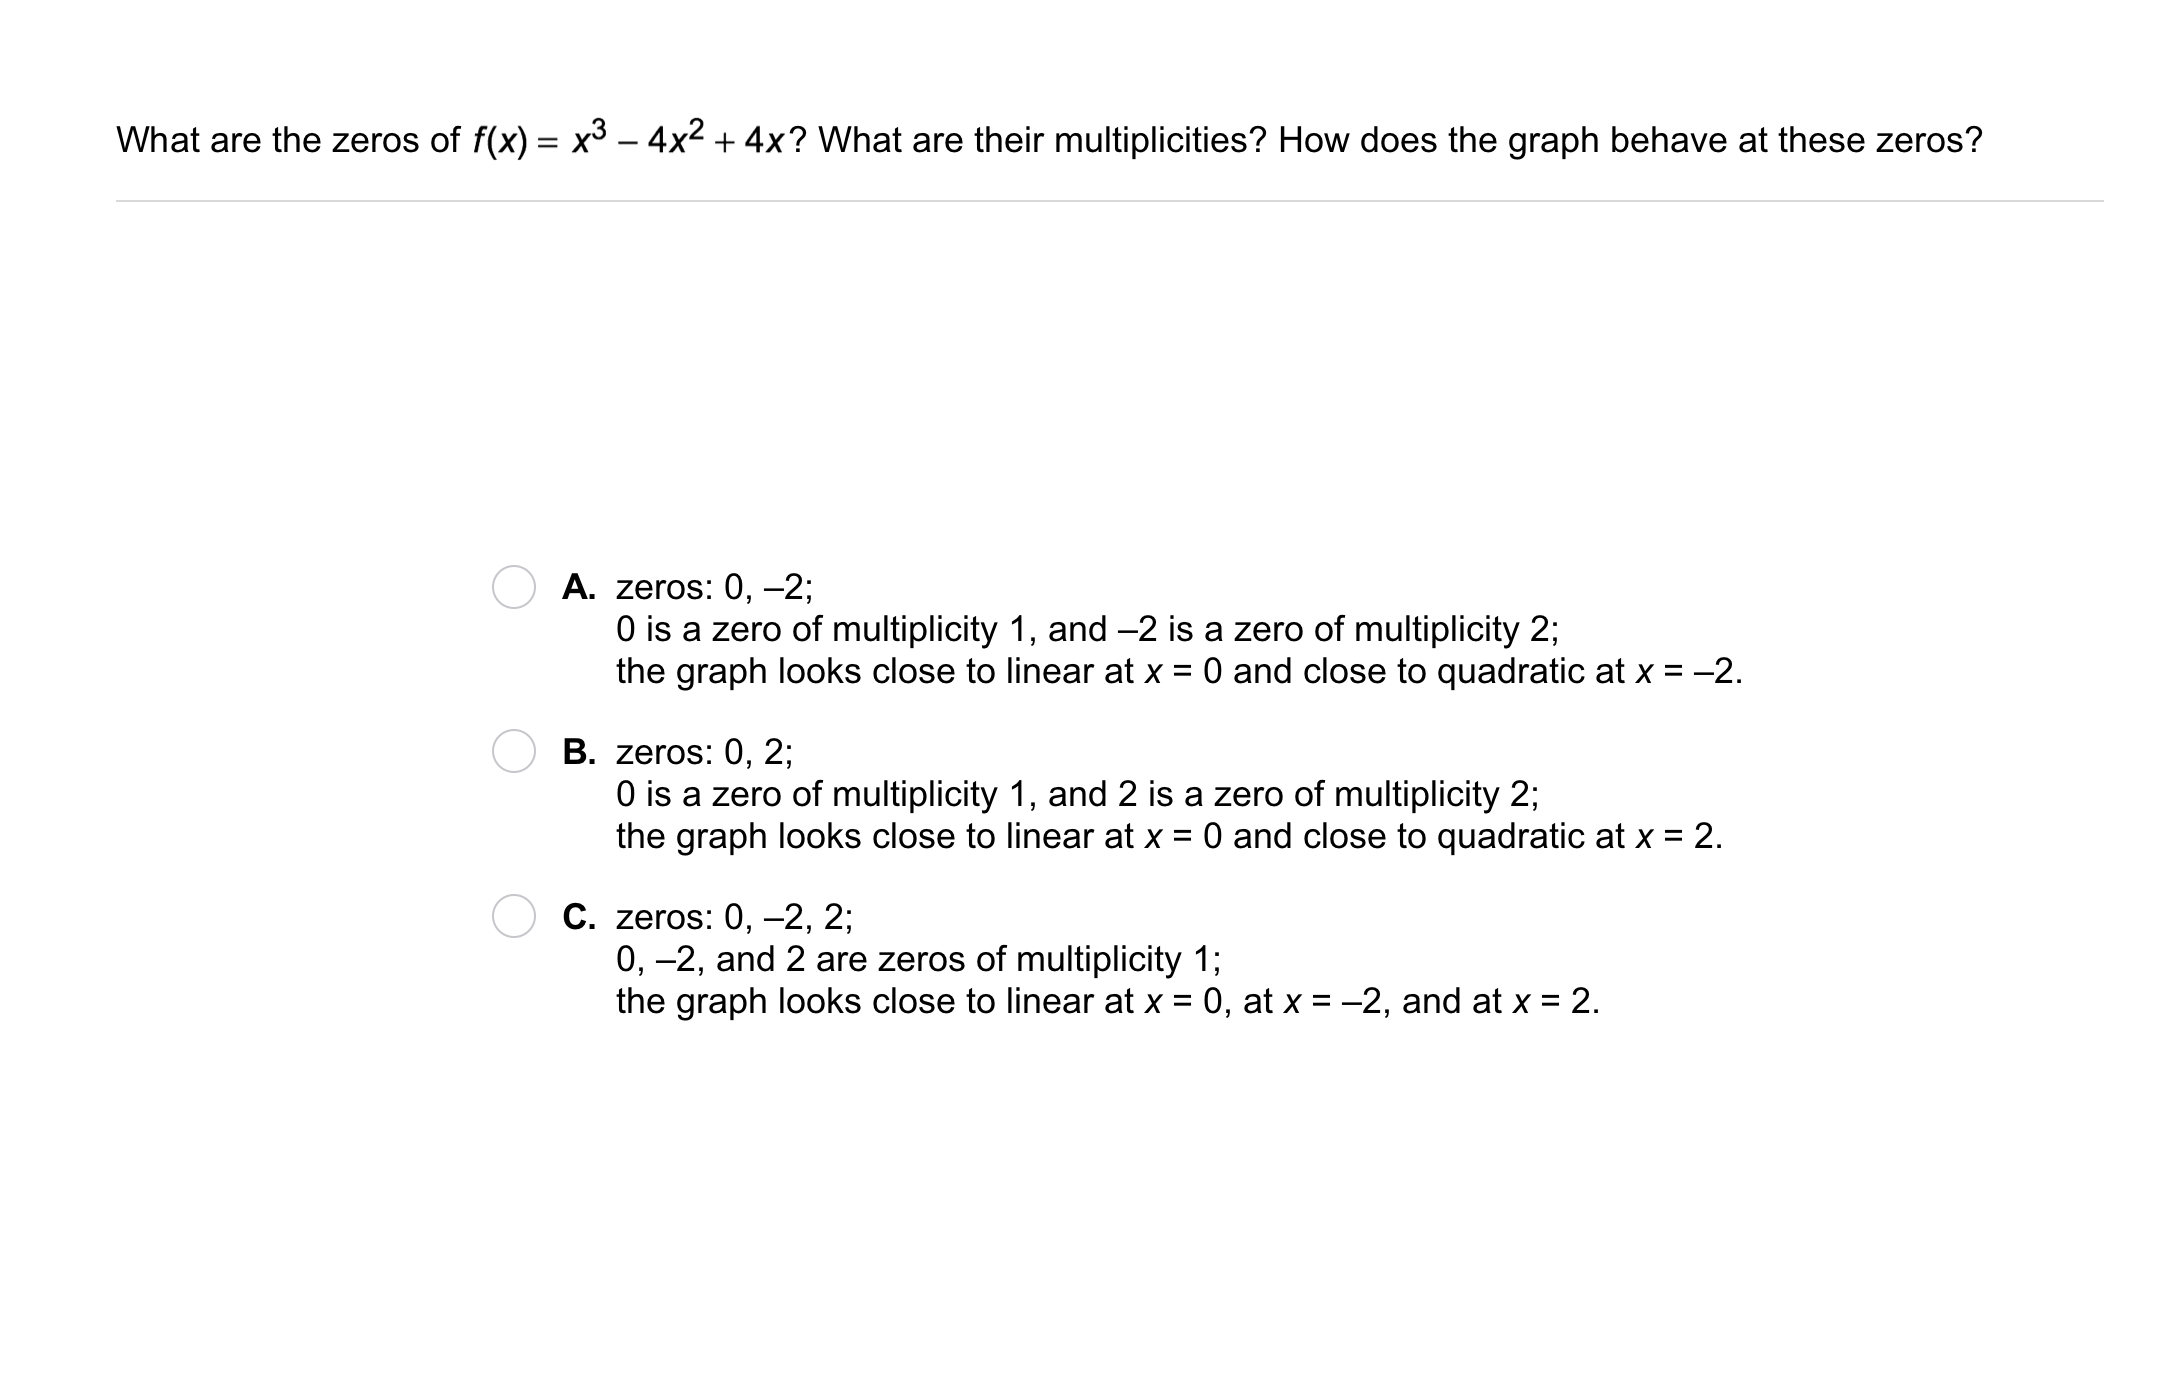
Problem 2 Got It? What are the zeros of the polynomial function?
Select all that apply.
Problem 2 Got It? Sketch a graph of the polynomial function. Use a color other than black.
Be sure to include relevant graph detail: label axes, indicate units and scale on both axes, and use arrows to represent end behavior, as appropriate.
Problem 2 Got It?
Graph of the polynomial function at desmos.com.
Zoom and pan your graph to establish an appropriate viewing window.
Click on all three zeros to label them.
Take a screenshot of your graph and upload or paste it to the canvas.
You may edit your sketched graph in the previous item, if necessary.
Problem 3 Got It? Use the factors in the left column to group polynomial expressions that, when set equal to y, match each description on the right.
A quadratic polynomial function with zeros 3 and -3.
A cubic polynomial function with zeros 0, 3, and -3.
Problem 3 Got It?
Graph the quadratic function and the cubic function you created in the previous item at desmos.com.
Zoom and pan your graph to establish an appropriate viewing window.
Take a screenshot of your graph and upload or paste it to the canvas.
Problem 3 Got It? Reasoning: How are the graphs you created in the previous item different from one another? How are they the same? You may use the canvas to help illustrate your written response.
![]()
Video Check: Select all that apply with regards to the video embedded directly above this item.
![]()
Take Note: Tag each polynomial function on the right based on its zeros and their multiplicities.
-2 is a zero
-5 is a zero of multiplicity 2
5 is a zero
2 is a zero of multiplicity 2
![]()
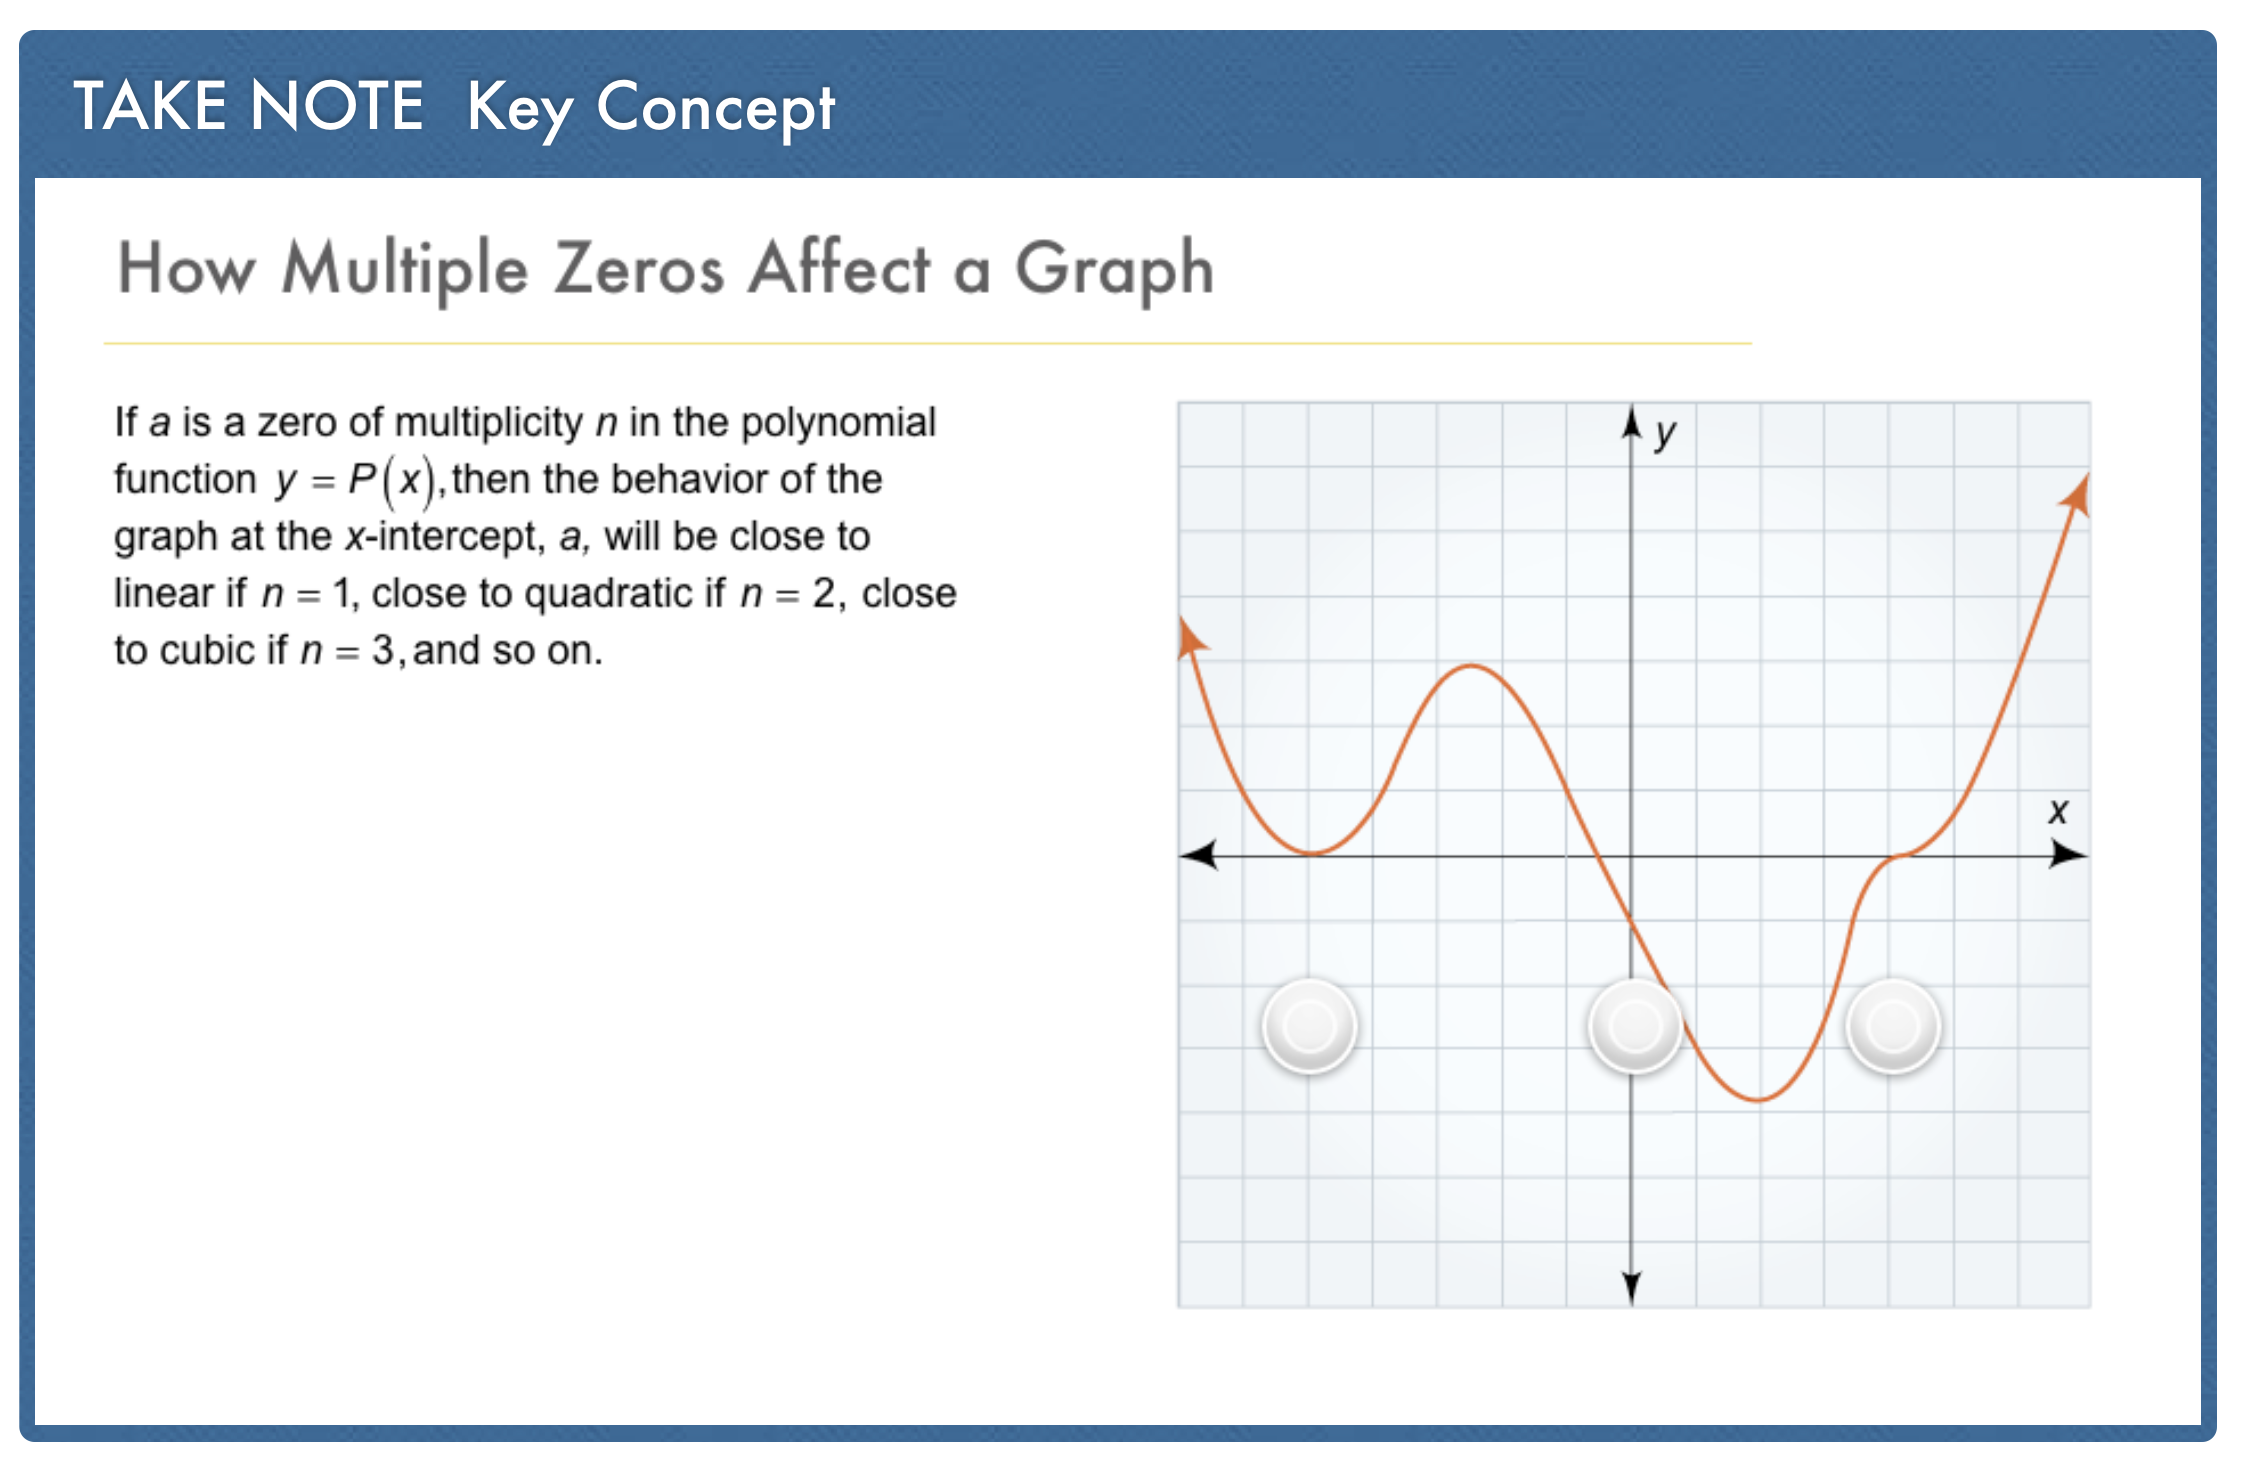
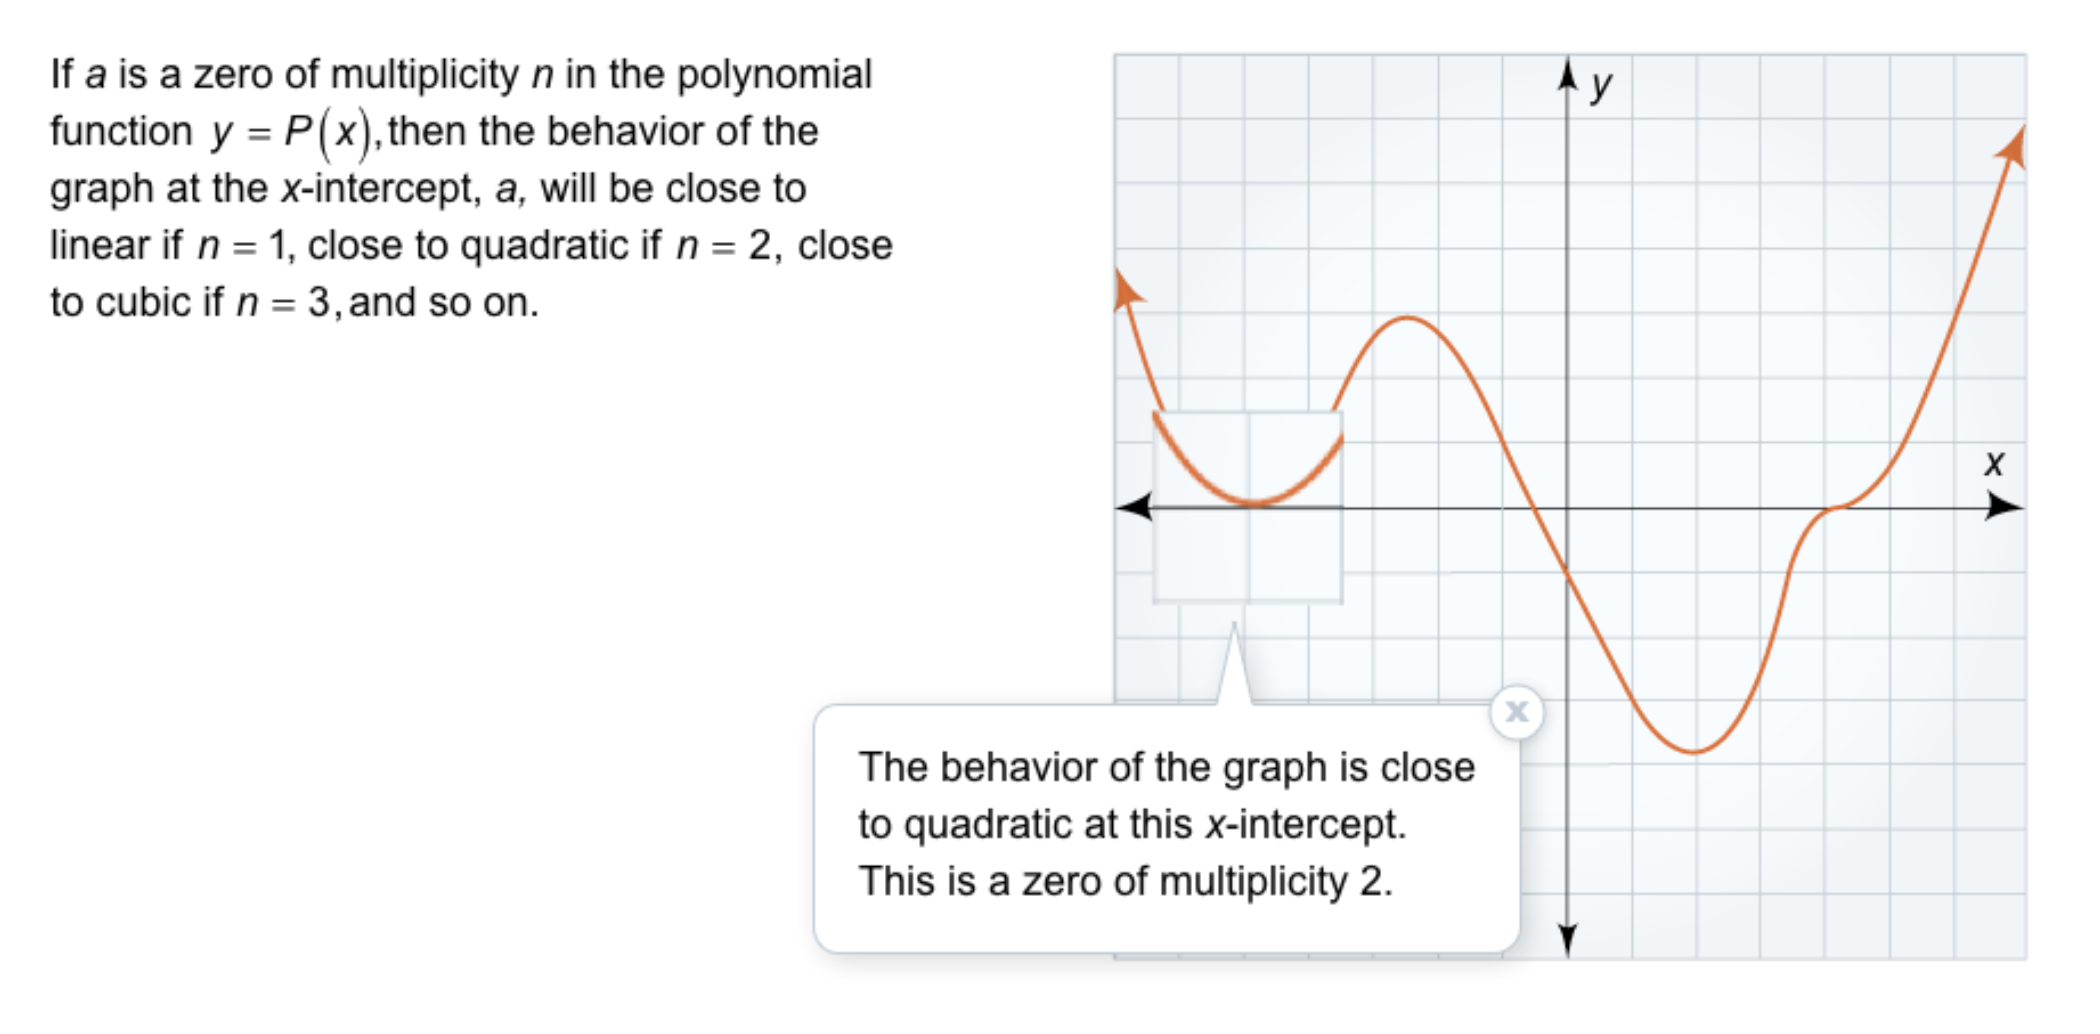
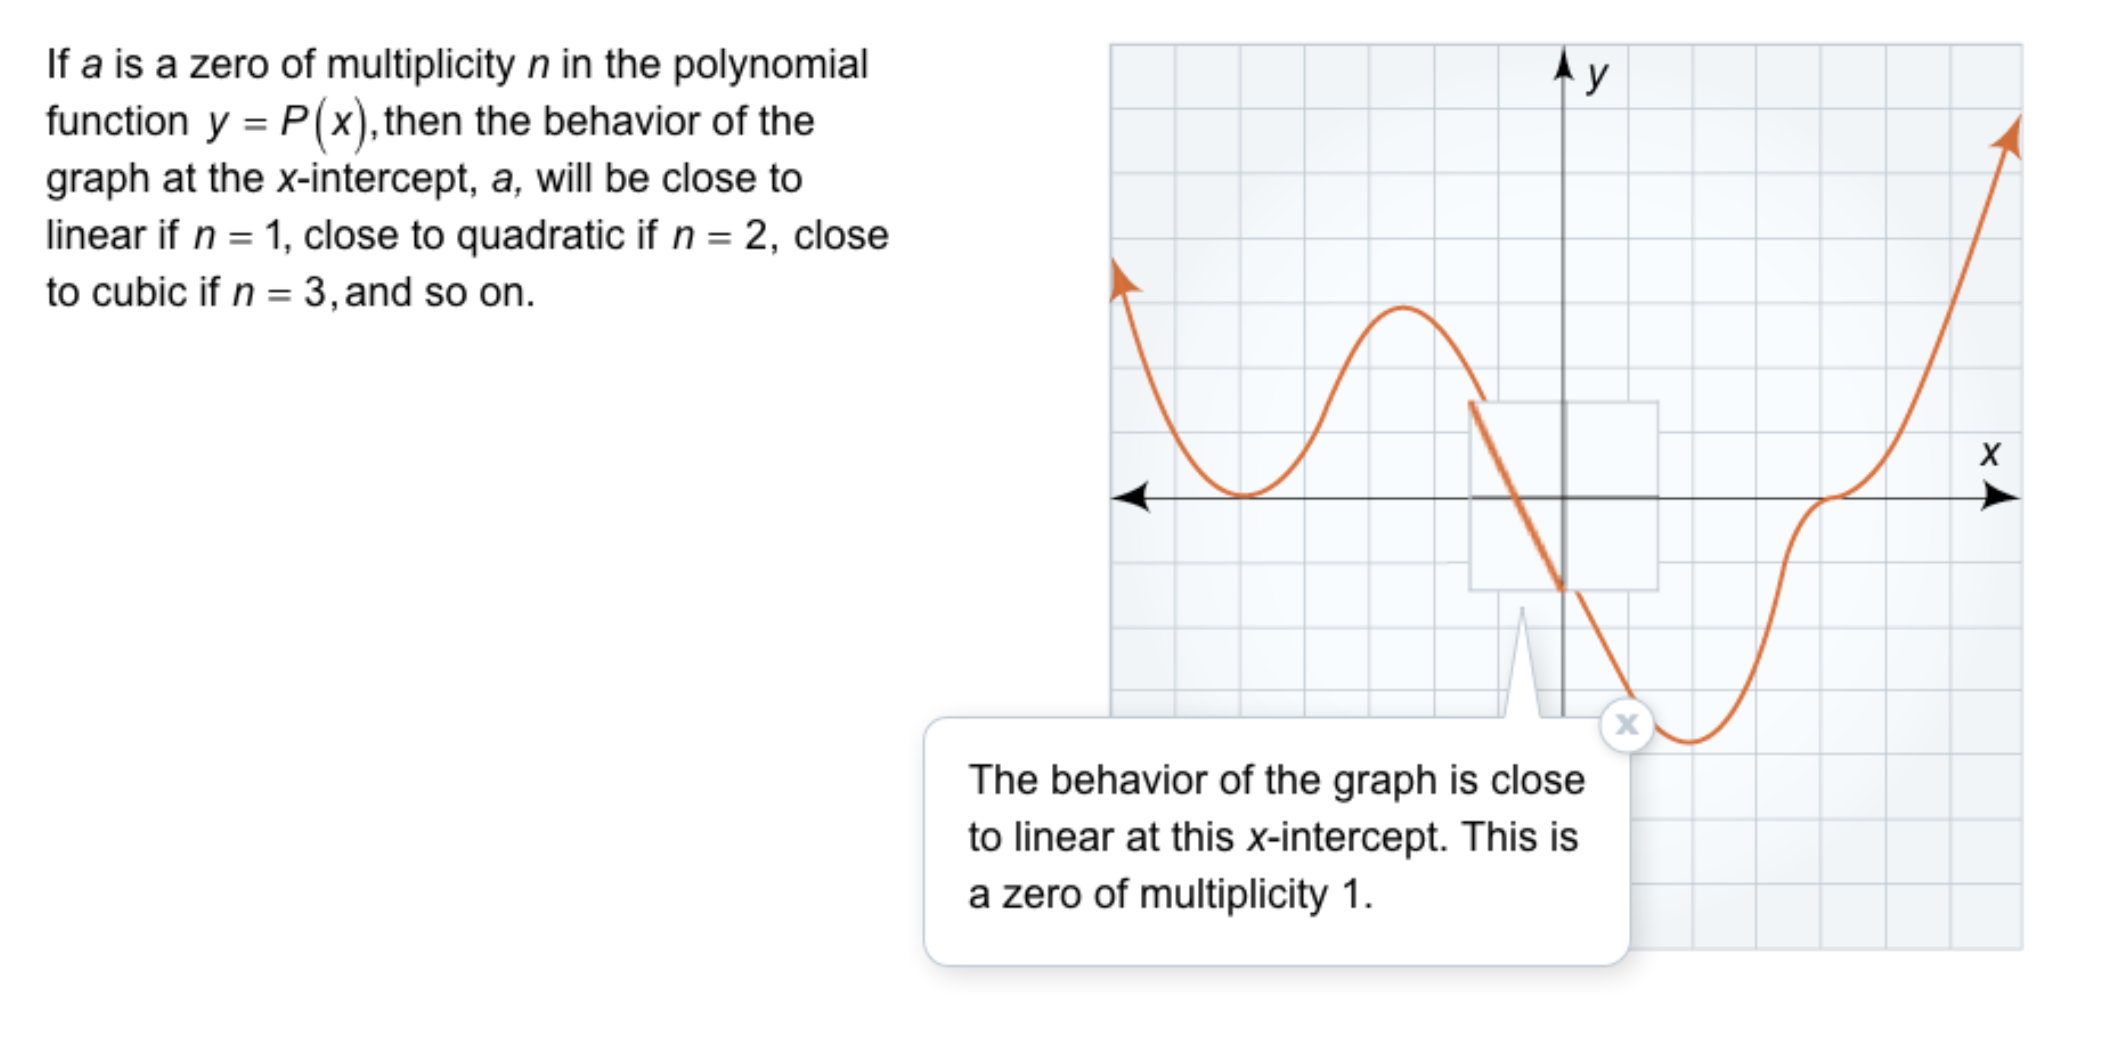
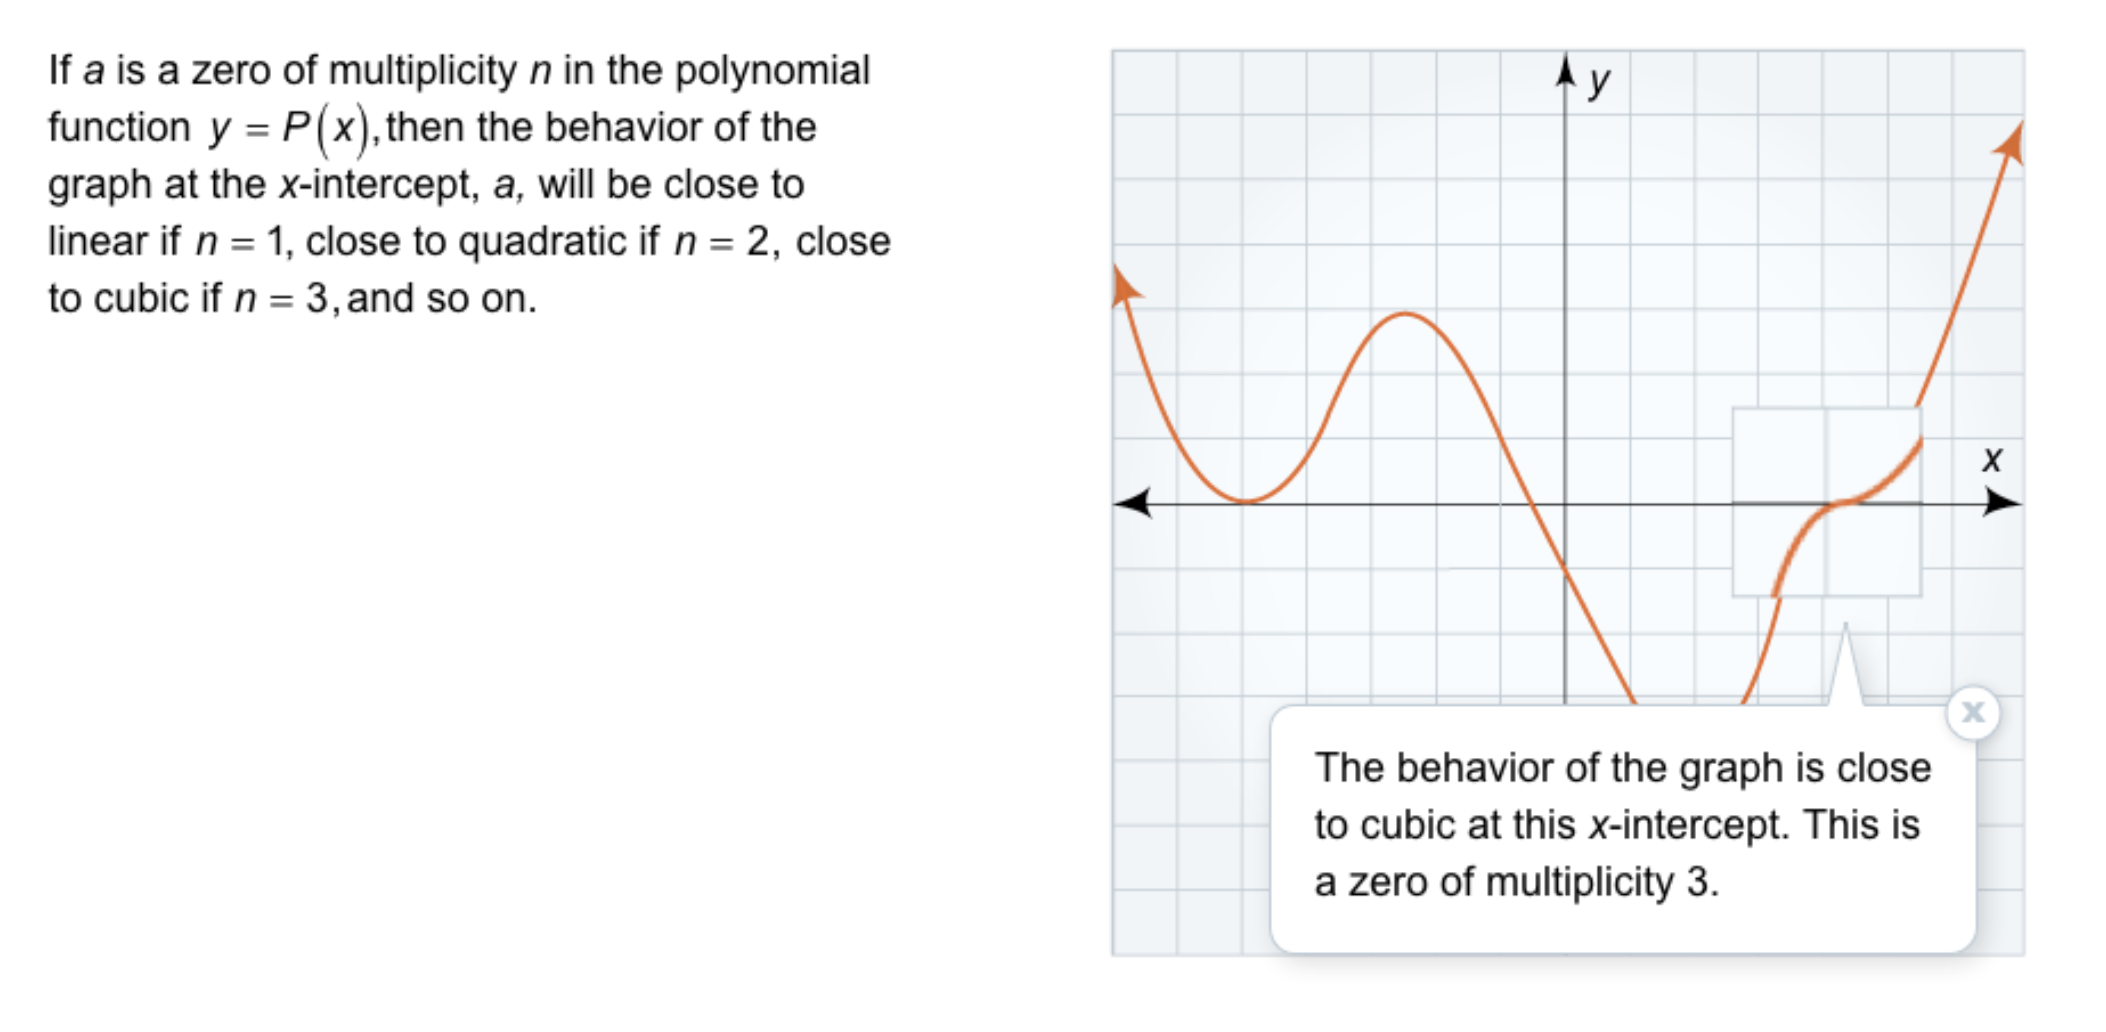
Take Note: Consider the x-intercepts of graphs of polynomial functions.
Recall that each x-intercept represents a zero of multiplicity 1, 2, or higher.
Three different types of x-intercepts are shown below and labeled as a, b, and c.

Match each intercept with the multiplicity of its related zero.
Intercept a
Resembles a quadratic function
Intercept b
Resembles a linear function
Intercept c
Resembles a cubic function
Zero of multiplicity 1
Zero of multiplicity 2
Zero of multiplicity 3
Take Note: Sketch the graph of a polynomial function with two zeros as described below.
A zero of multiplicity 2 at x = 3
A zero of multiplicity 1 at x = -2
You may also complete your work on paper or on a whiteboard and upload a clear picture of it to the canvas.
Problem 4 Got It?
![]()
Video Check: Select all that apply with regards to the video embedded directly above this item.
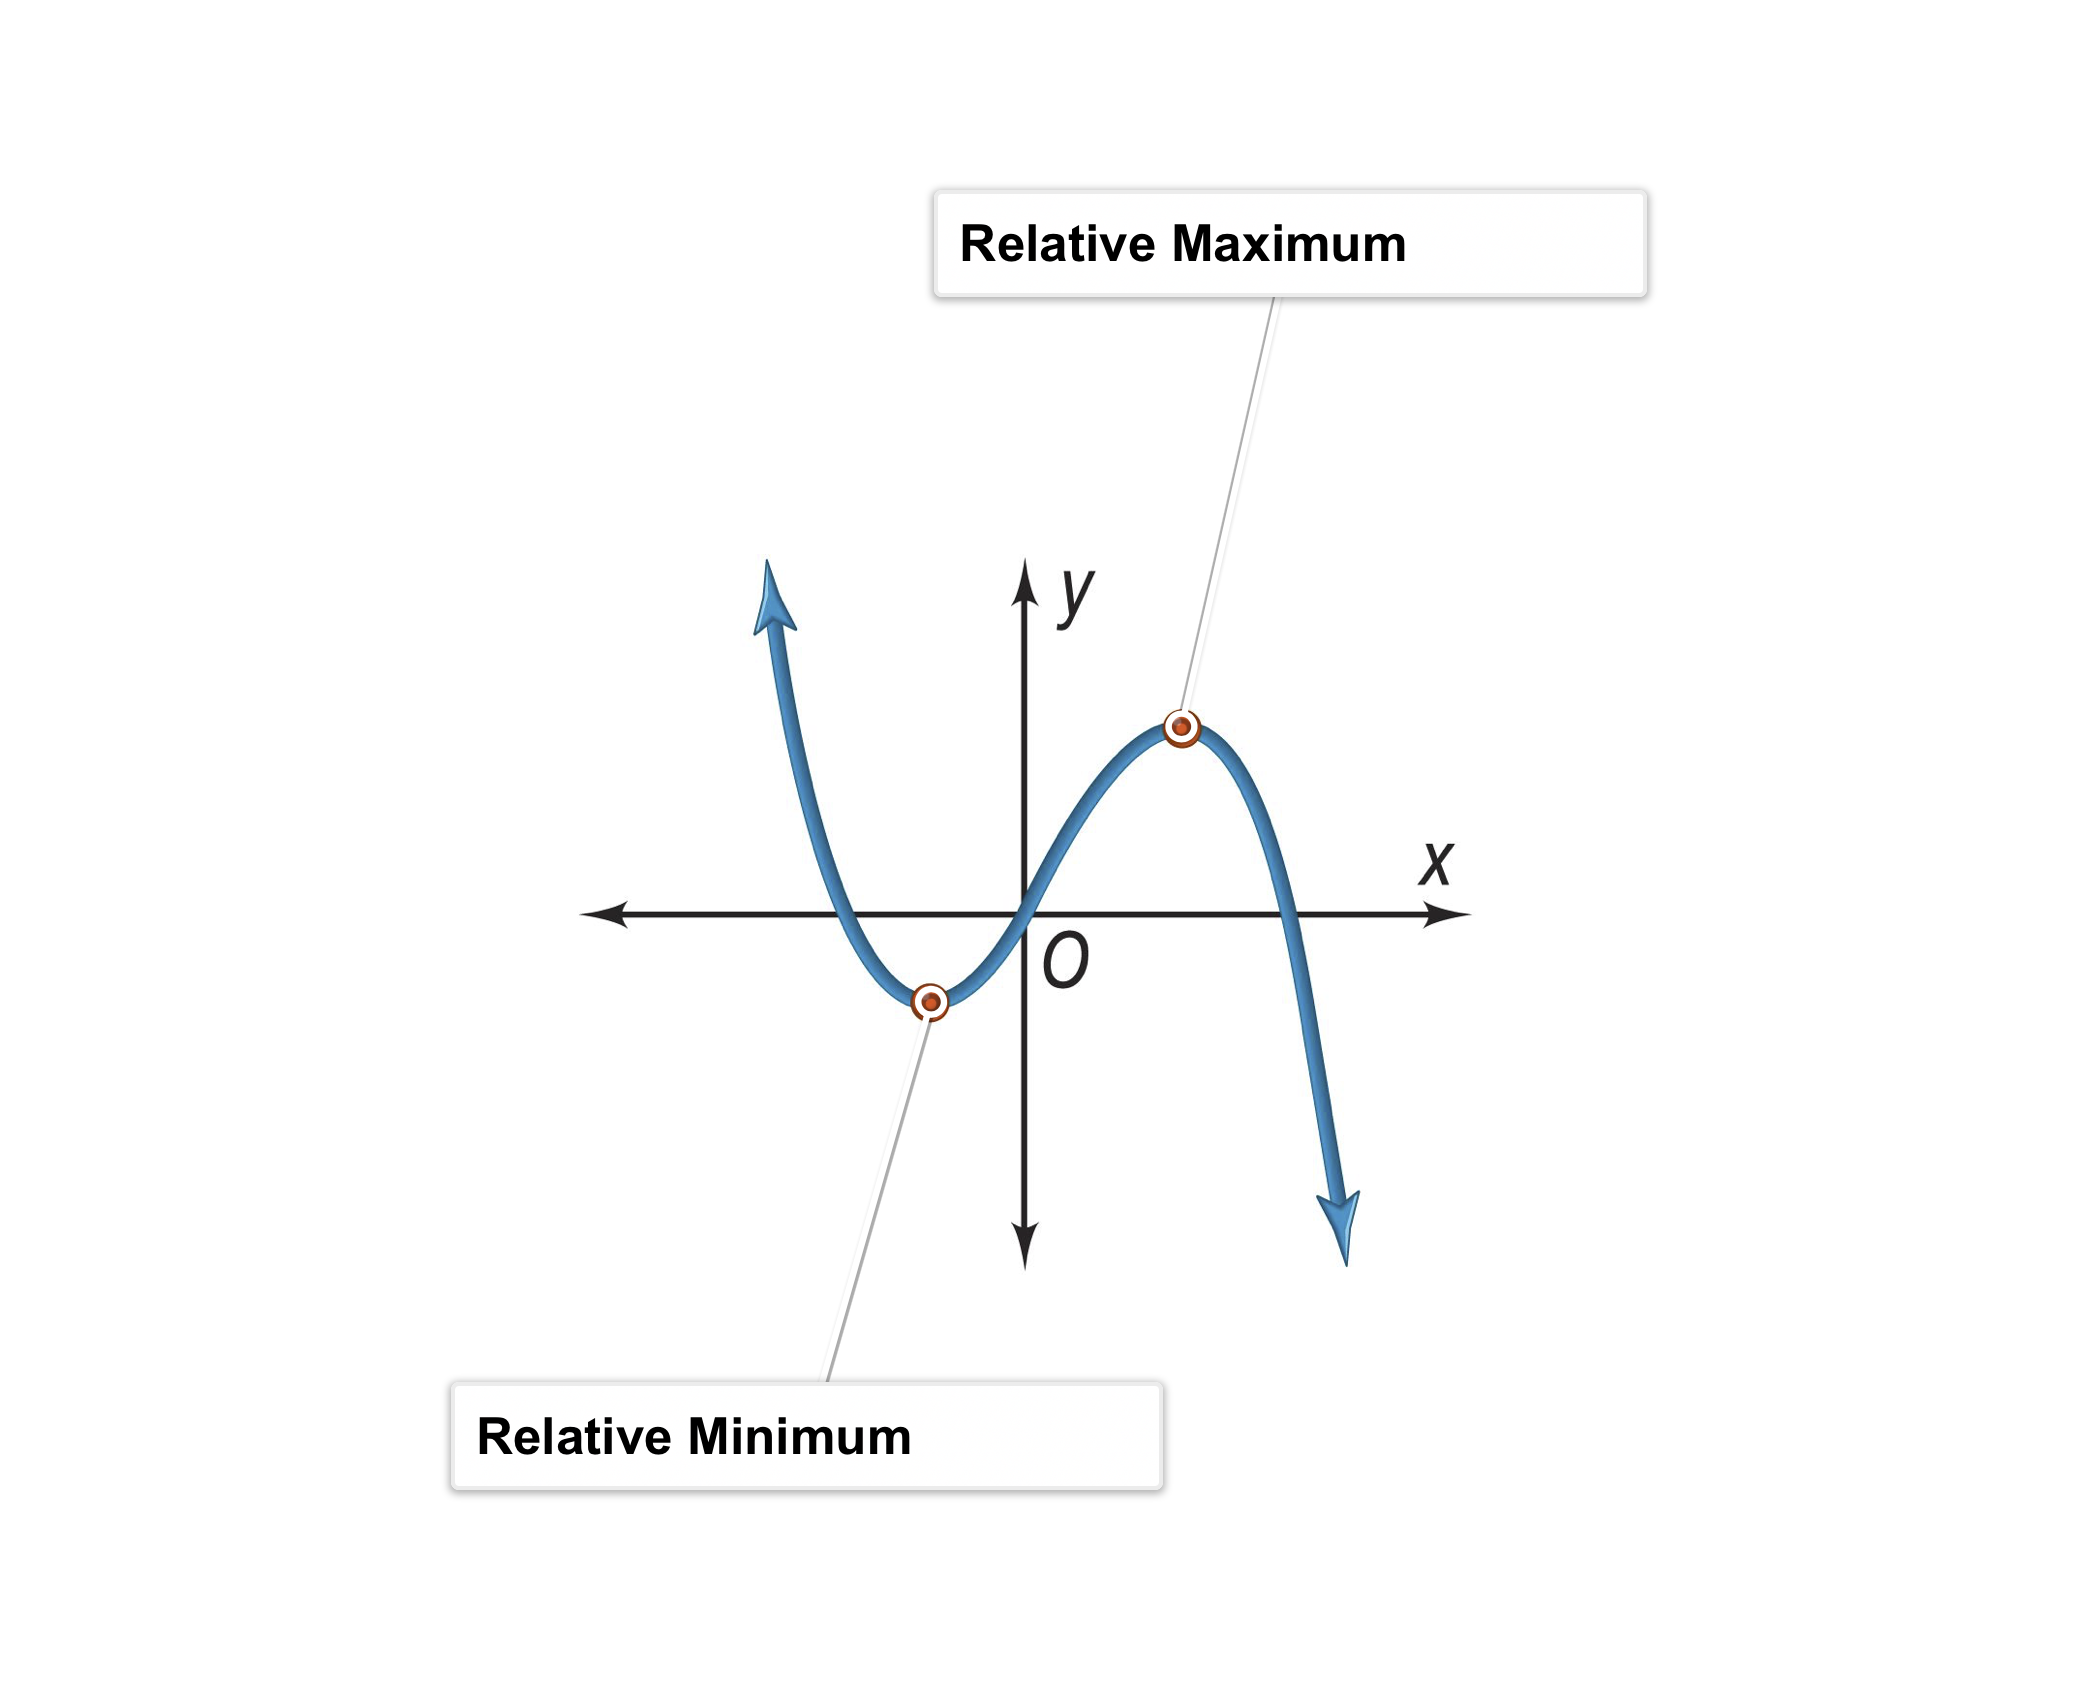
Take Note: Define turning point. You may use the canvas to help illustrate your written definition.
Take Note: Define relative maximum. You may use the canvas to help illustrate your written definition.
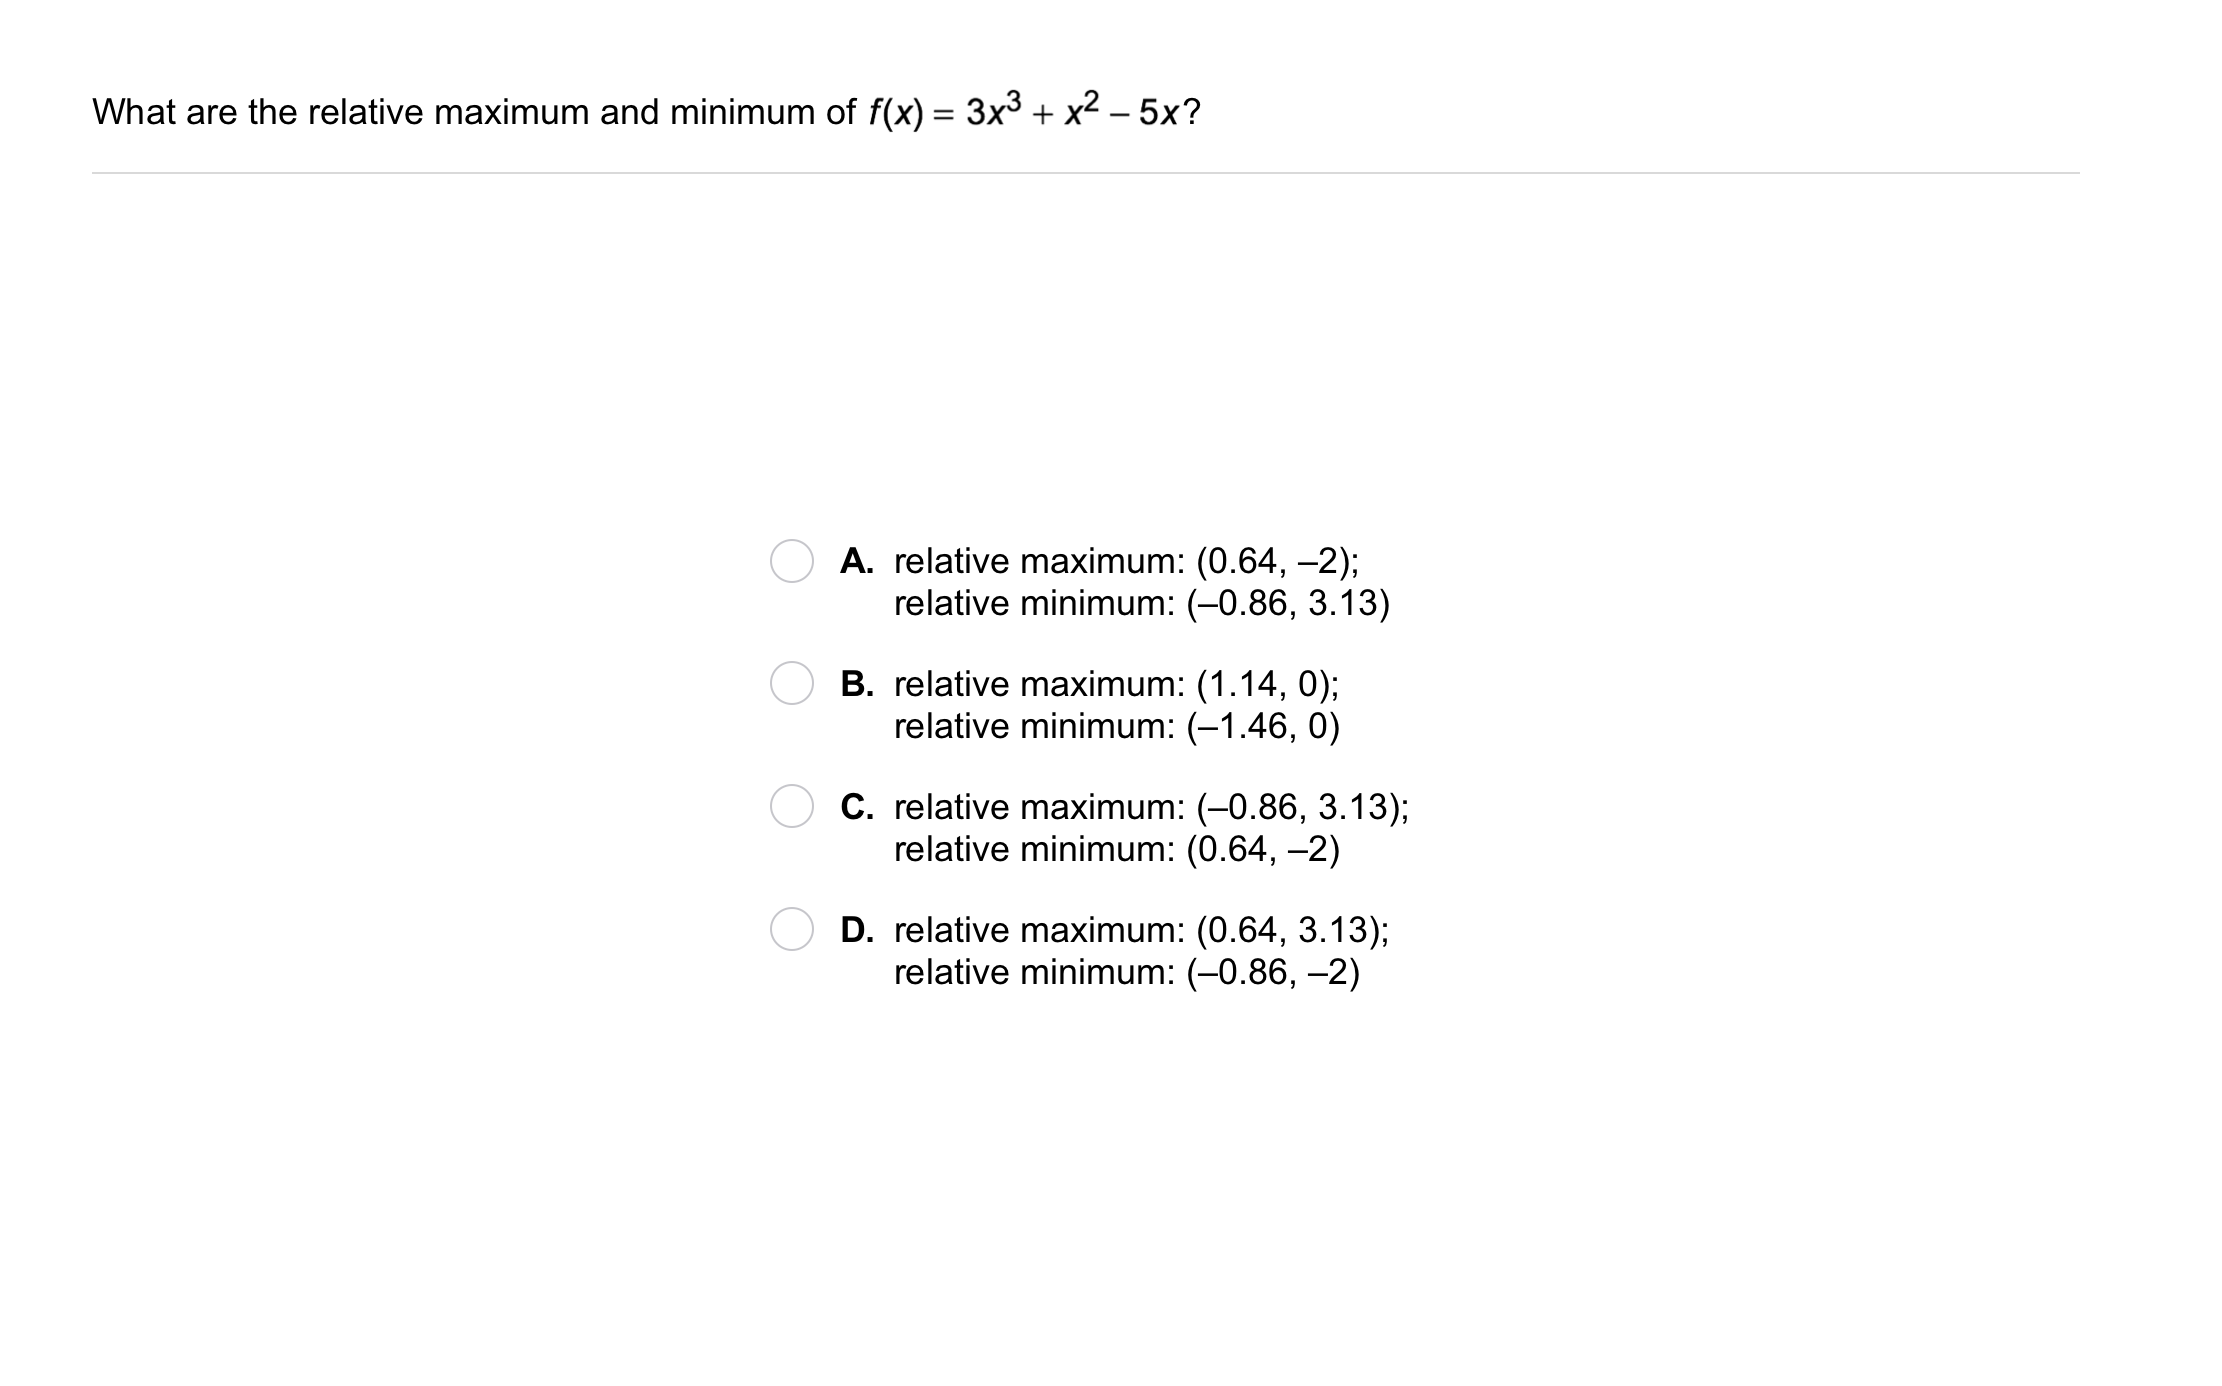
Problem 5 Got It?
![]()
Video Check: Select all that apply with regards to the video embedded directly above this item.
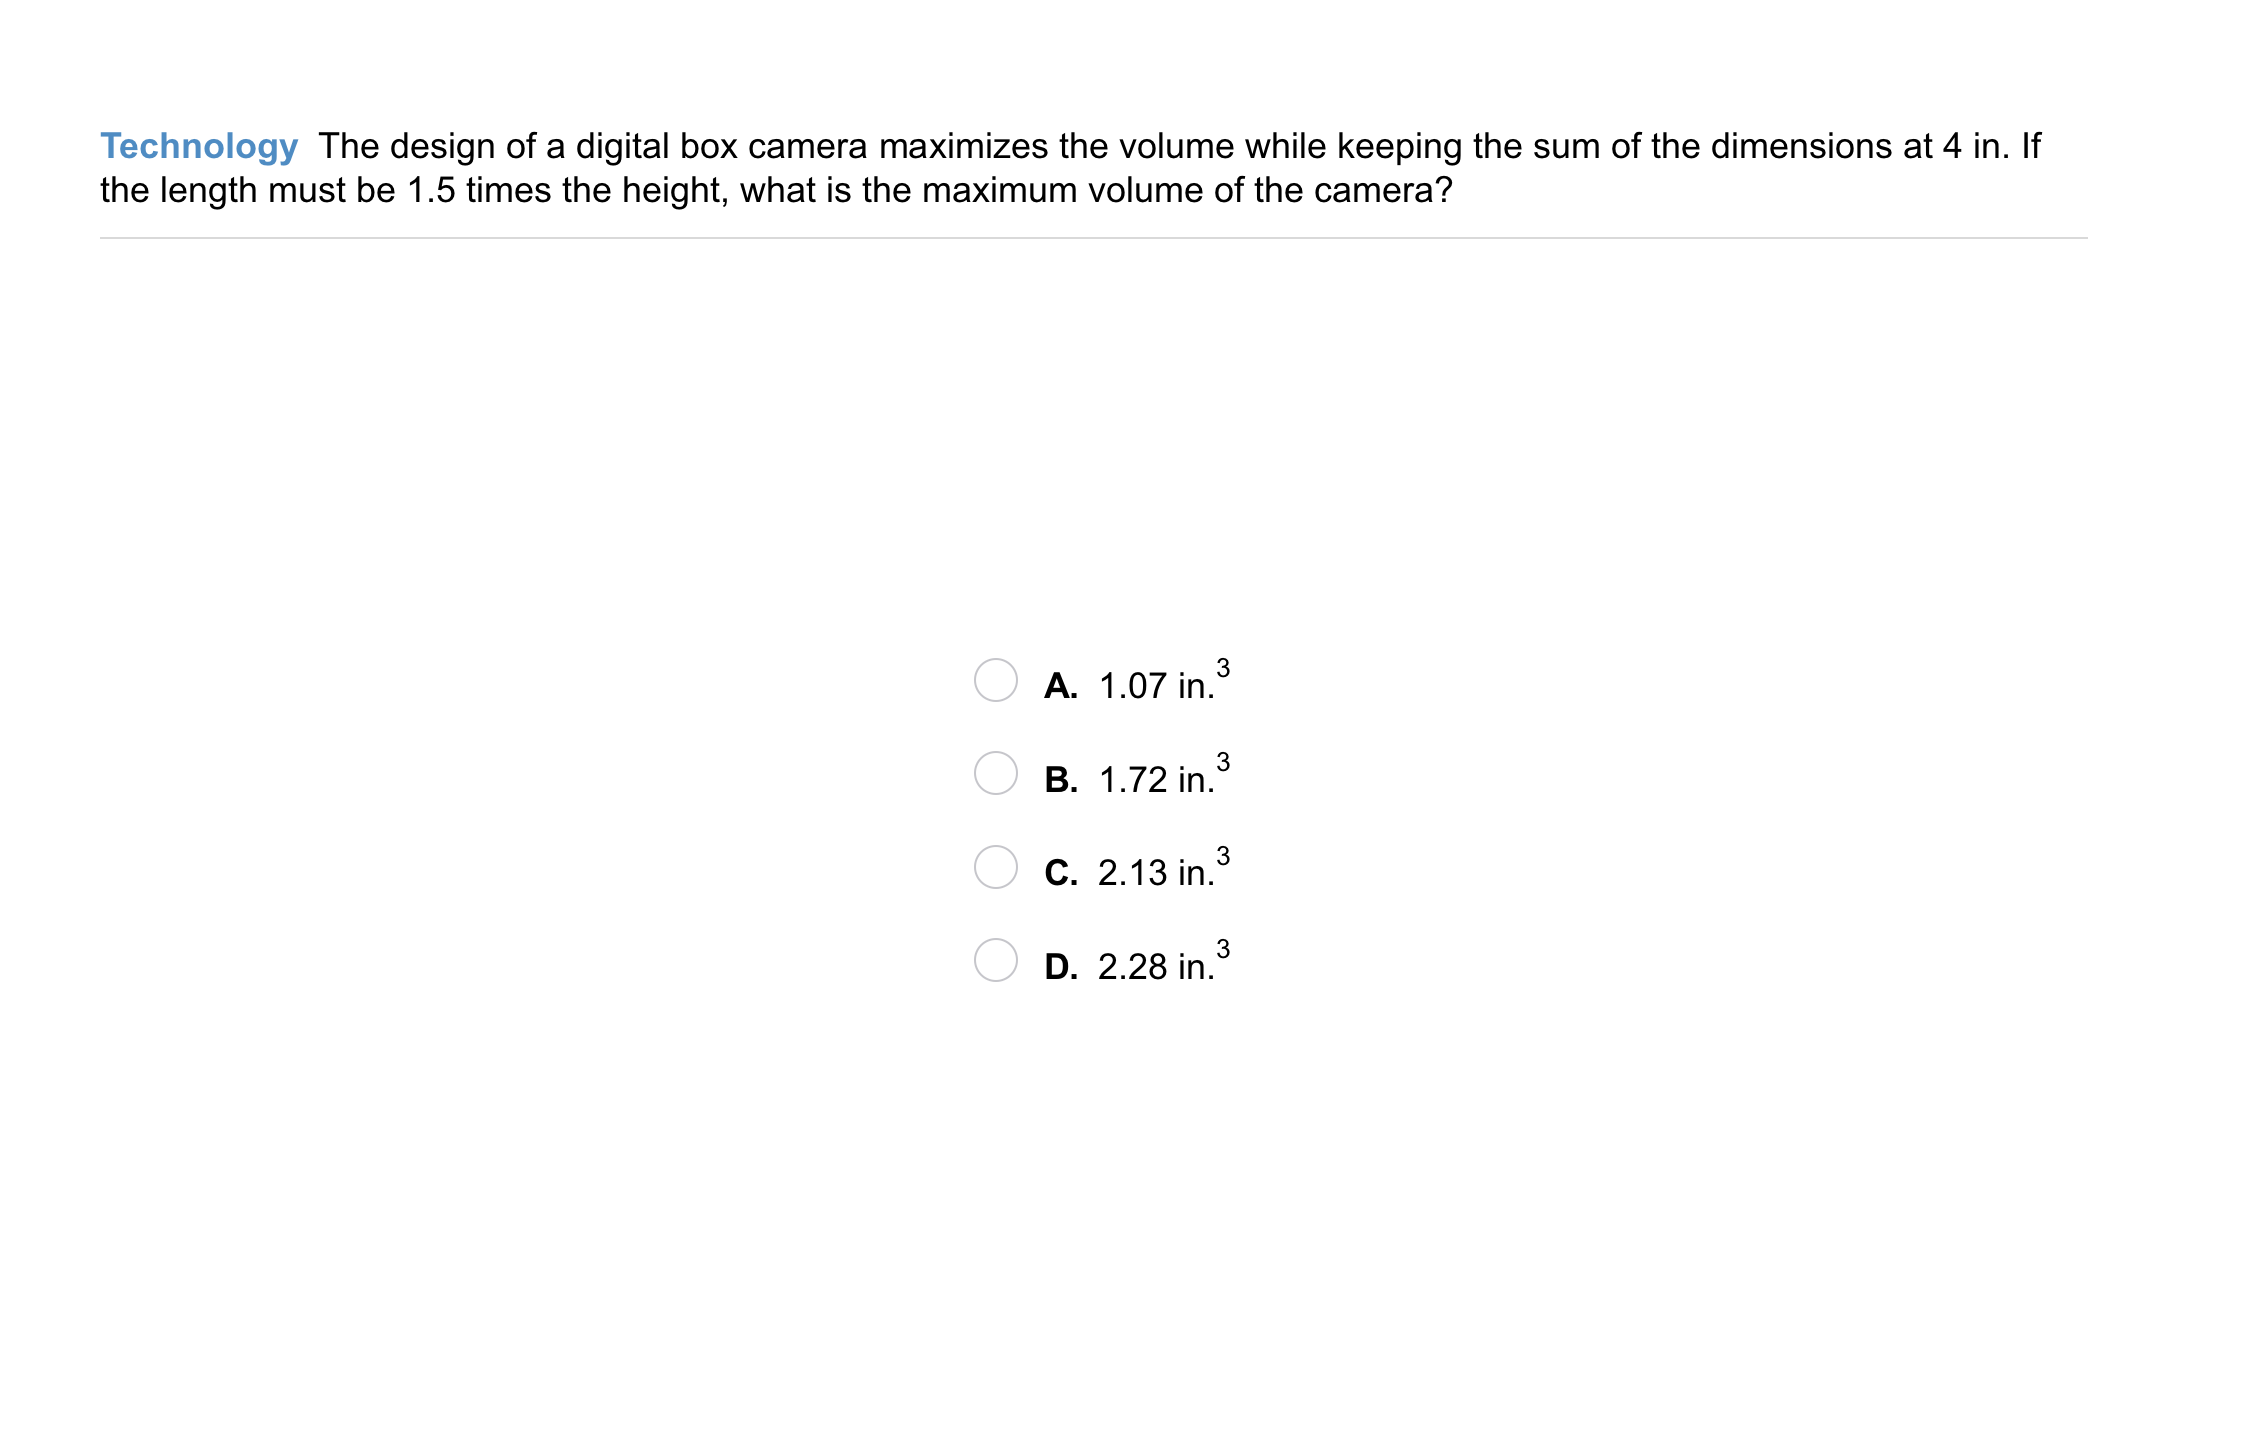
Problem 6 Got It? Technology: The design of a digital box camera maximizes the volume while keeping the sum of the dimensions at 4 in. If the length must be 1.5 times the height, what is the maximum volume of the camera?

🧠 Retrieval Practice:
Summarize the mathematical content of this lesson. What topics, ideas, and vocabulary were introduced?
Take Note: Plot the point (2,5). Then, sketch the graph of a polynomial with a relative maximum at (2, 5).
Take Note:
Graph the function at desmos.com.
Zoom and pan your graph to establish an appropriate viewing window.
Click on the relative maximum and relative minimum to label them.
Take a screenshot of your graph and upload or paste it to the canvas.
Take Note: To the nearest hundredth, what is the y-coordinate of the local maximum of f(x)?
Enter only a number.