Algebra 2 8-3 Independent Practice: Rational Functions and Their Graphs
star
star
star
star
star
Posljednje ažuriranje over 3 years ago
14


20
A.APR.3
20
A.APR.3

10
A.APR.3

Graphing:
Without the aid of a graphing utility, sketch a graph of the equation on the canvas below using the blue ink tool.
Graph the equation using the Desmos graphing calculator.
Sketch a copy of the Desmos graph on the canvas below using the orange ink tool.
Consider any discrepancies between the graphs.
Be sure to include relevant graph detail: label axes, indicate units on both axes, and use arrows to represent end behavior, as appropriate.
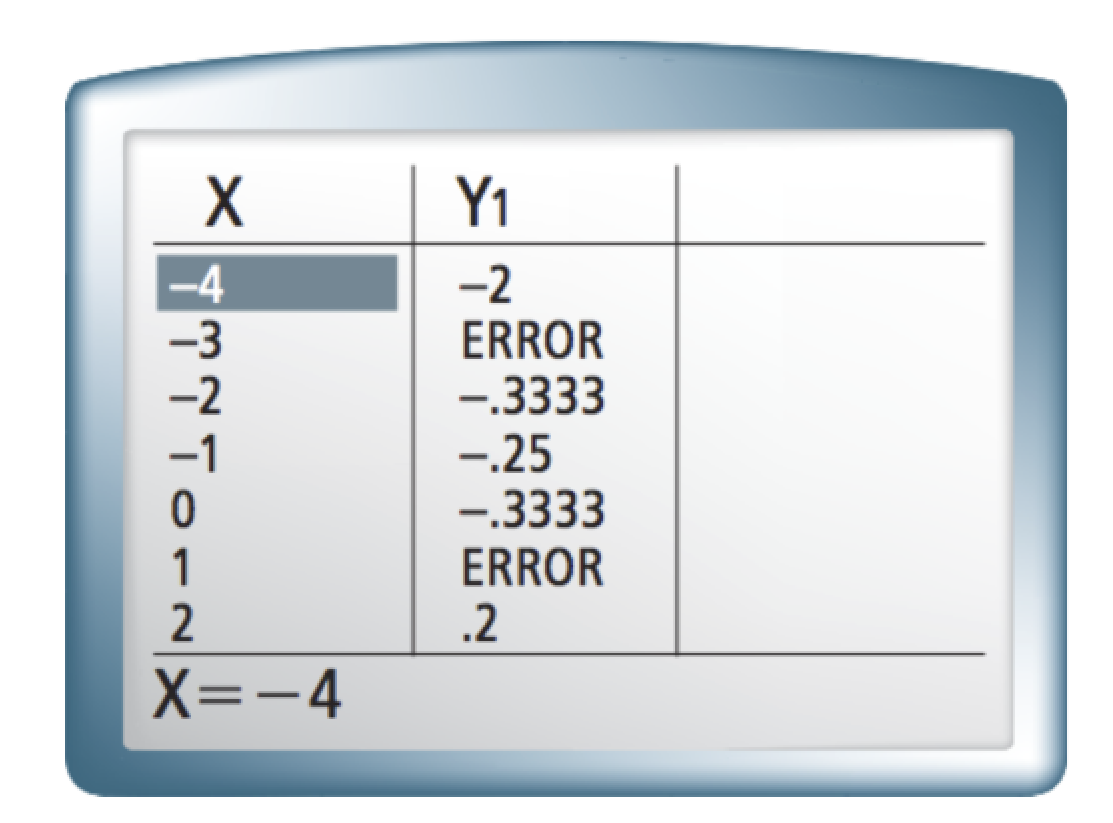
Reasoning: Assume that there are no more ERROR values in the 1 column. What is the lowest possible degree of the denominator?
Reflection: Math Success