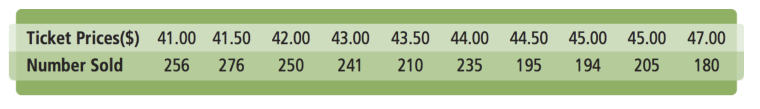
Review Lesson 2-5: A musician's manager keeps track of the ticket prices and the attendance at recent performances in the table above.
Step 1. Use the embedded Desmos graphing utility above or visit desmos.com to create a scatterplot and to calculate and graph the line of best fit for the given data.
Step 2. Take a screenshot of your scatterplot and line of best fit.
Step 3. Upload your screenshot to the canvas below.
If you need a reminder of how to complete Step 1, review this video from the Desmos team and/or see Problem 3 from the Lesson 2-5 slideshow.