Mic8: Changes in supply and demand
star
star
star
star
star
Last updated over 6 years ago
5 Nsɛmmisa

1
1

1

1
1
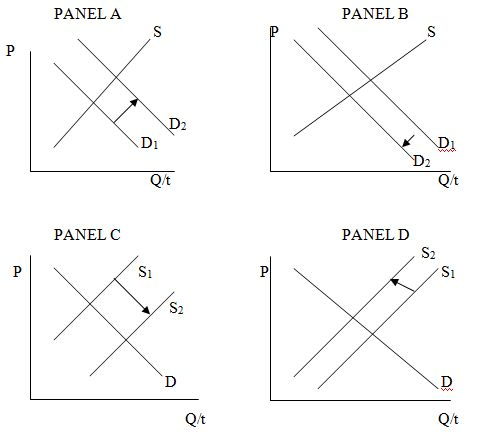
Which graph above is depicting a decrease in demand?
Which graph above is depicting an increase in supply?
When supply decreases what happens to equilibrium price and quantity?
When demand increases what happens to equilibirum price and quantity?
Using graph 8 above when supply and demand both increase, what happens to equilibrium price and quantity?