Math 7 CW: Review for Chapter 1 Test
star
star
star
star
star
Last updated over 6 years ago
20 Nsɛmmisa

Make sure to include your labels. For example: 10 pairs of shoes.
Make sure to include your labels. For example: 10 pairs of shoes.
Make sure to include your labels. For example: 10 pairs of shoes.
Make sure to include your labels. For example: 10 pairs of shoes.
Make sure to include your labels. For example: 10 pairs of shoes.
Make sure to include your labels. For example: 10 pairs of shoes.
Make sure to include your labels. For example: 10 pairs of shoes.
Make sure to include your labels. For example: 10 pairs of shoes.
Make sure to include your labels. For example: 10 pairs of shoes.
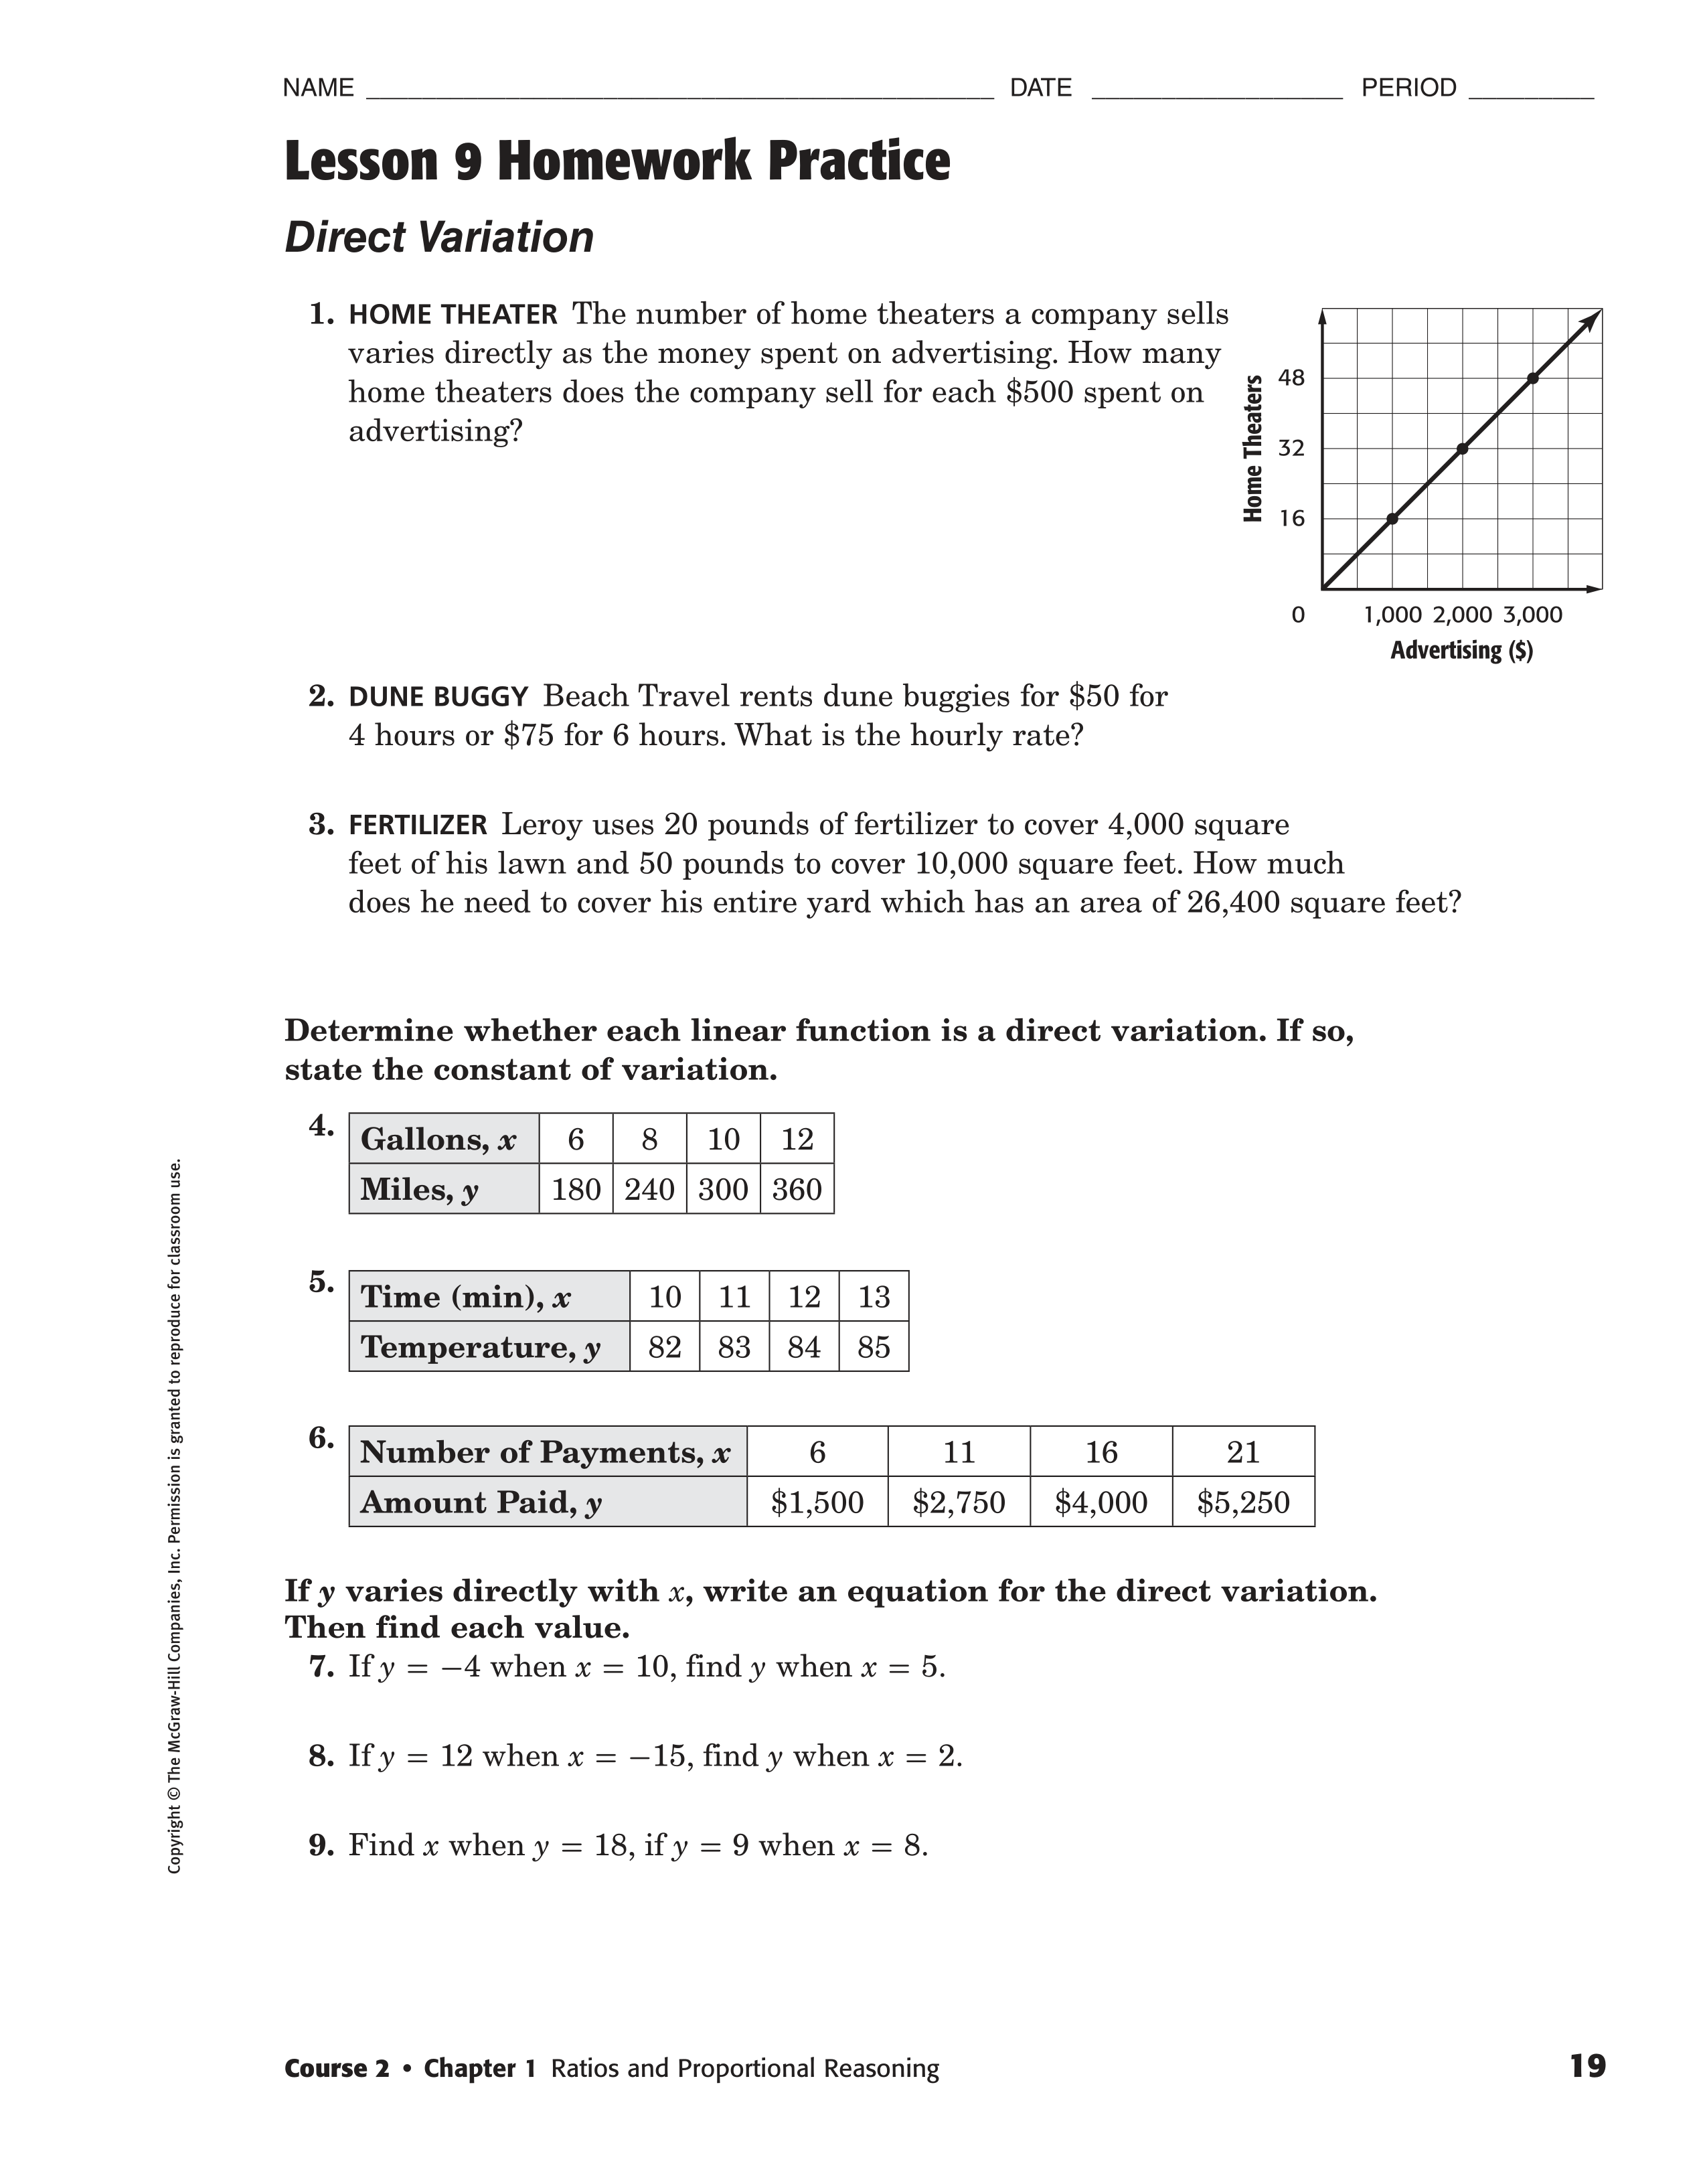
Write the equation/rule for this graph. Hint: Find the unit rate first.
Make sure to include your labels. For example: 10 pairs of shoes.
Write the equation/rule for this graph.
Make sure to include your labels. For example: 10 pairs of shoes.
Write the equation/rule for this graph. Hint: Find the unit rate first.
Write your answer in this format:
If it is no, just type no.
If it is yes, type yes and then the constant of variation. For example, yes; 2
Write the equation/rule for this graph. Hint: Find the unit rate first.
Write your answer in this format:
If it is no, just type no.
If it is yes, type yes and then the constant of variation. For example, yes; 2
Write the equation/rule for this graph. Hint: Extend your graph so that you find the temperature for 9 min, 8 min, 7 min, all the way down to 0 minutes. Use your unit rate or rate of change to help you write your rule as well. Look at your notes to help.
Write your answer in this format:
If it is no, just type no.
If it is yes, type yes and then the constant of variation. For example, yes; 2
Write the equation/rule for this graph. Use your unit rate to help.