Grade 6, Module 1, Topic B, Ratio Tables & Coordinate Plane
star
star
star
star
star
Posljednje ažuriranje over 6 years ago
8
Napomena autora:
Eureka Engage NY Grade 6 Module 1 adapted assessments
1
1
1
1
1
1
1
1
Eureka Engage NY Grade 6 Module 1 adapted assessments
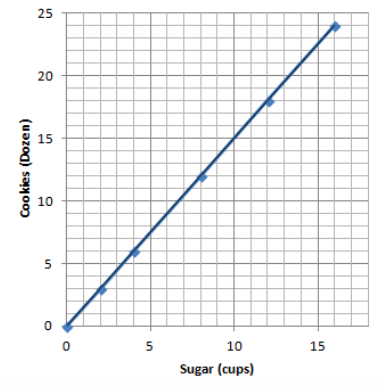
Use the graph above to the complete the table below.

a = _______
b = _______
c = _______
Look at the graph above. If you have 14 cups of sugar, how many dozen cookies can you make?
______ dozen cookies
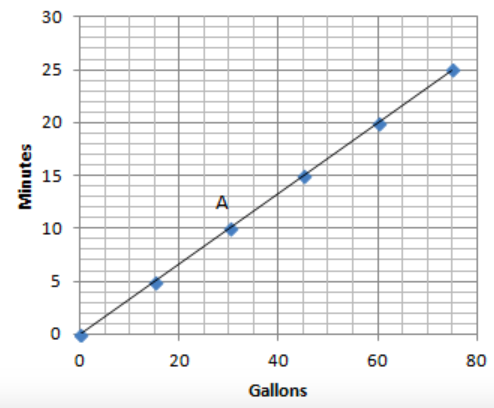
Look at the graph. If you have 13 minutes, about how many gallons do you need?
_______ gallons
Look at the graph. If you have 60 gallons, how many minutes can you travel?
_______ minutes
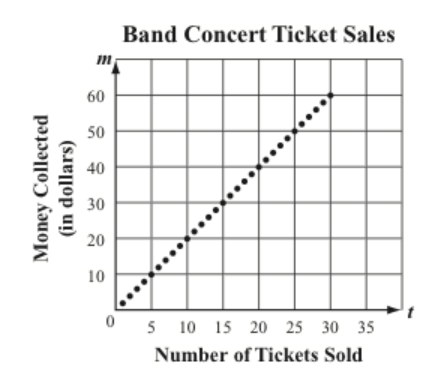
Select all the points below that belong on this graph.
Select all the true statements below: