RETAKE - Unit 4: Great Oxygenation Event cloned 2/7/2020 cloned 2/7/2020
star
star
star
star
star
Posljednje ažuriranje over 6 years ago
14

1
1
1
1
1
1
1
1
1
1
1
1
1
1
Using graph 1: The X-axis shows time in millions of years ago with the oldest time on the _________and more current time on the _________. (Separate your answers with a comma).
Using graph 1: The y-axis shows….
Using graph 1: Giant flying insects arose (or peaked) when _____________ levels rose to _____ in the atmosphere. (Hint: reference the y-axis value; separate answers with a comma)
Graph #2 and Background Information
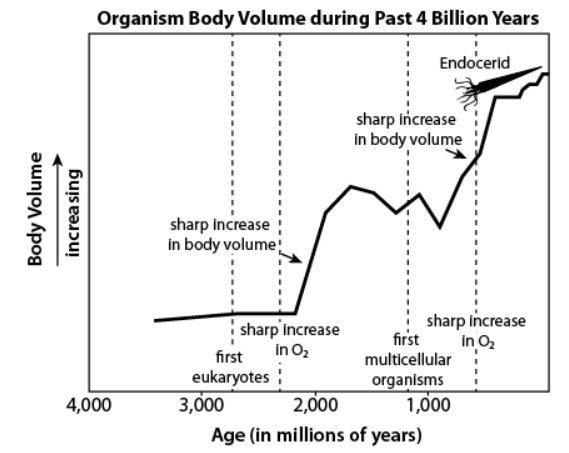
Roughly four billion years ago, Earth’s atmosphere had little to no free oxygen available to support livingorganisms. As ancient bacteria evolved, developing the ability to perform photosynthesis, oxygen levels in Earth’satmosphere gradually increased. The graph below shows a period of time during which two sharp increases inoxygen levels in the atmosphere occurred.
Scientists think that these relatively drastic increases in oxygen levels were the result of rapid increases inphotosynthetic populations of bacteria in oceans. As the graph shows, following both sharp increases in oxygenlevels, there were increases in the body volume (size) of organisms. Organisms use oxygen to perform cellularrespiration to produce energy needed for growth and reproduction. Scientists have concluded that the increase inoxygen available allowed for body sizes to increase, since oxygen was no longer limiting growth.
Using graph #2: Describe the trend of the line in relationship to body size
Using graph 2: The graph shows there have been ____ large increases in oxygen.
Using graph 2: The graph shows that immediately after or with each sharp increase in oxygen there is an increase in...
Using graph 2: The graph shows that the first multicellular organisms were ____________than the first eukaryotes.
Using graph 2: The graph shows that the first multicellular organisms were __________than the endocerids.
Using graph 2: The first eukaryotes arose _________________ million years ago.
Using graph 2: The endocerids arose ________ million years ago.
Using graph 2 background information: Oxygen levels rose in the atmosphere due to the increased amount of....
More oxygen in the atmosphere allows for increased _____________.
More oxygen allows for increased _____________ size and energy output.
Plants produce _______ during photosynthesis and organisms use _________ during cellular respiration.