11
Which of the following numbers is an irrational number?
Which of the following numbers is an irrational number?
MGSE8.NS.1
1
MGSE8.SP.4.a
Which of the following numbers is an irrational number?
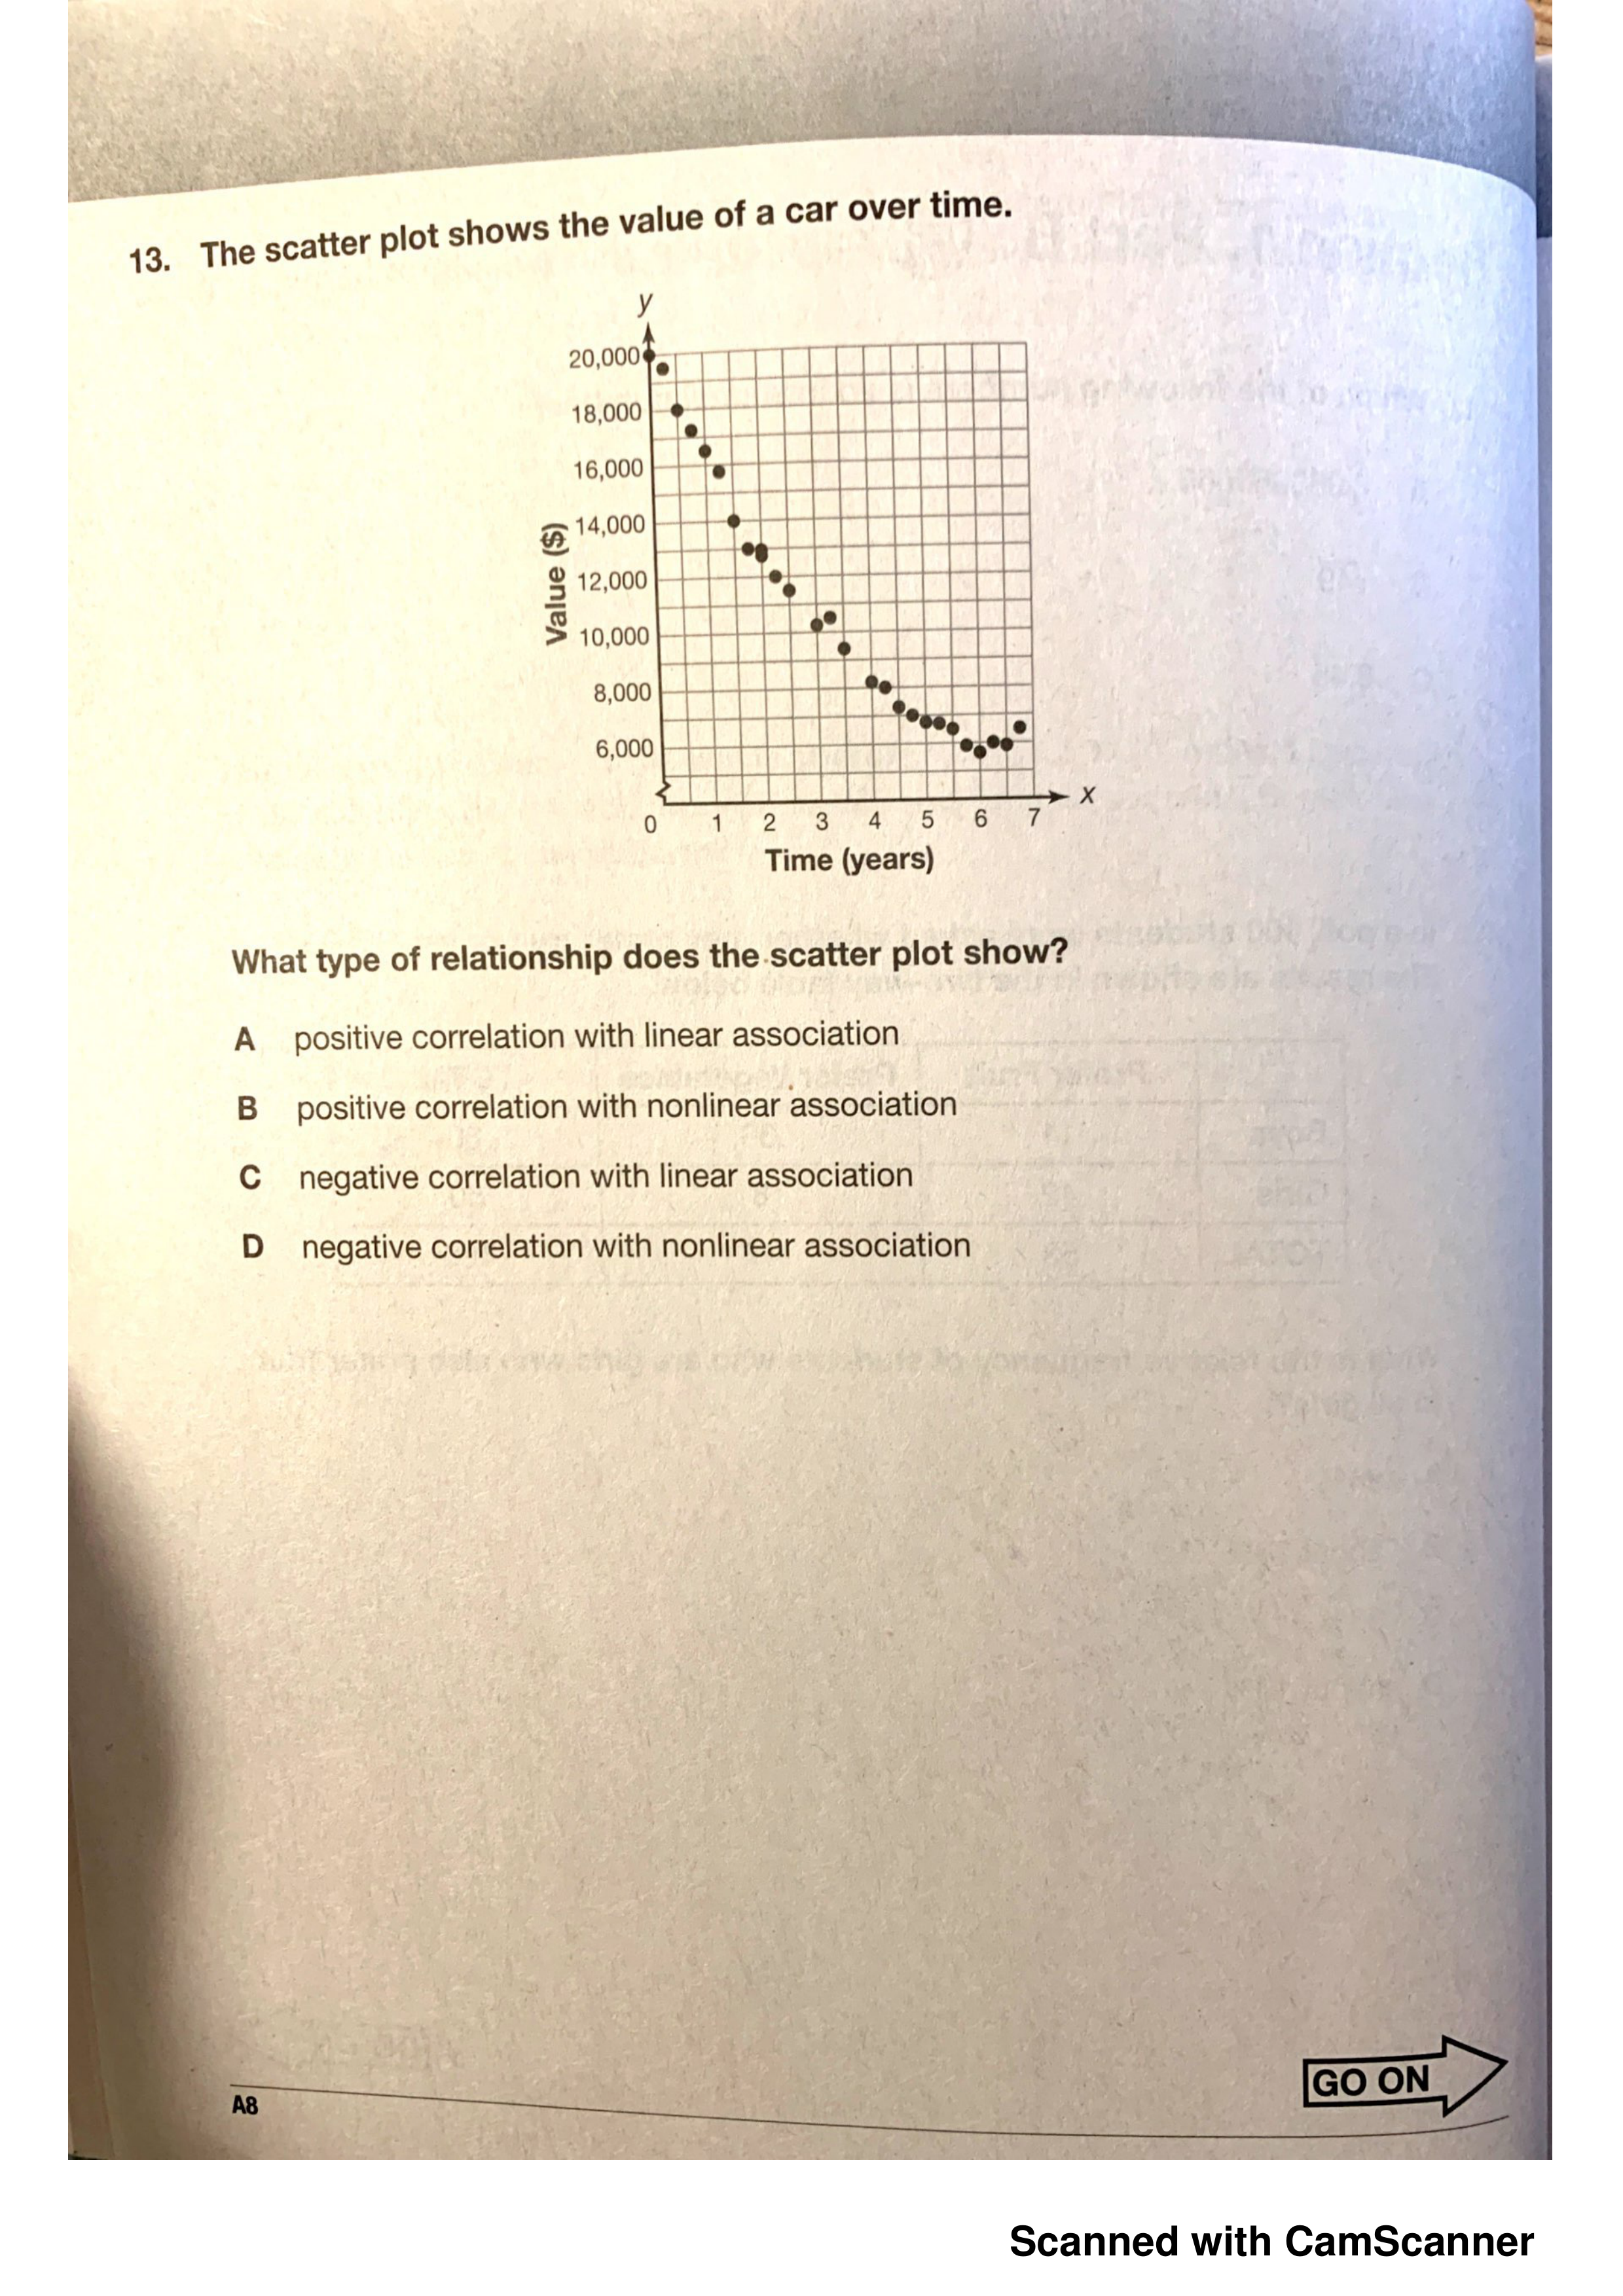
What type of relationship does the scatter plot show?
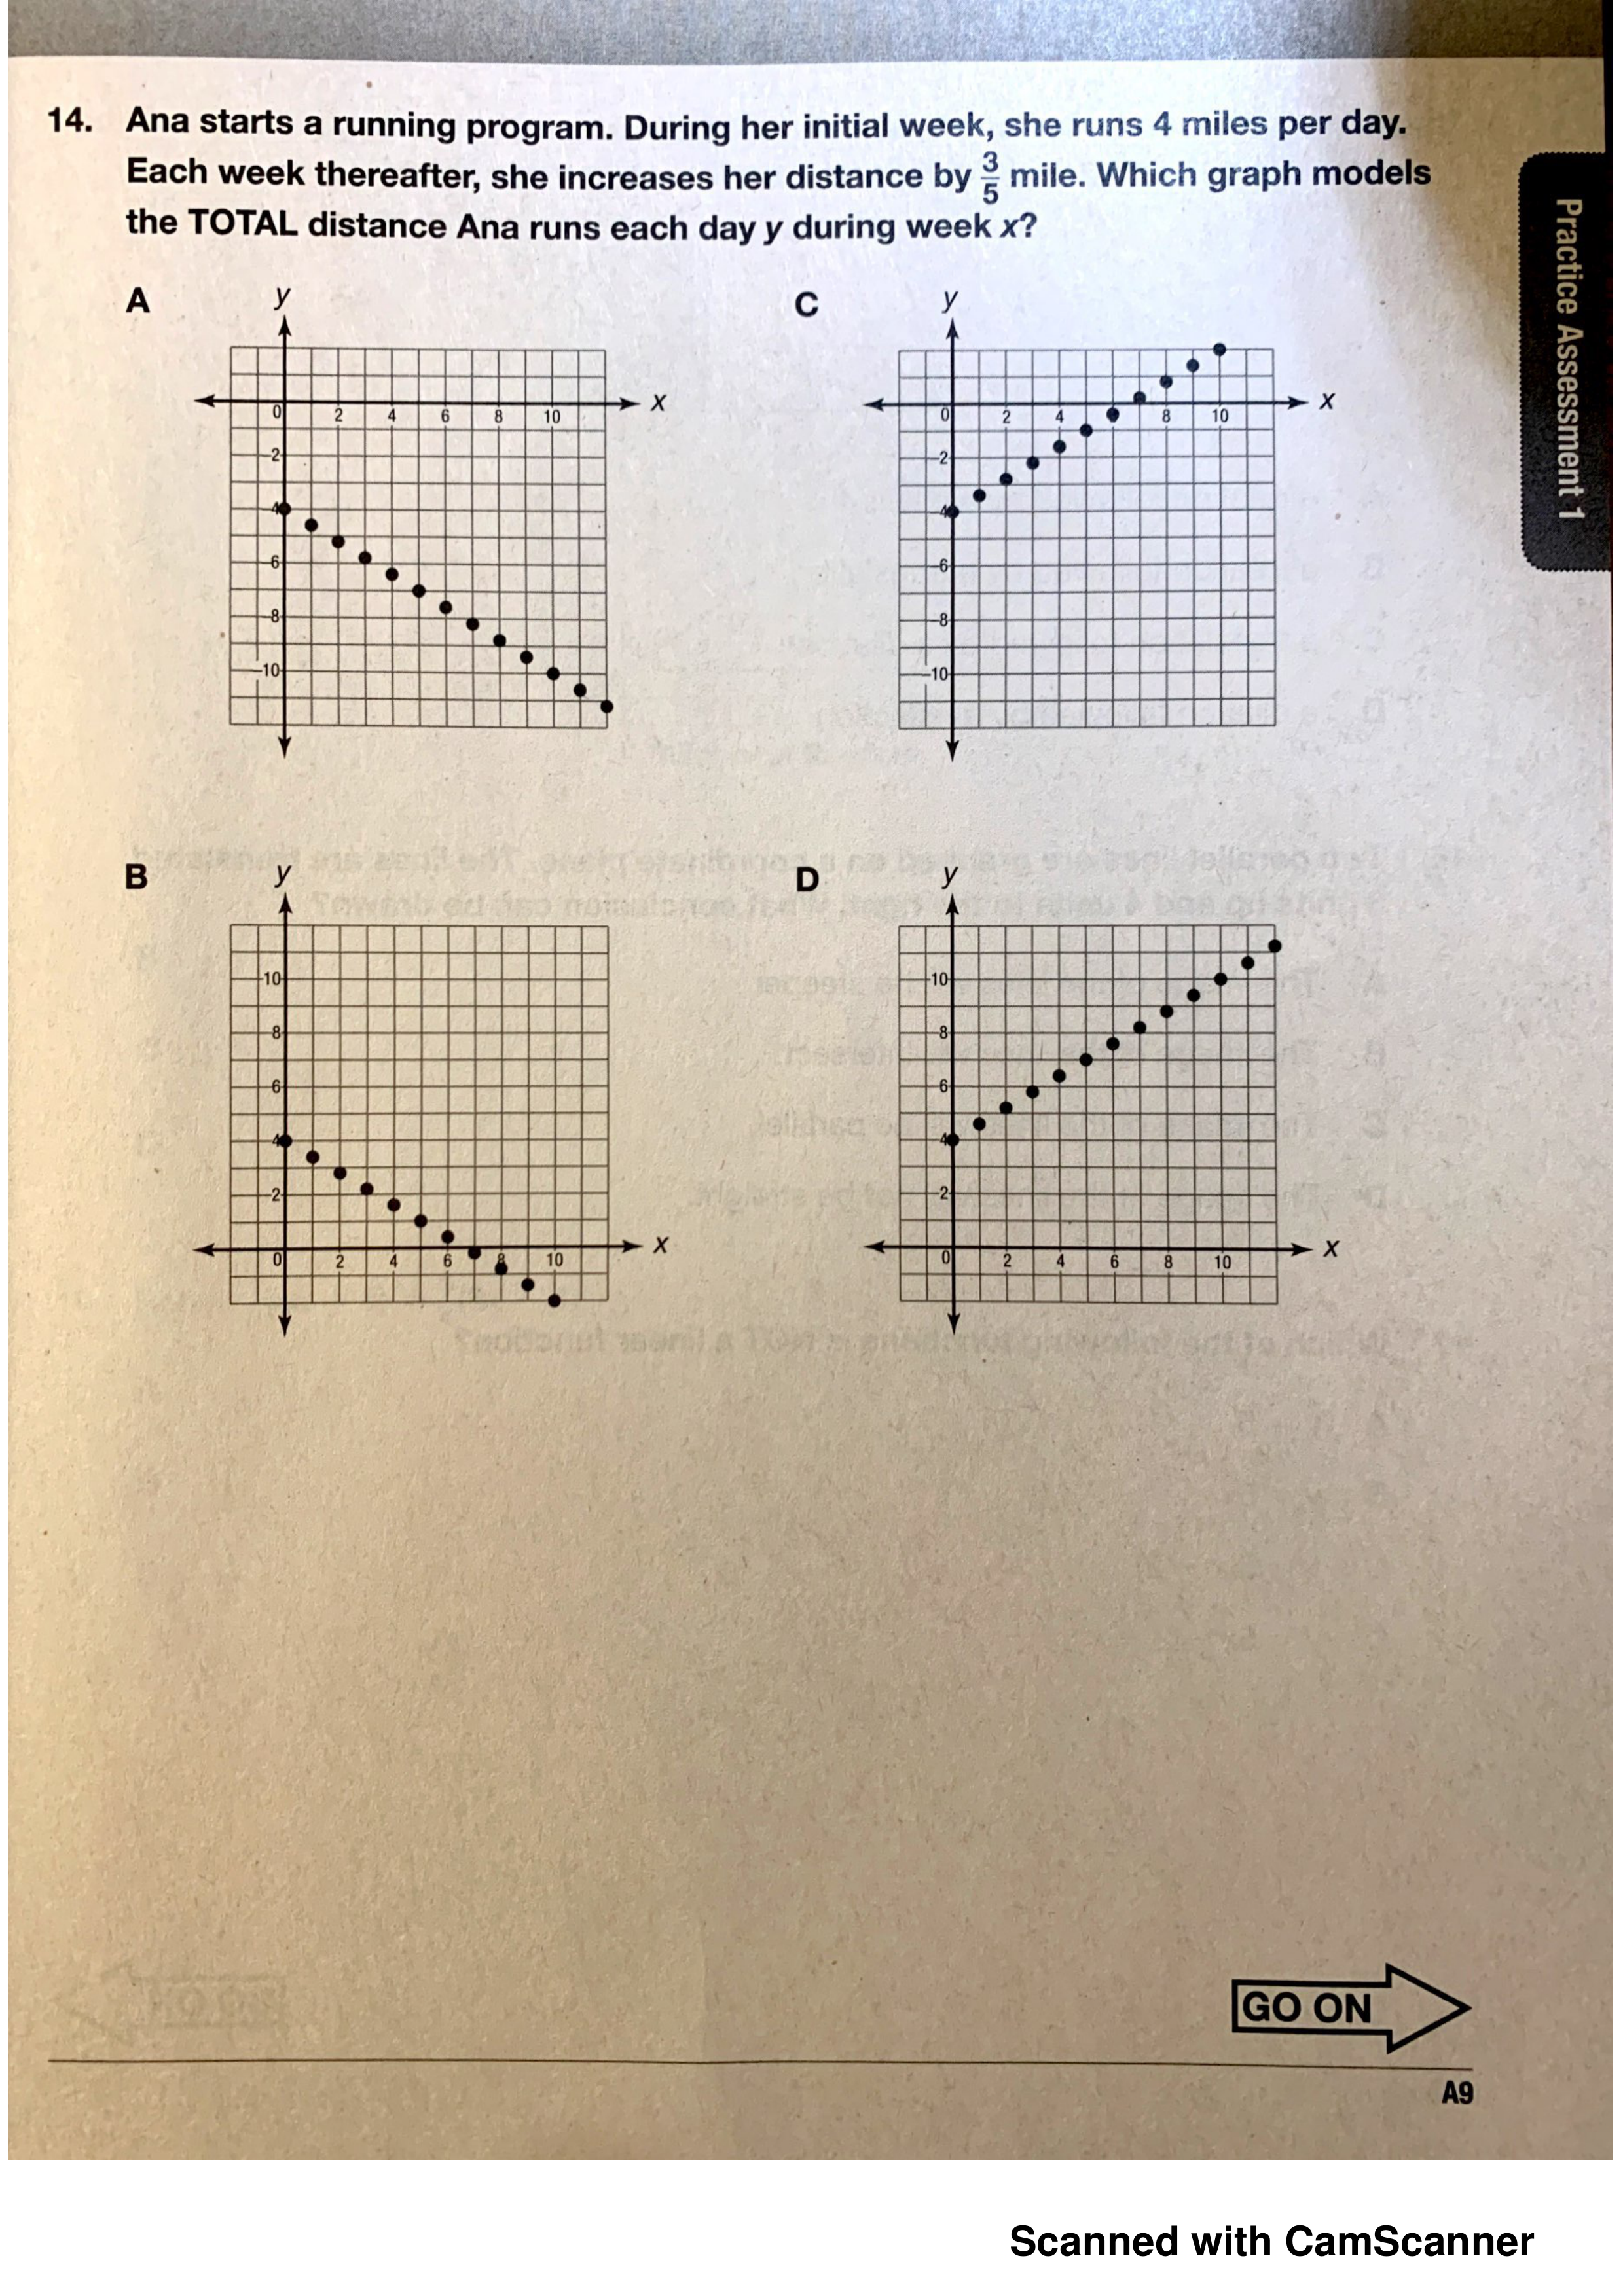
Which graph models the total distance Ana runs each day y during week x?
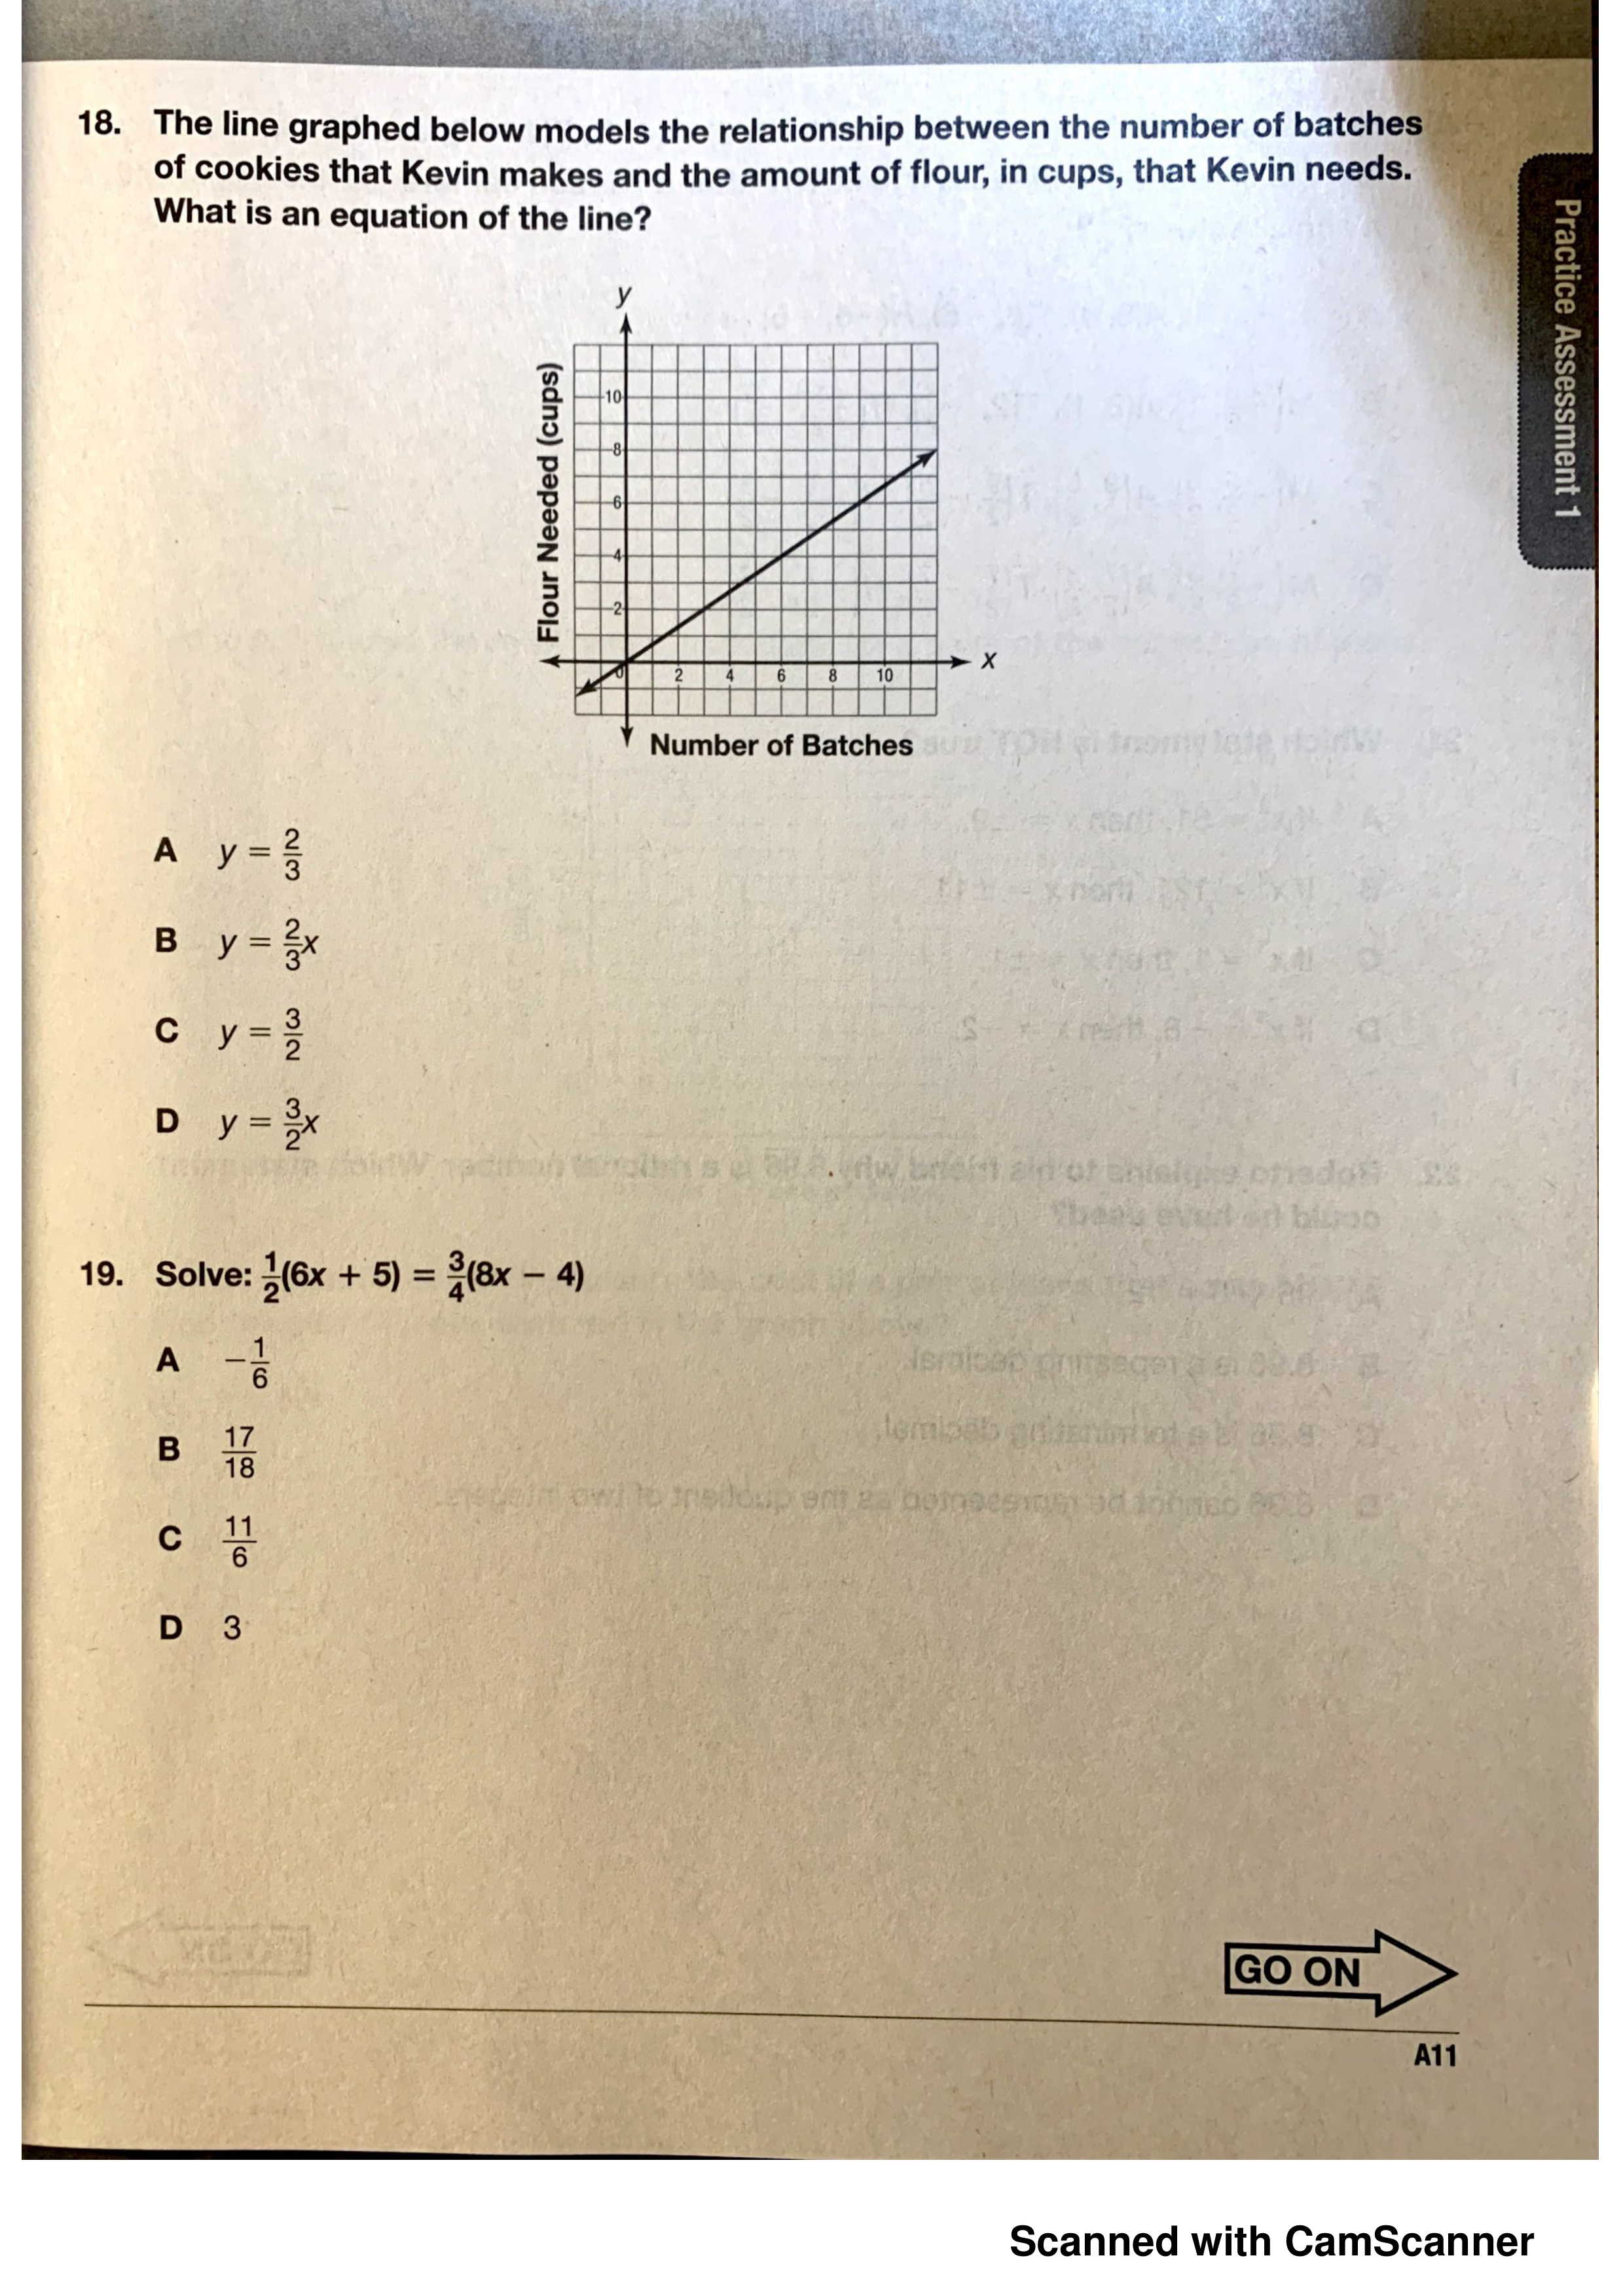
What is an equation of the line?
Solve.
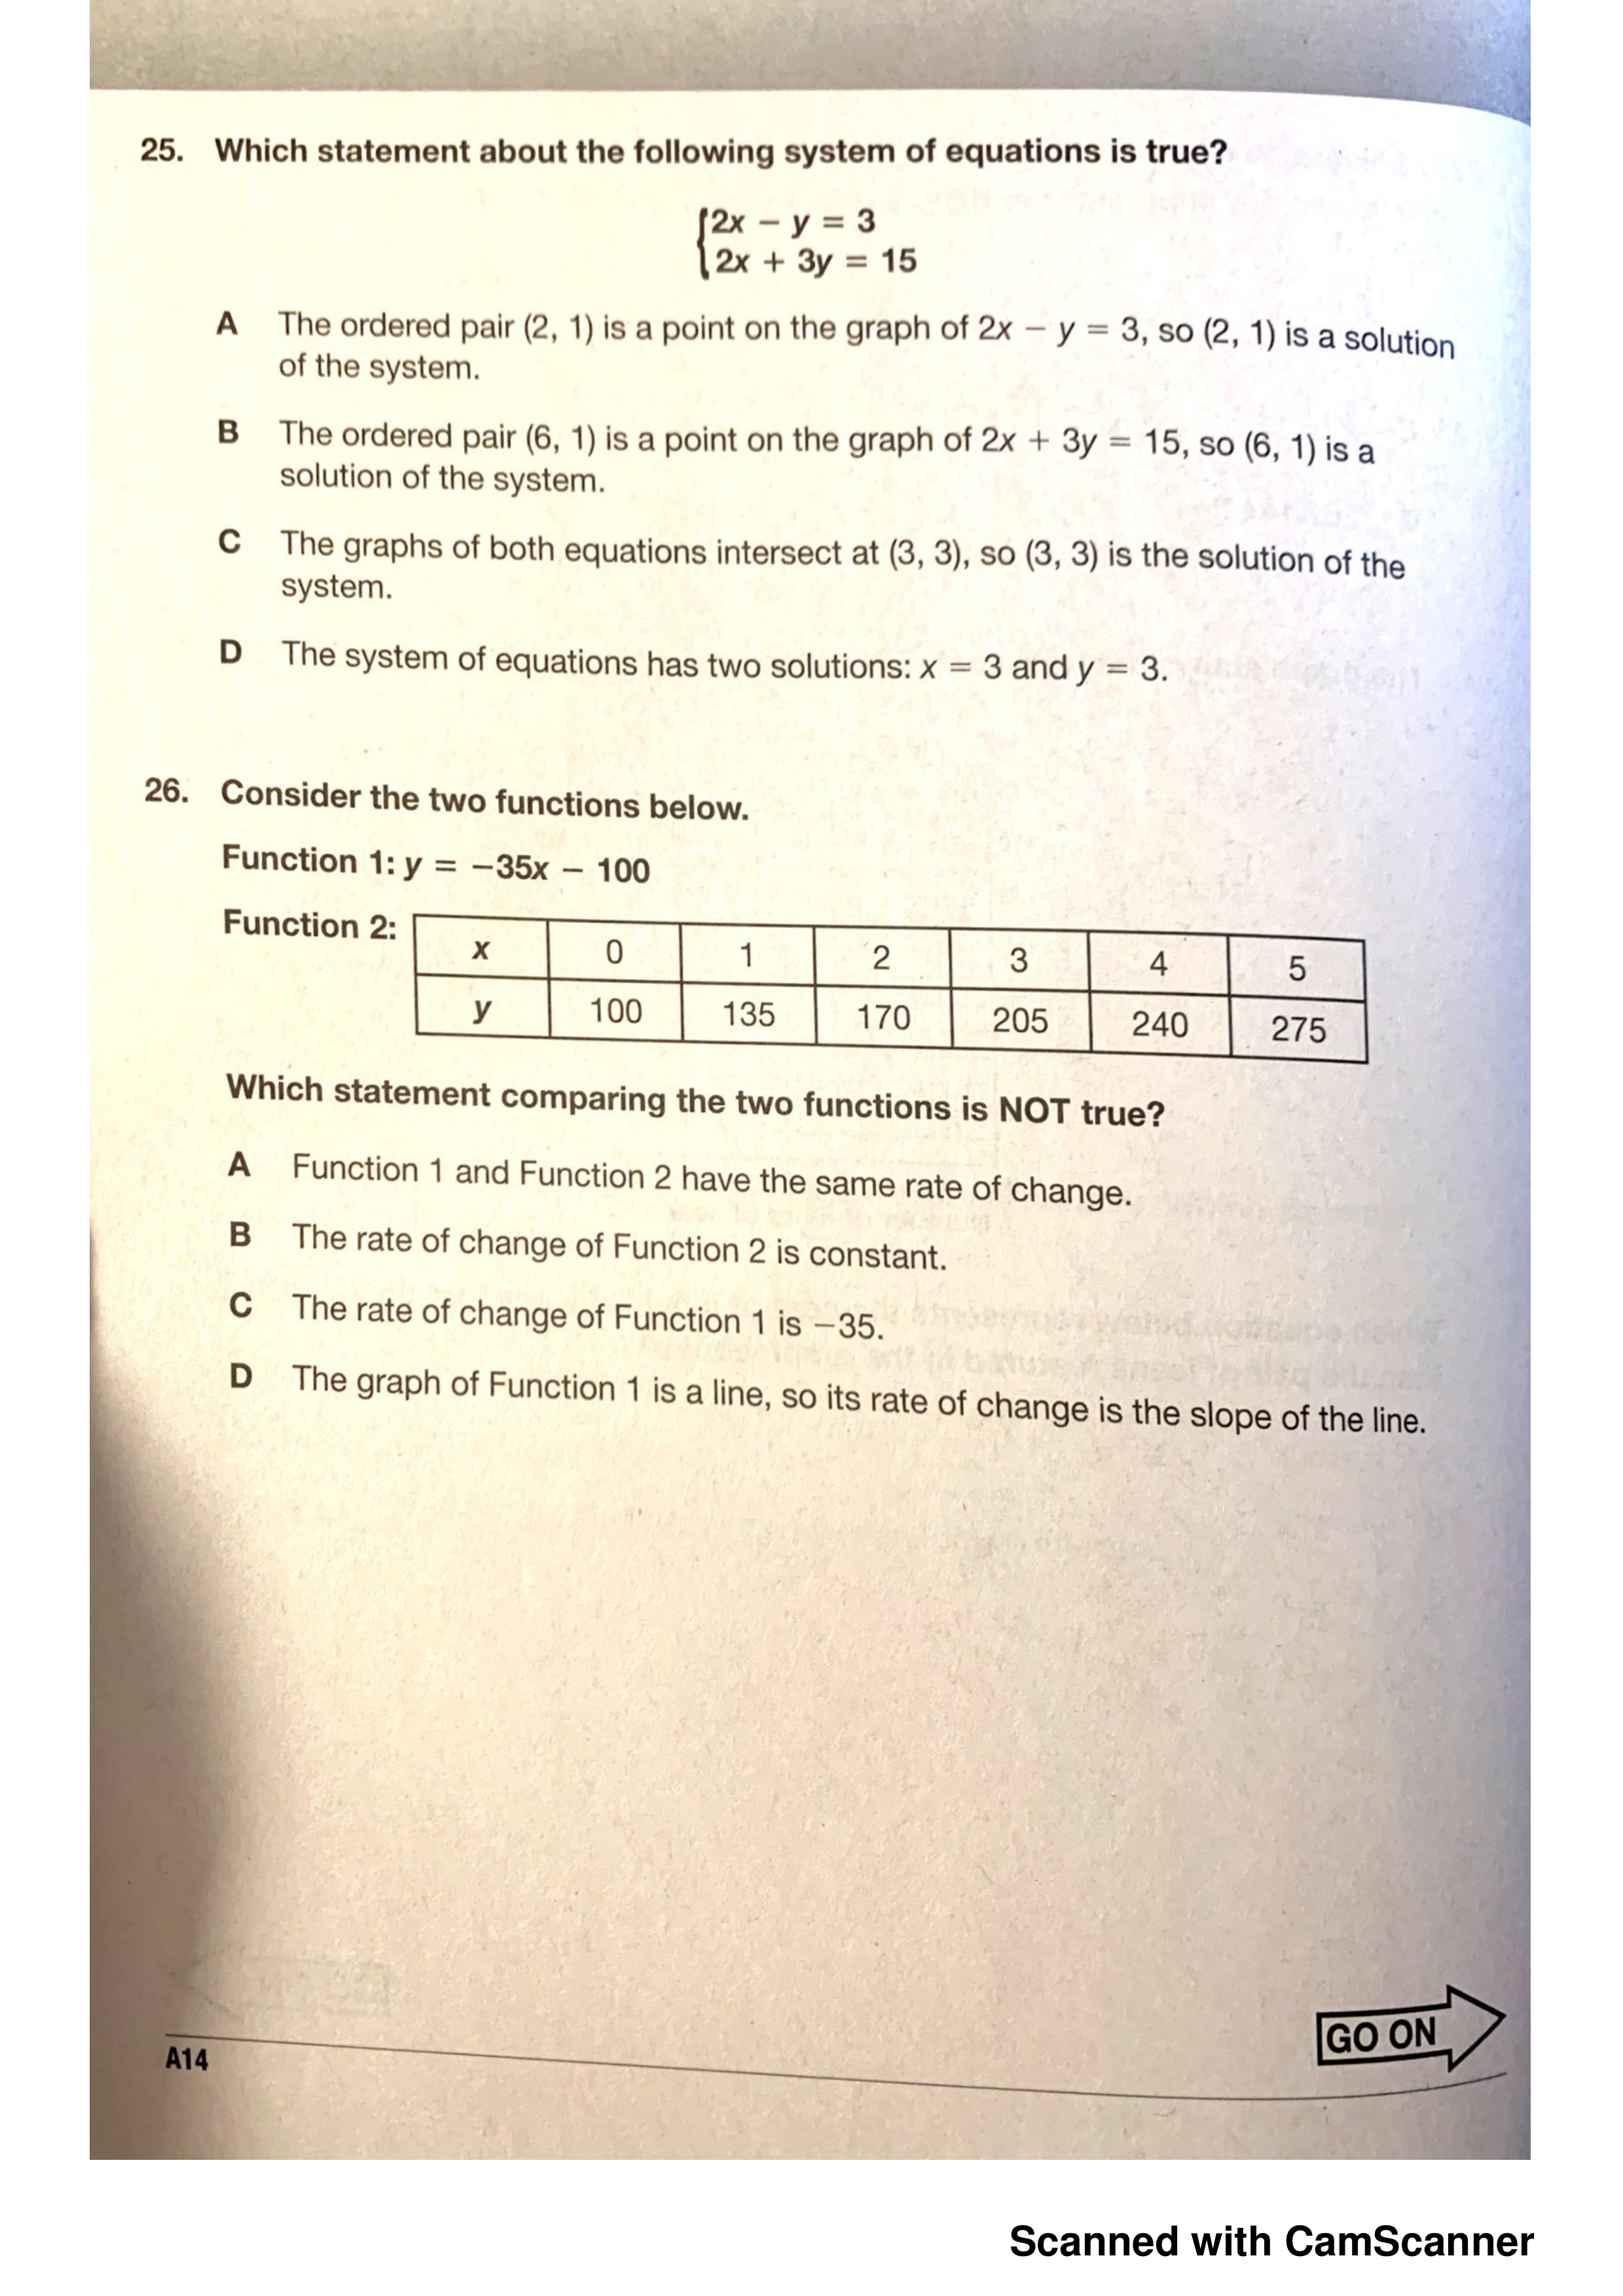
Which statement about the following system of equations is true?
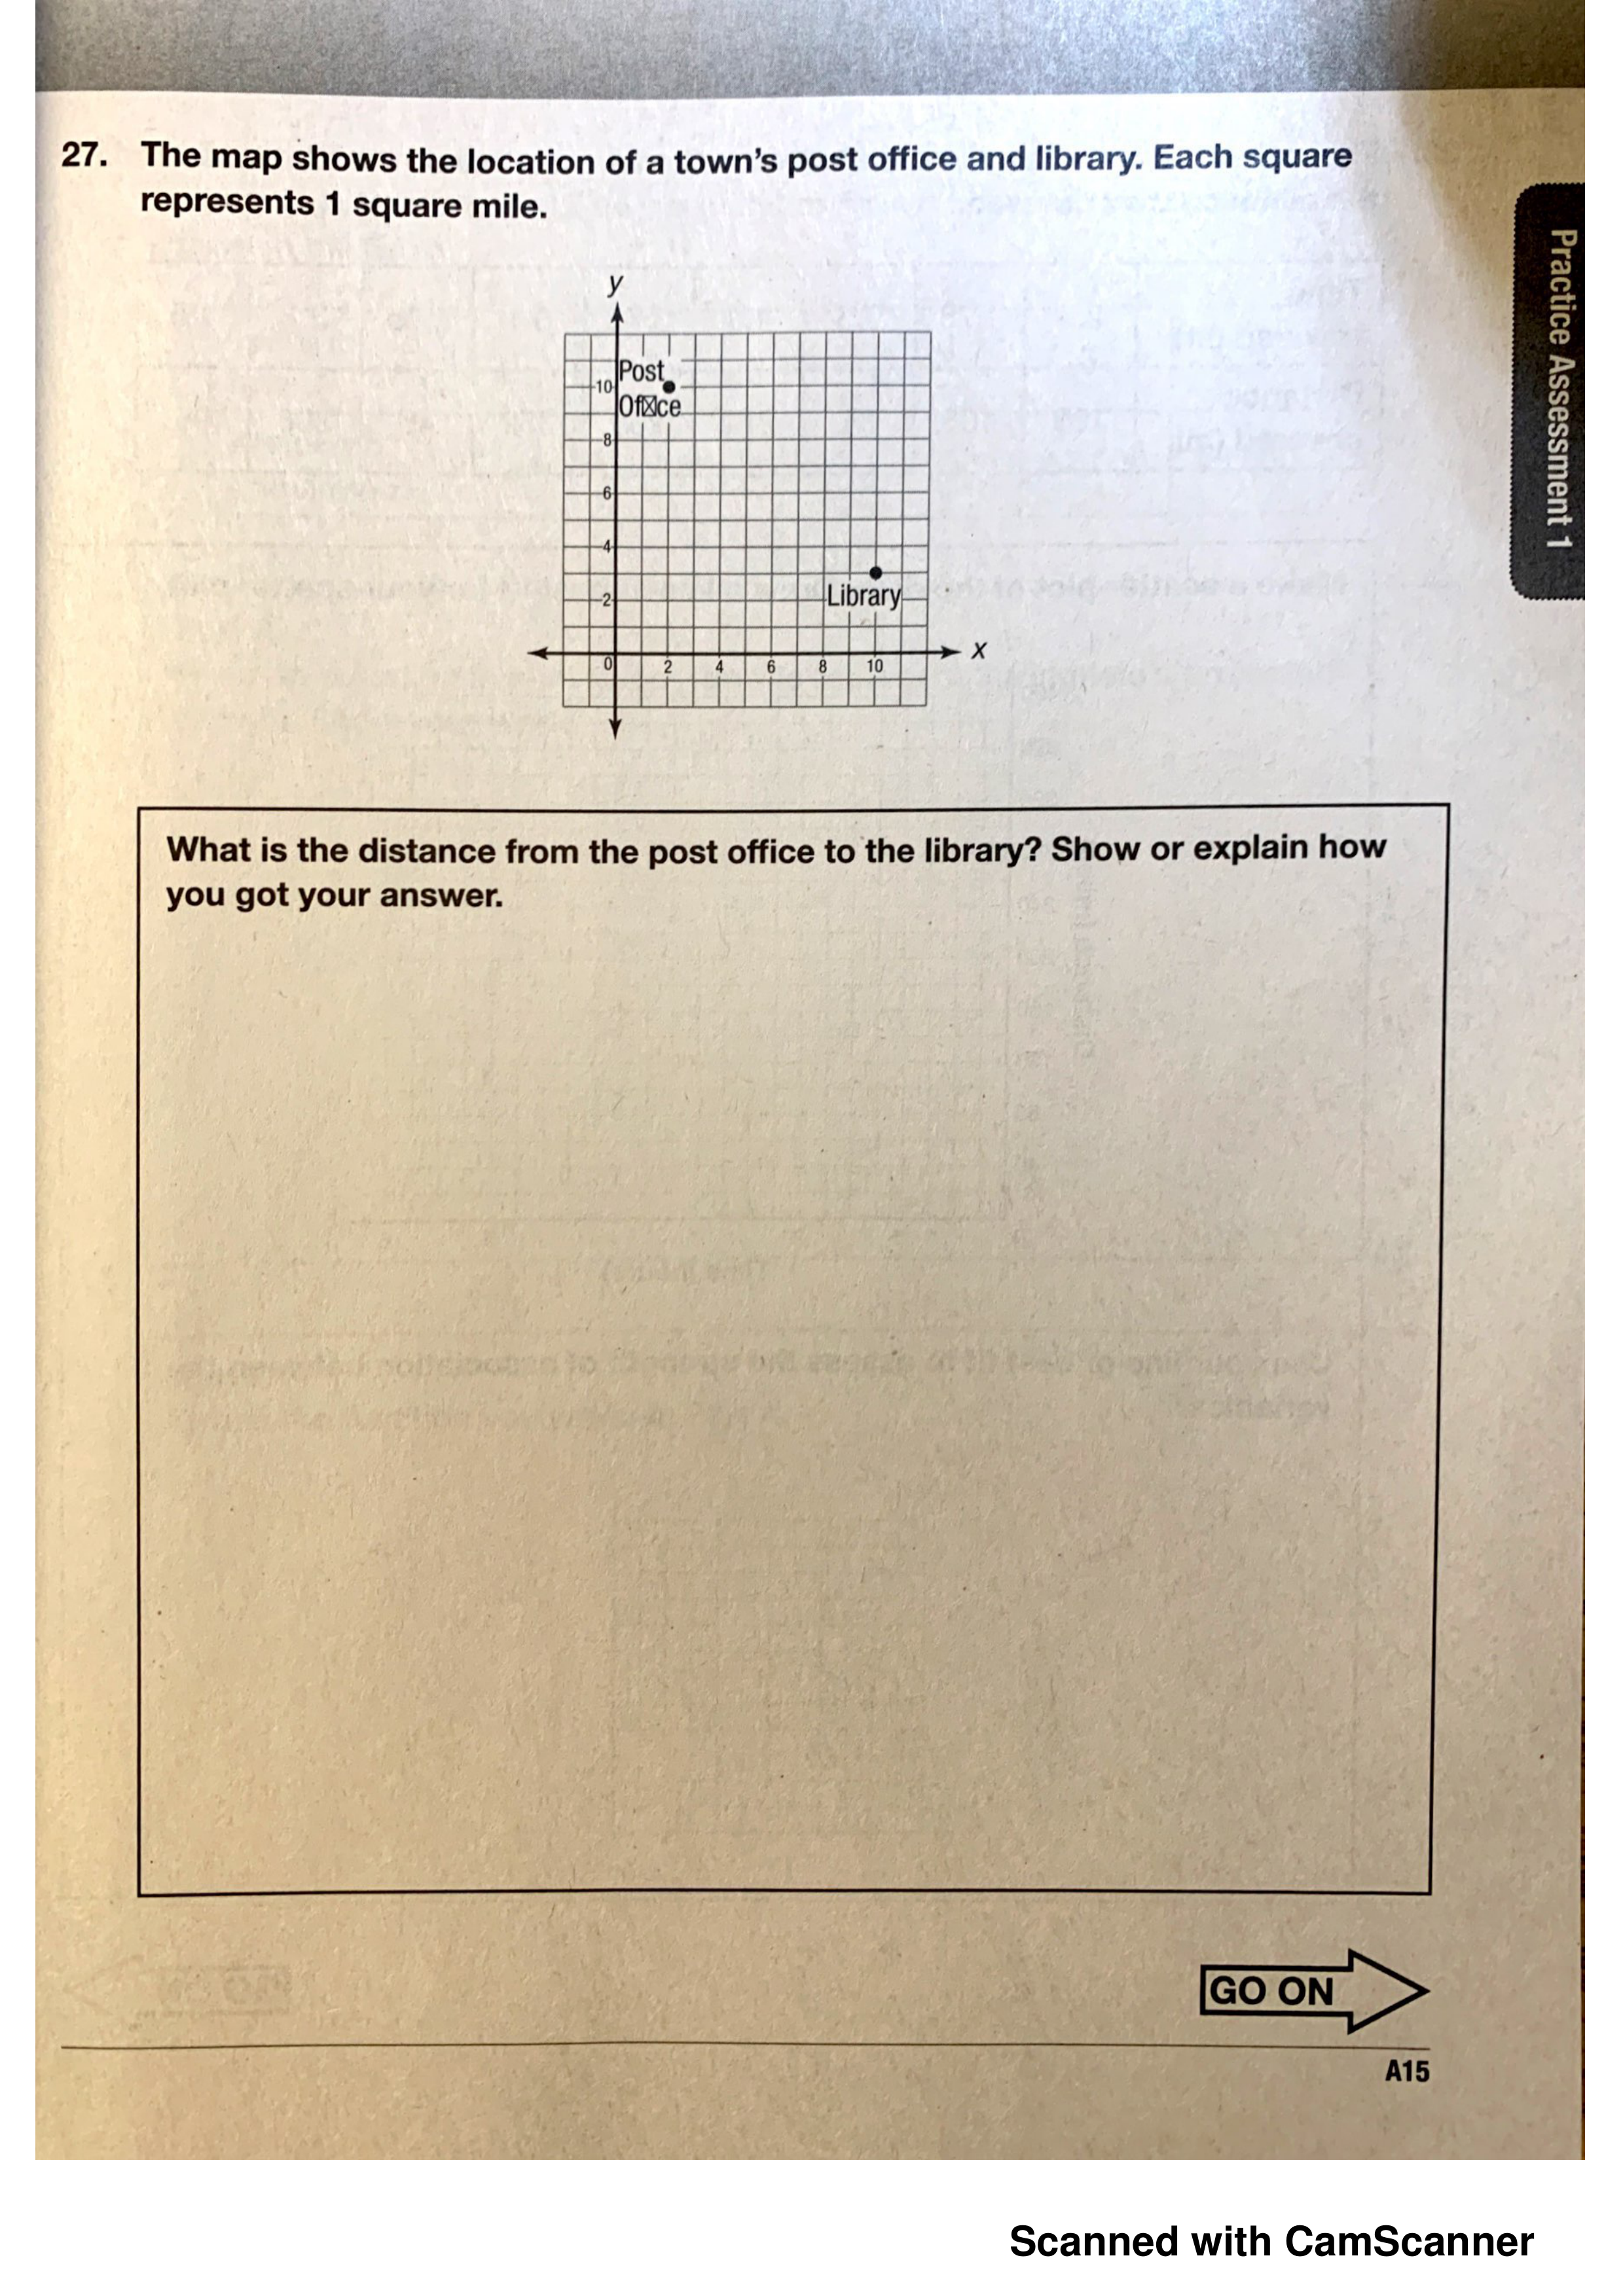
What is the distance from the post office to the library? Show or explain how you got your answer.
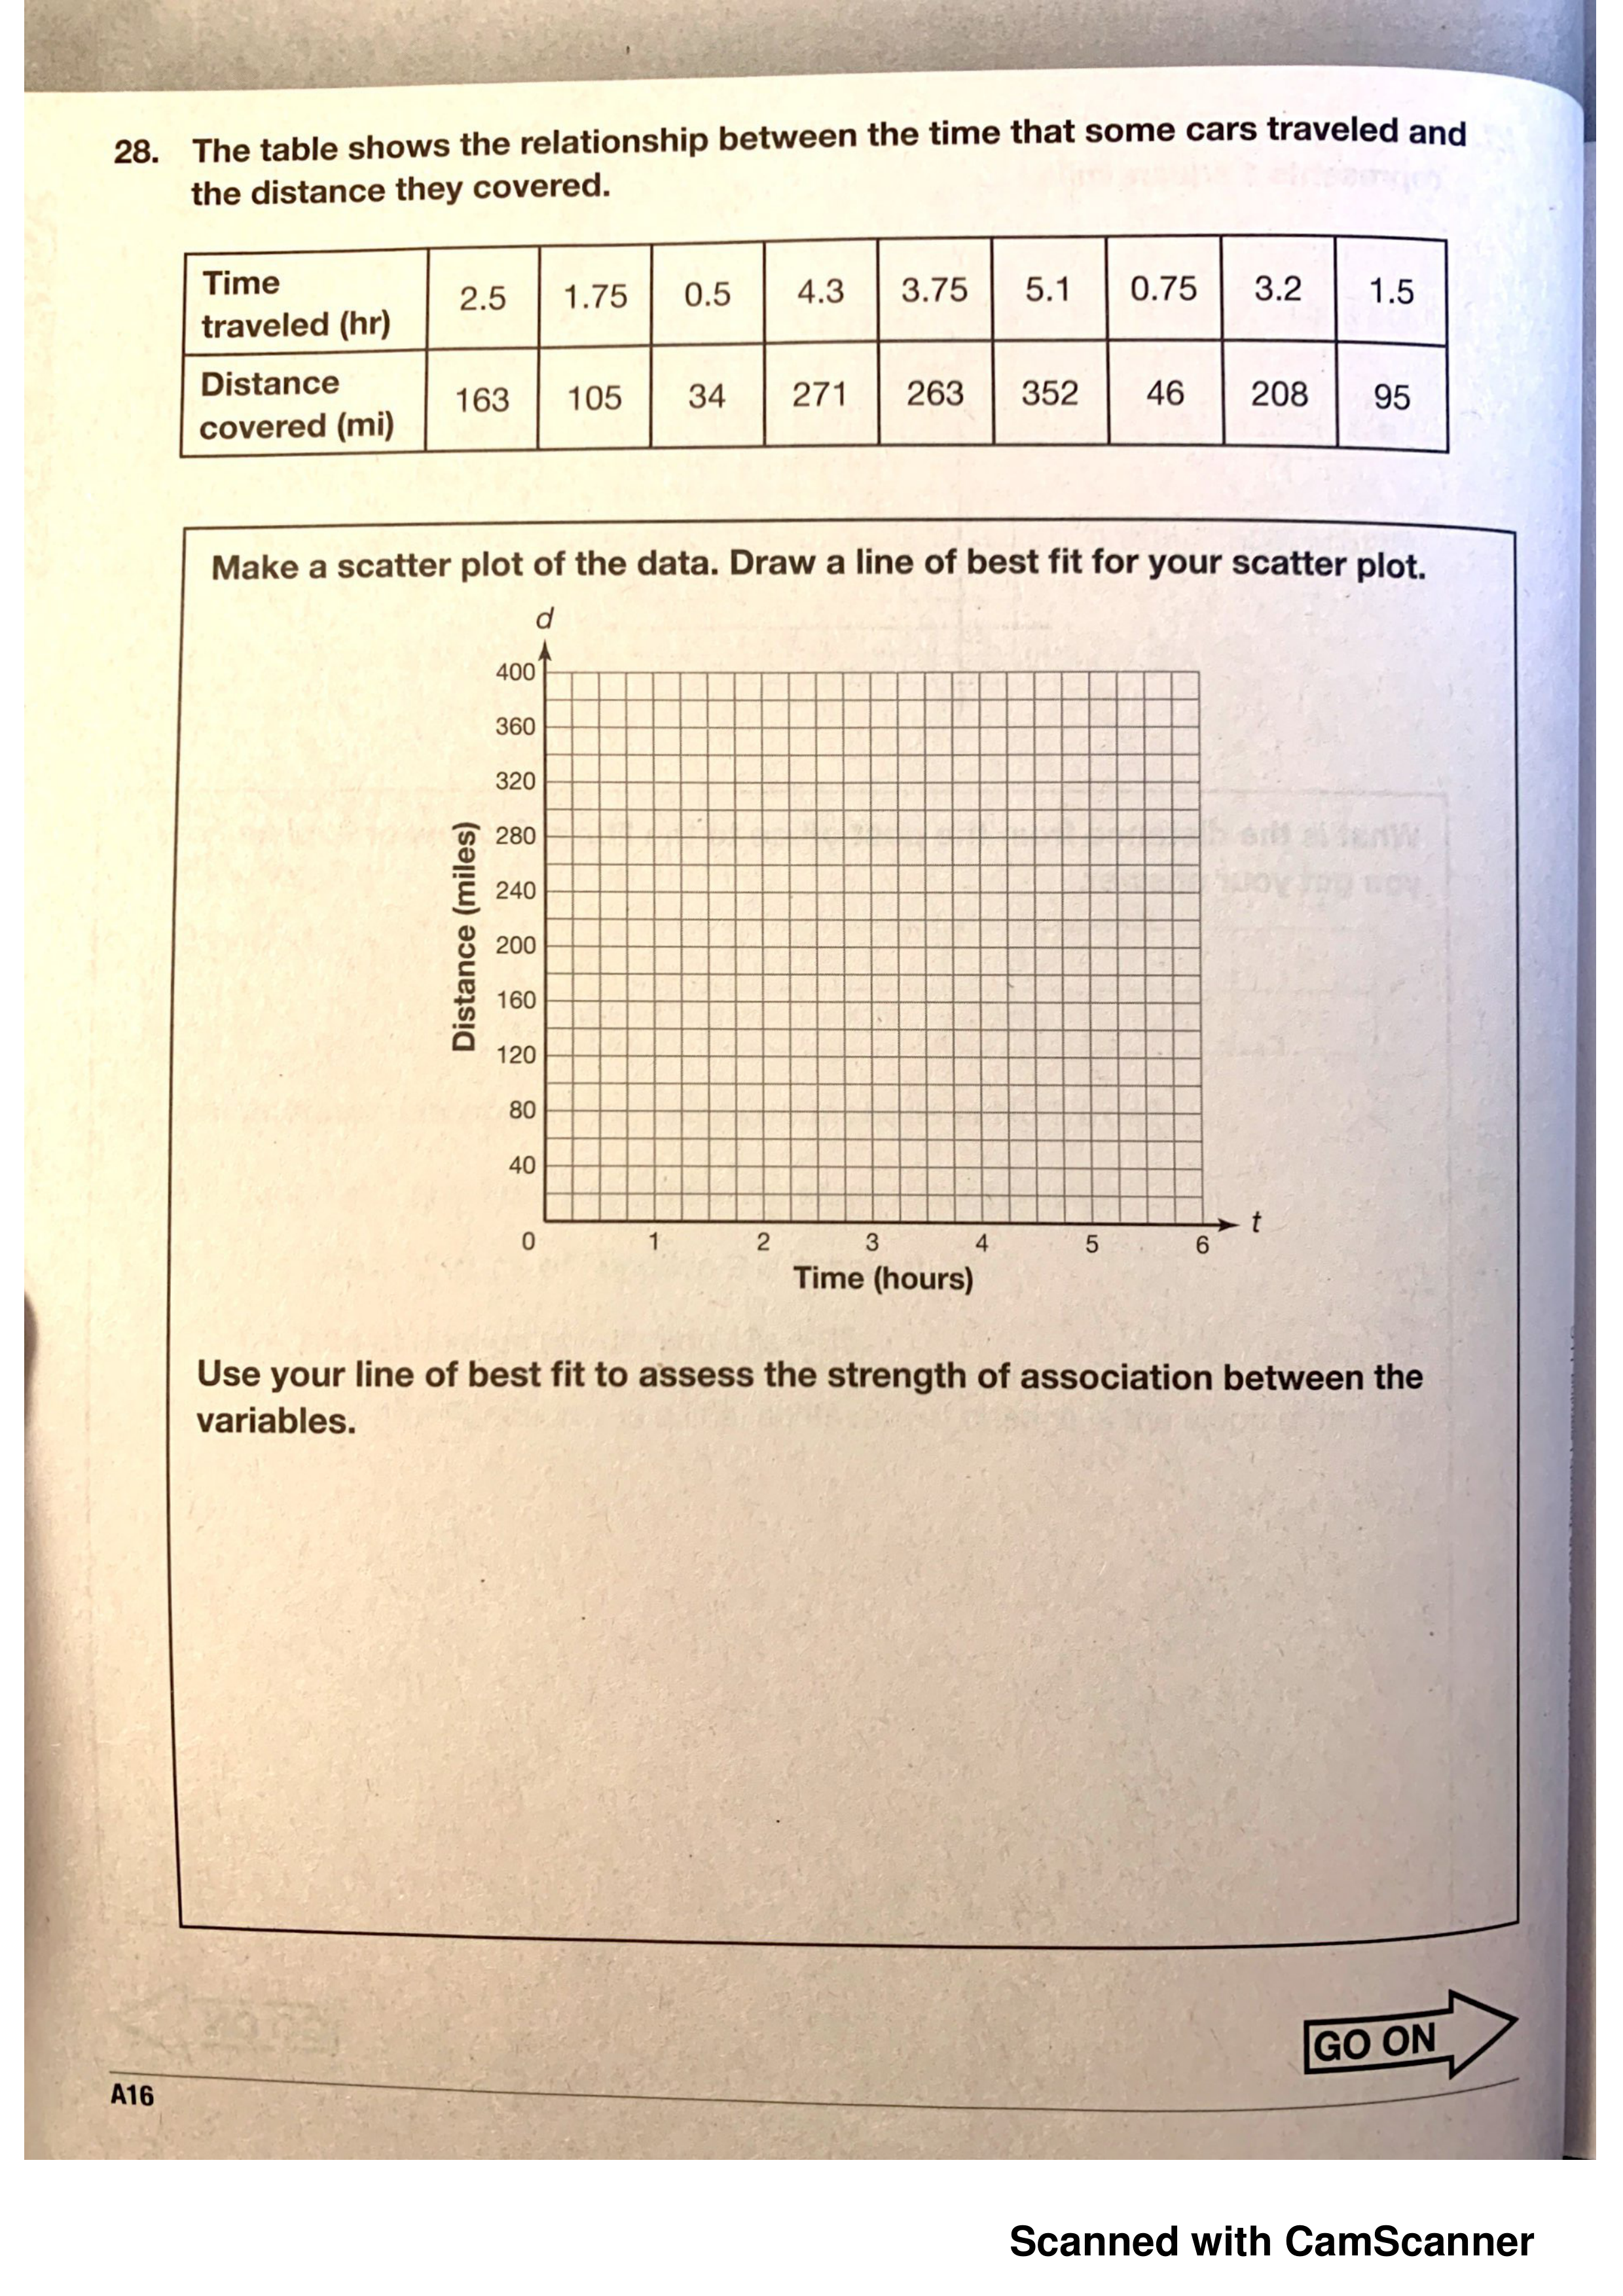
Plot the points and draw a line of best fit to assess the strength of association between the variables.
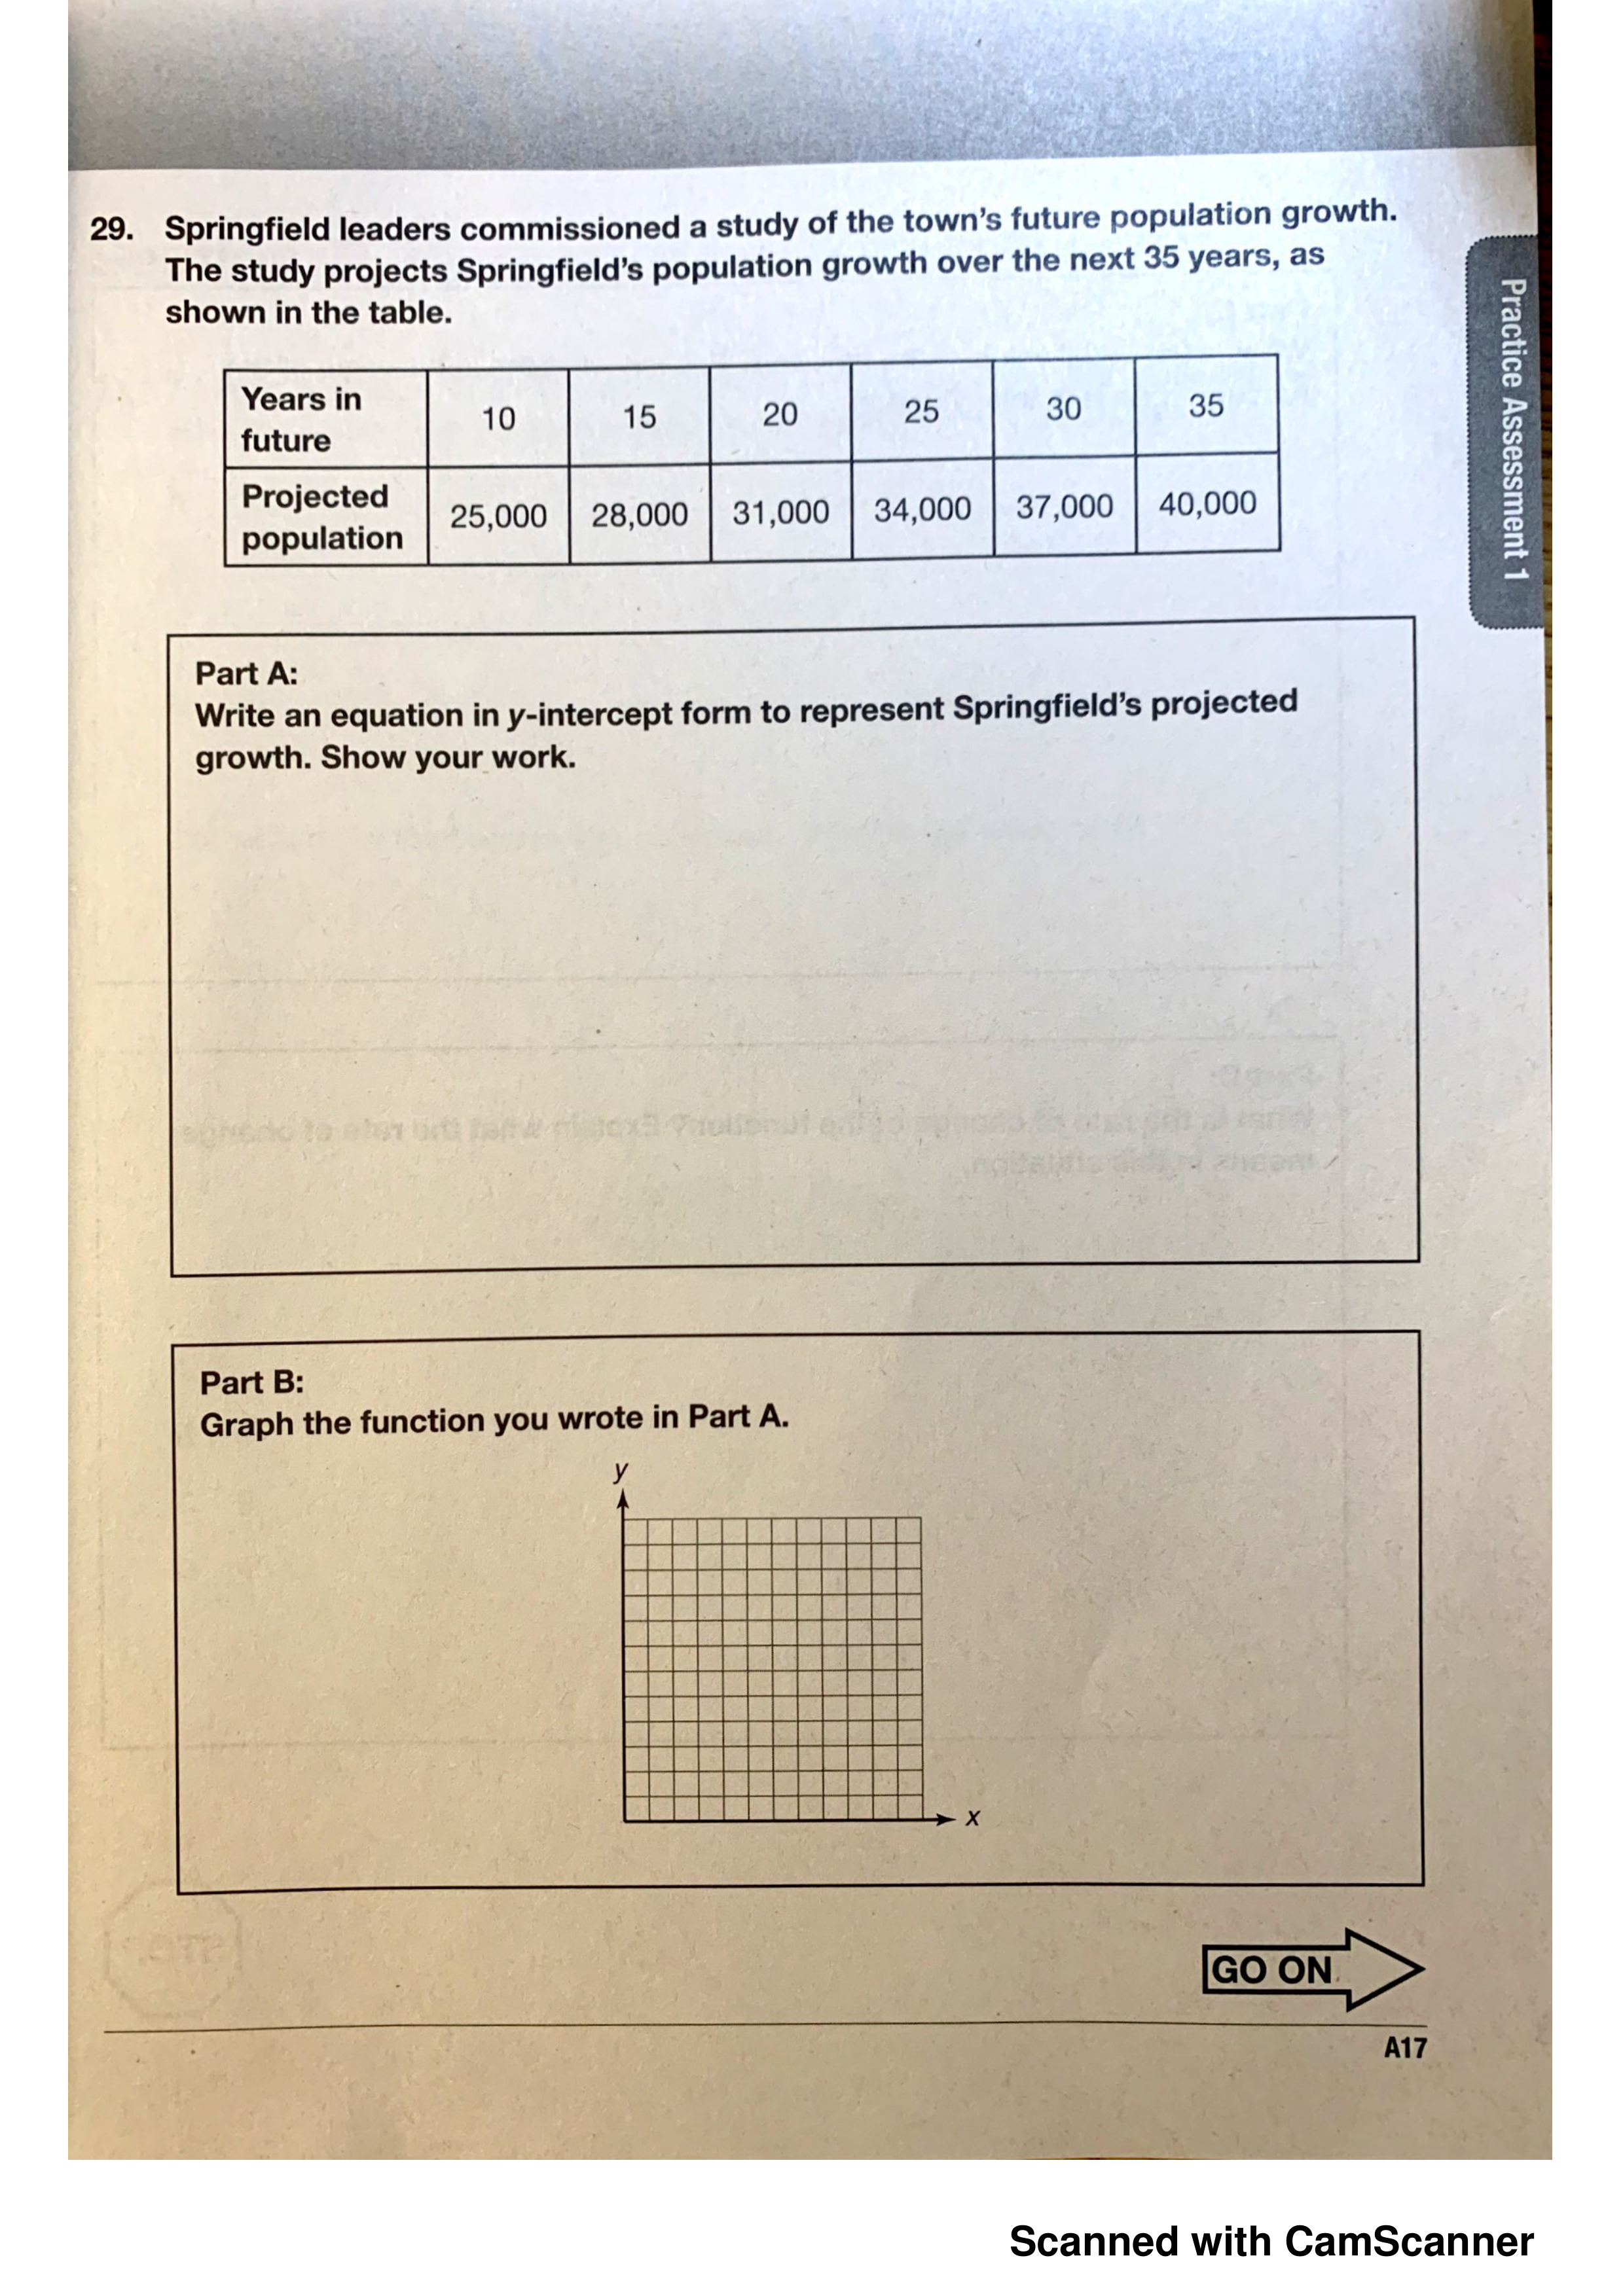
Write an equation in y-intercept form to represent Springfield's projected growth. Show your work. (ANSWER BOTH PART A & B)
Use question #19 to answer the following questions. Click on the "T" to insert text.
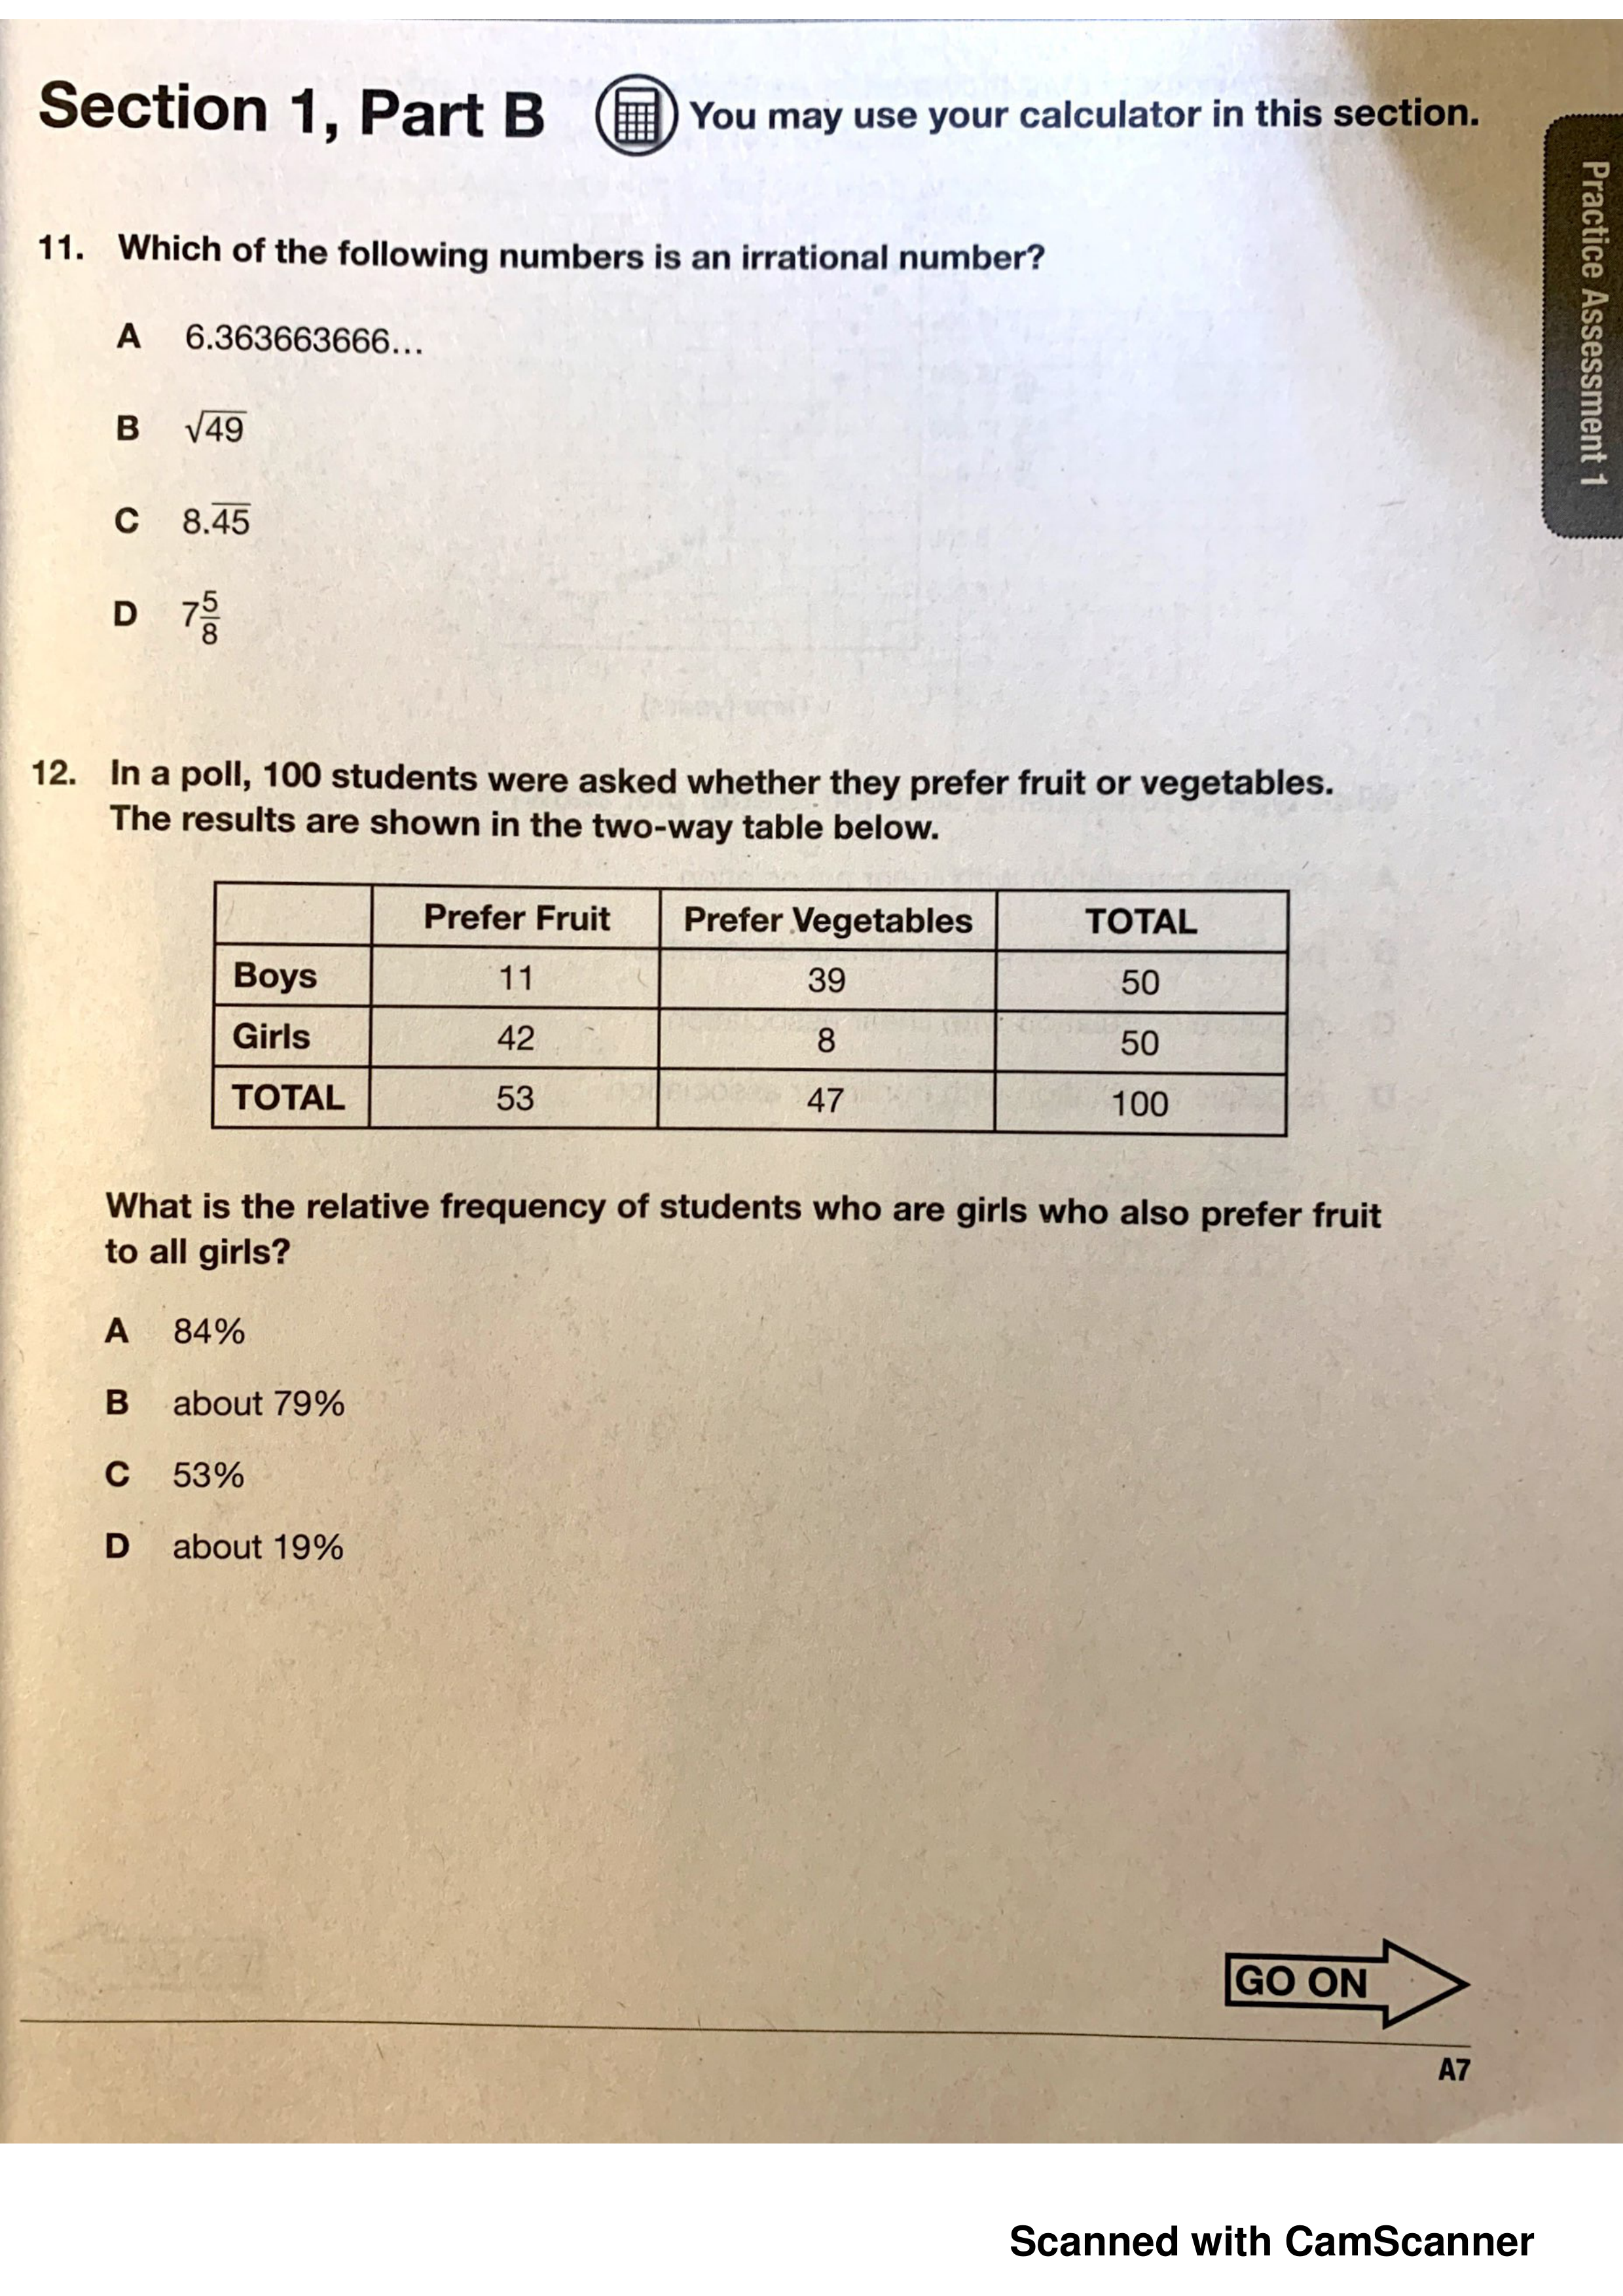
What is the relative frequency of students who are girls who also prefer fruit to all girls?
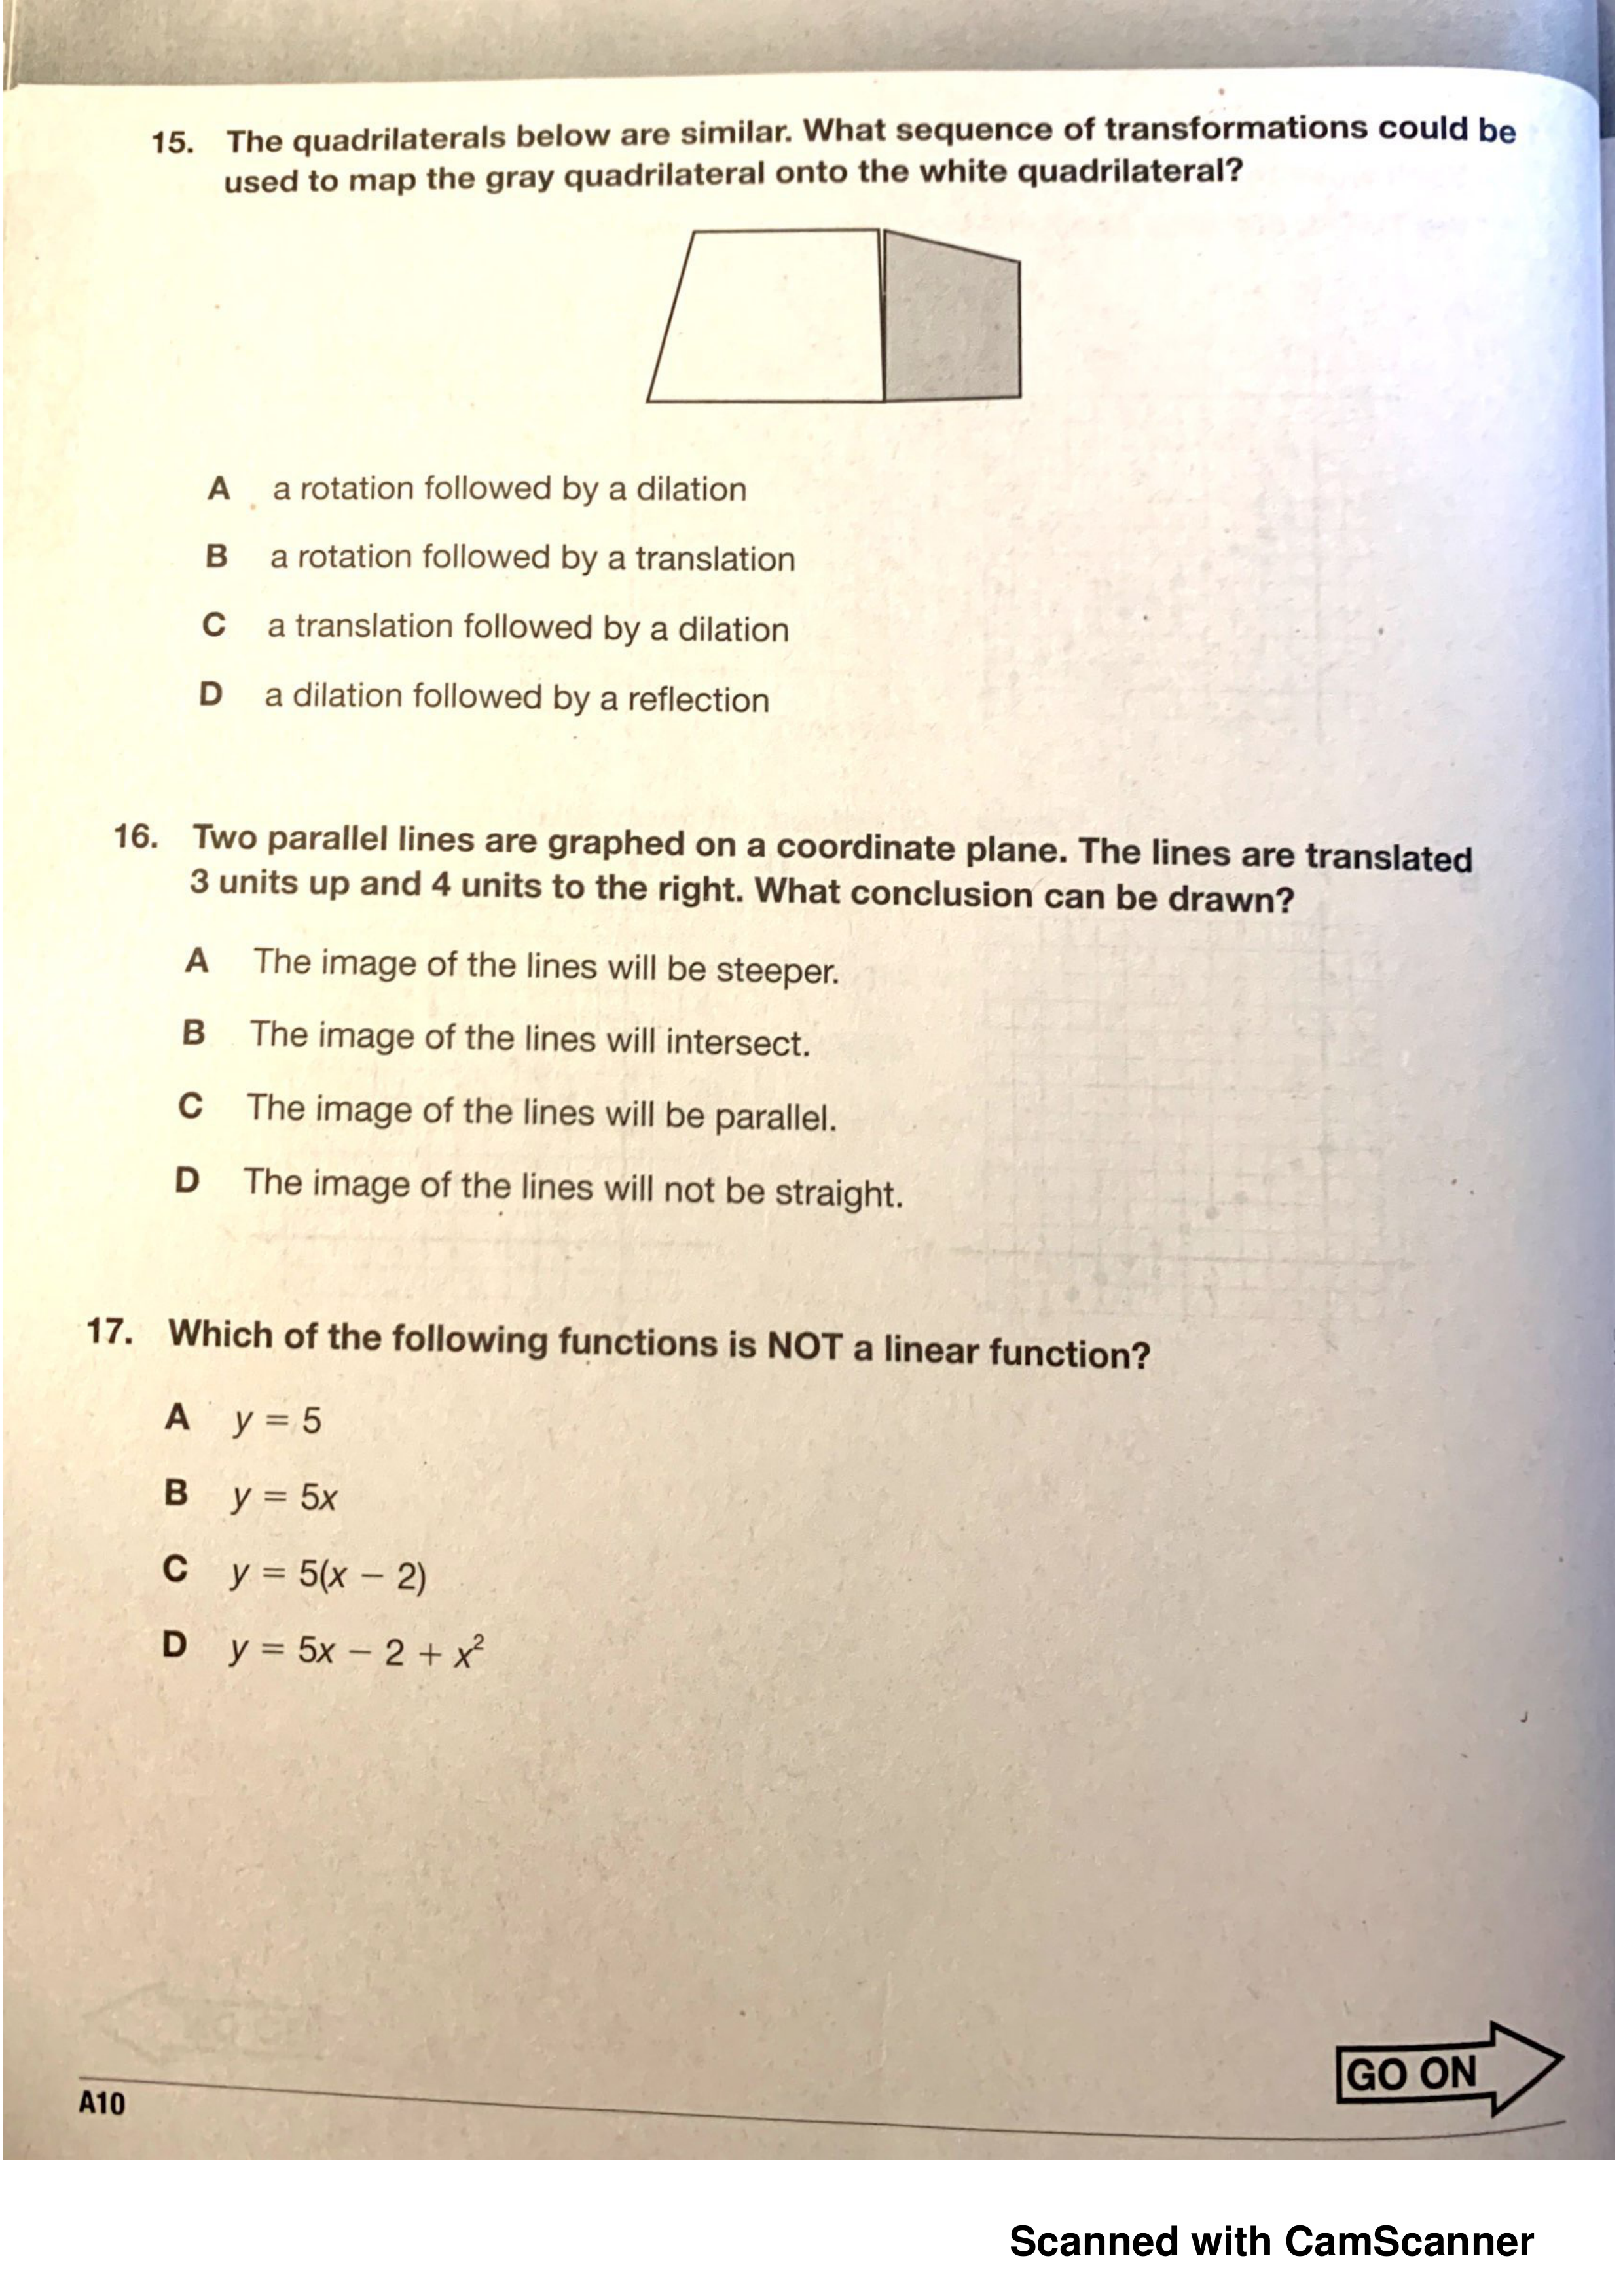
What sequence of transformations could be used to map the gray quadrilateral onto the white quadrilateral?
What conclusion can be drawn
Which of the following functions is NOT a linear function?
Solve.
What are the coordintes of rectangle MATH after a dilation centered at the origin with a scale factor of 1/2?
Which statement is NOT true?
Which statement could he have used?
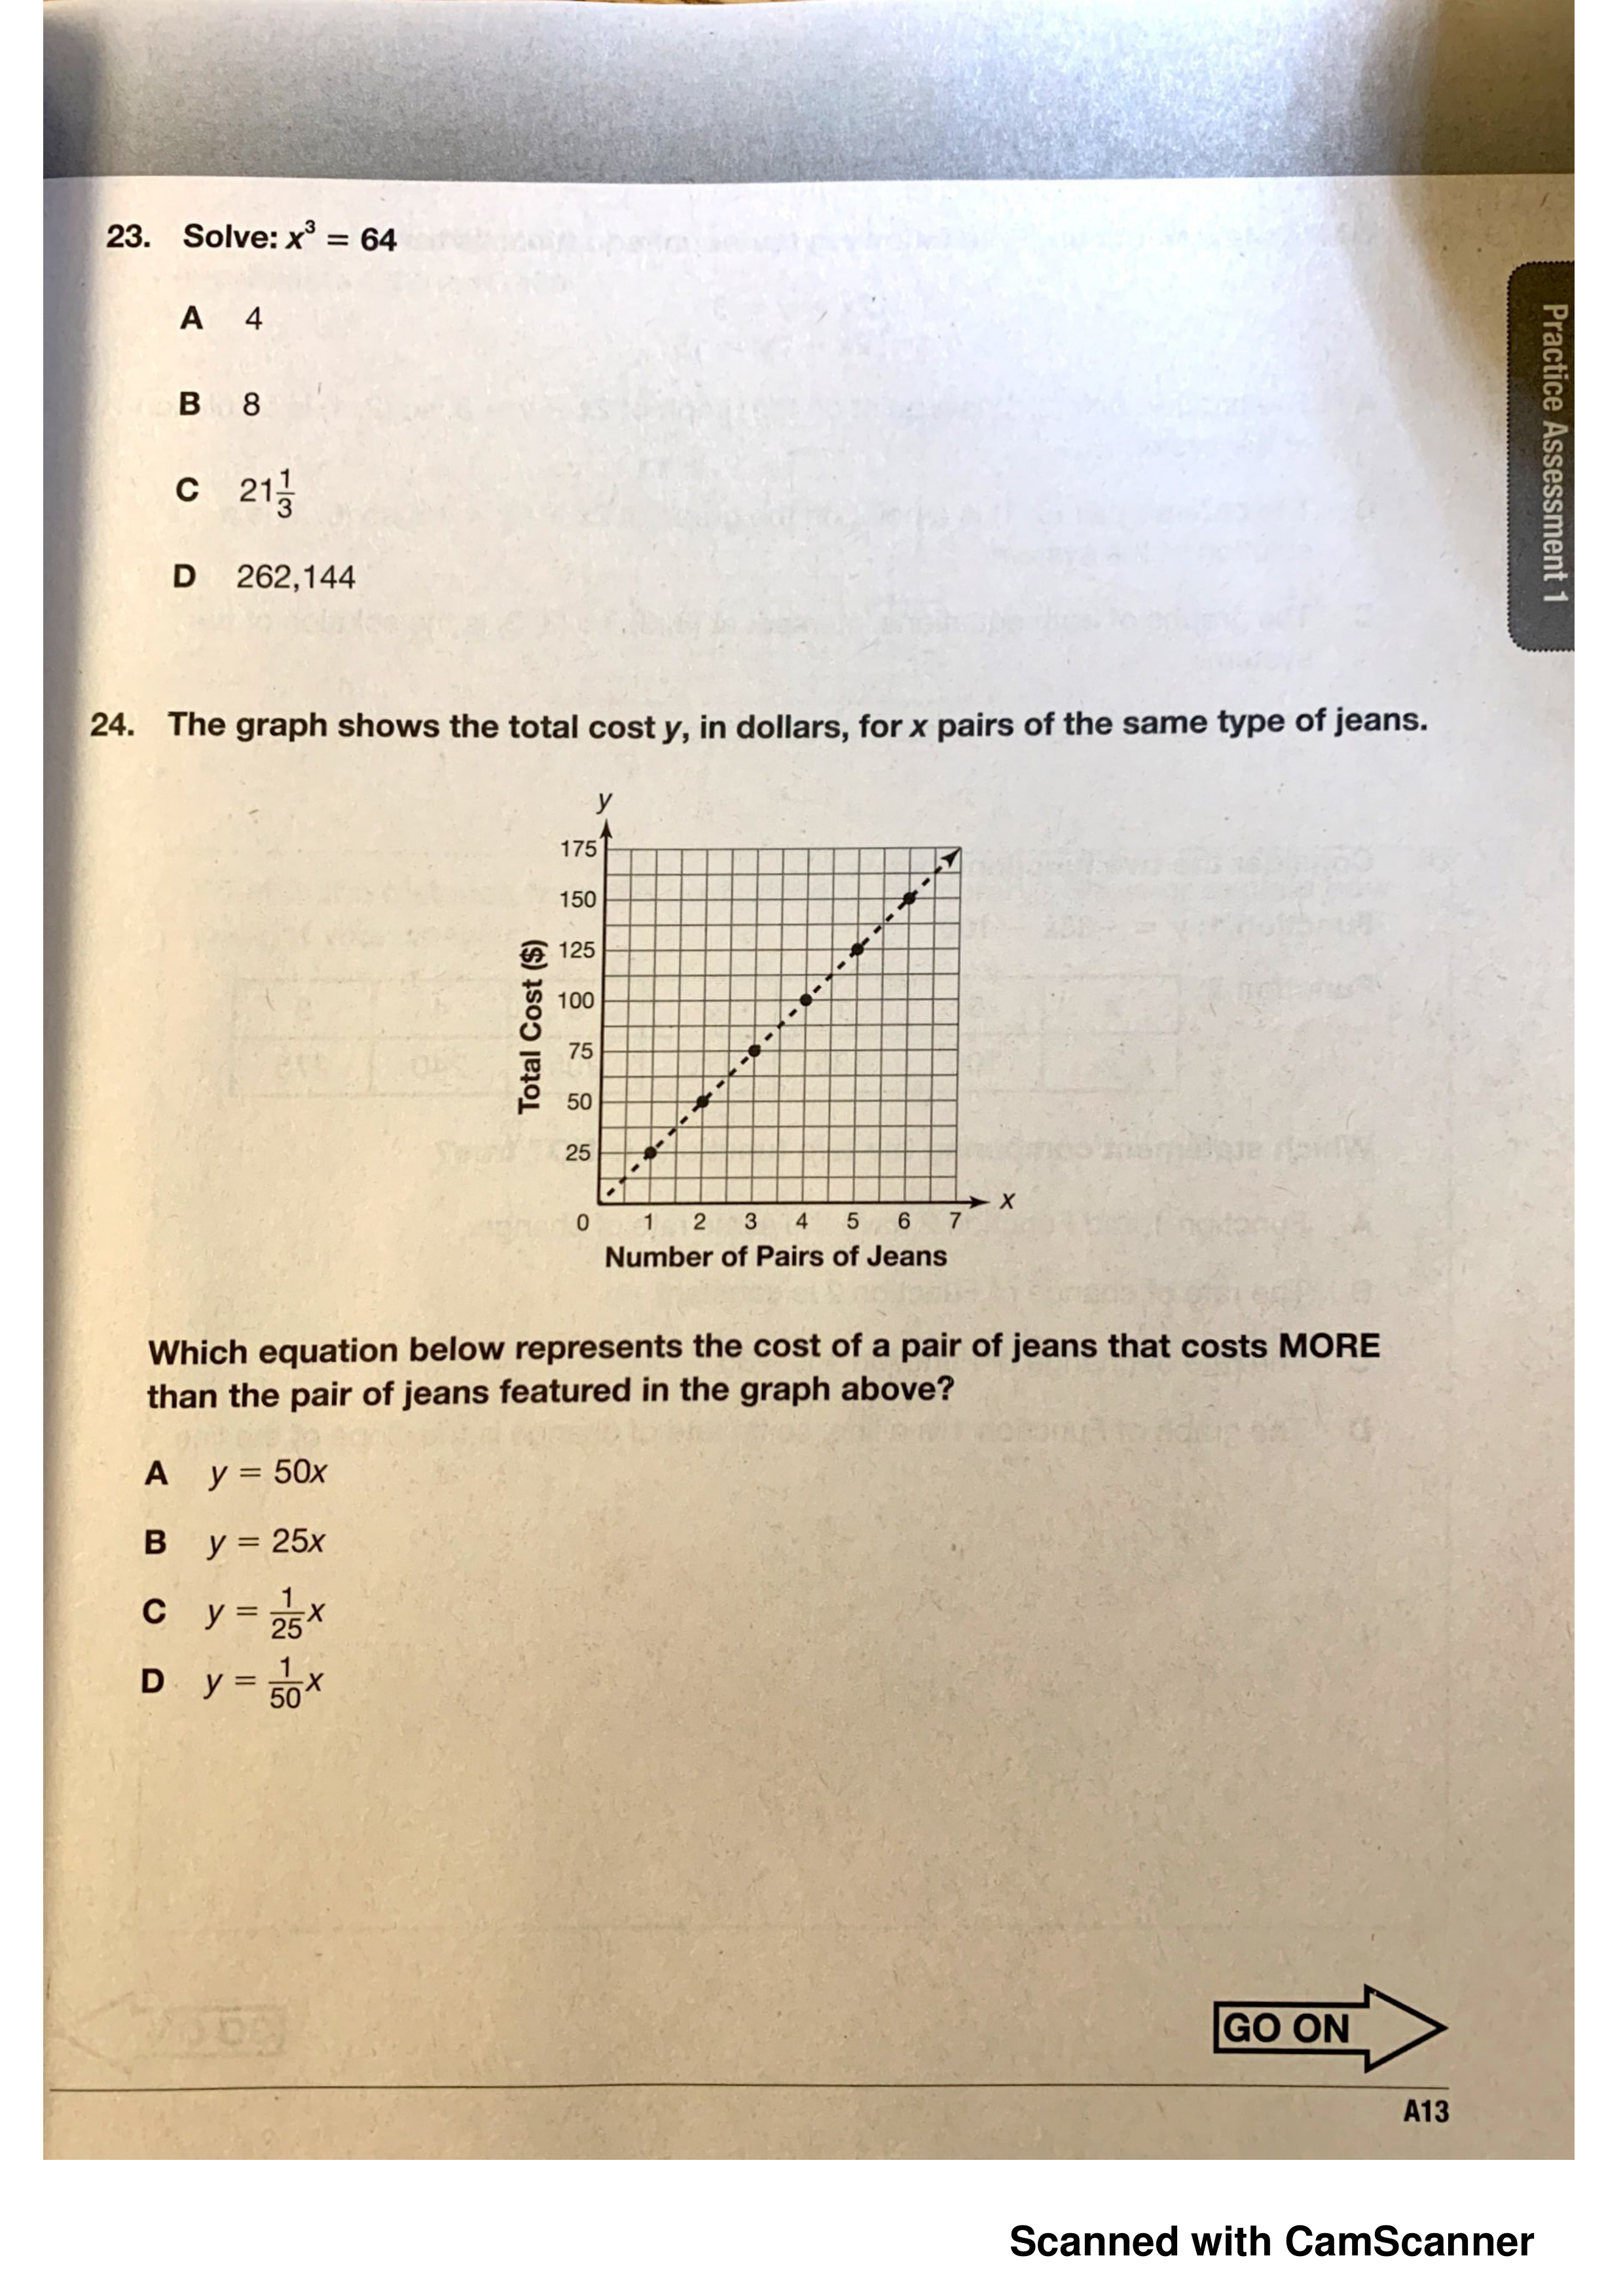
Which equation below represents the cost of a pair of jeans that costs MORE than the pair of jeans featured in the graph above?
Which statement comparing the two functions is NOT true?