Writing Inequalities from Graphs
star
star
star
star
star
Posljednje ažuriranje over 1 year ago
7
1
1
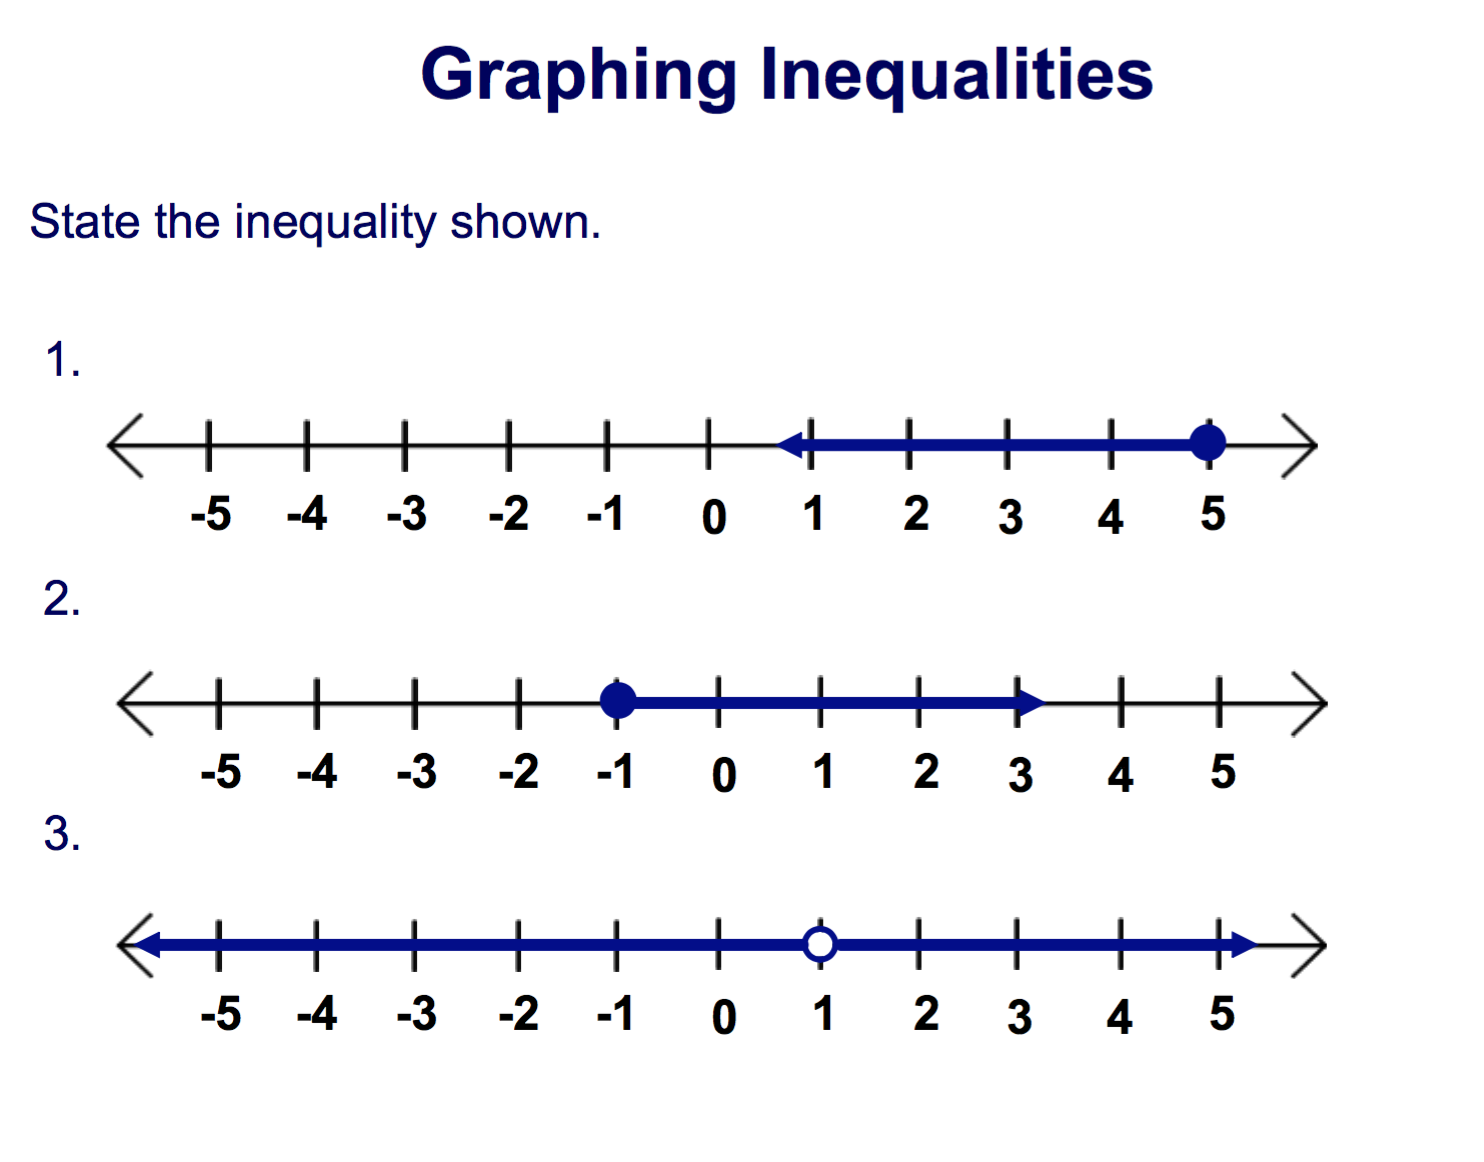
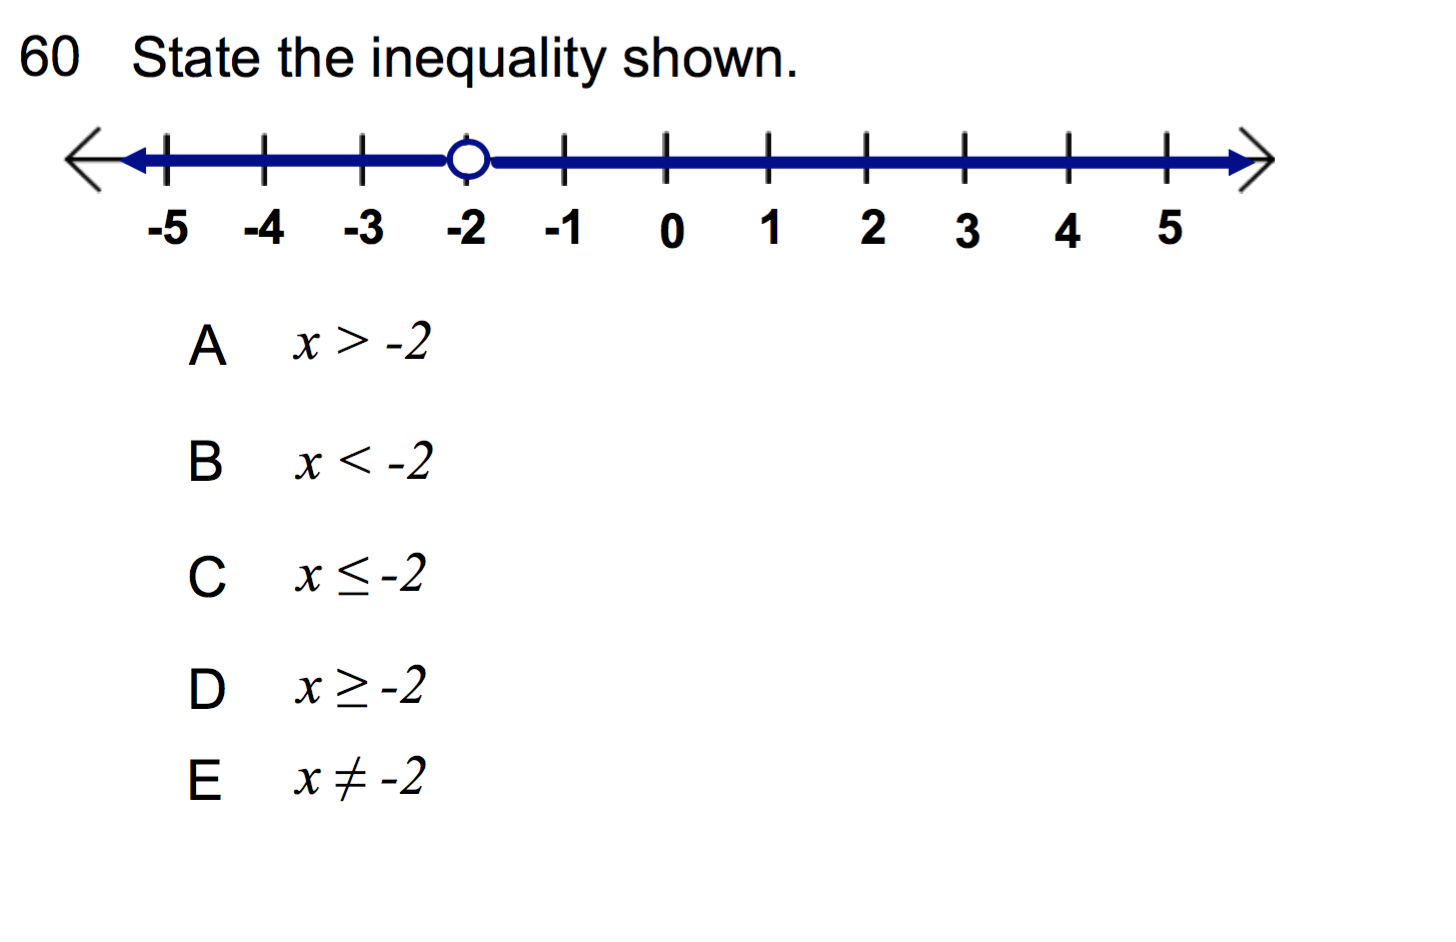
State the inequality shown in this graph. Use x as your variable.
State the inequality shown in this graph. Use x as your variable.
State the inequality shown in this graph. Use x as your variable.
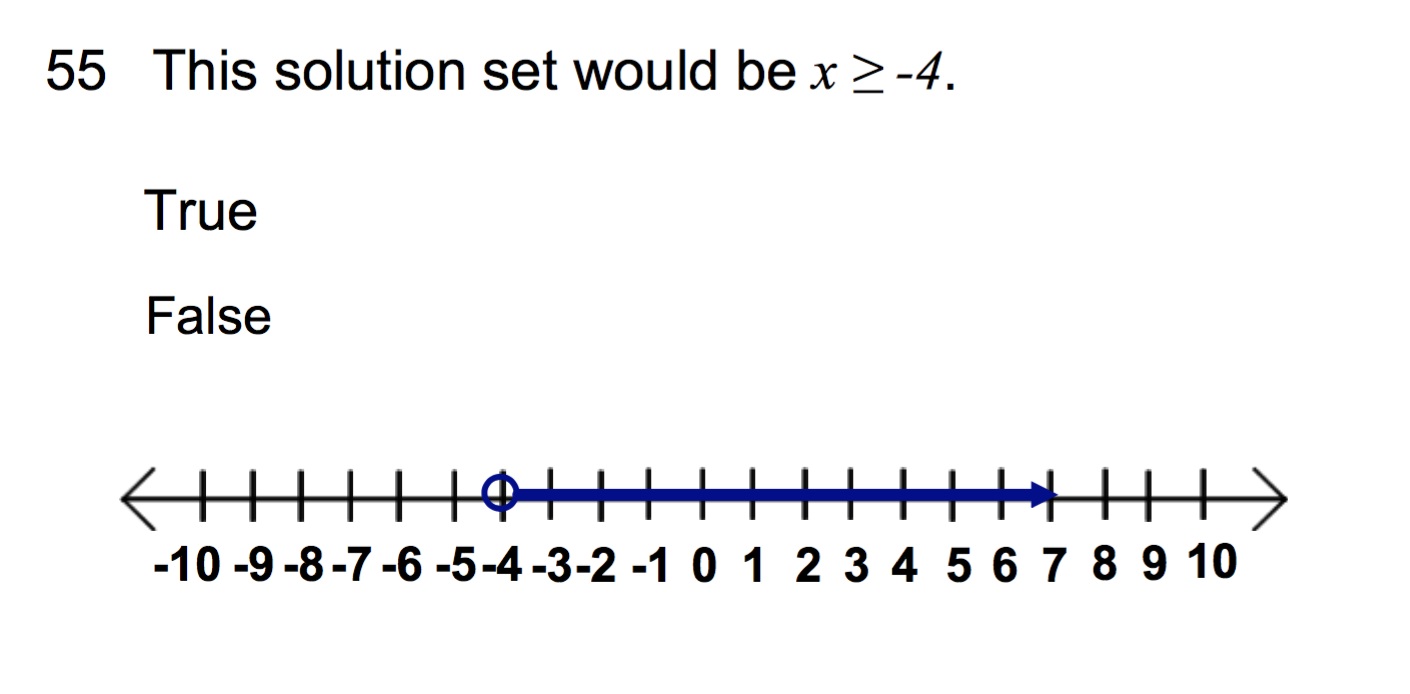
True or False: This graph shows x ≥ -4.
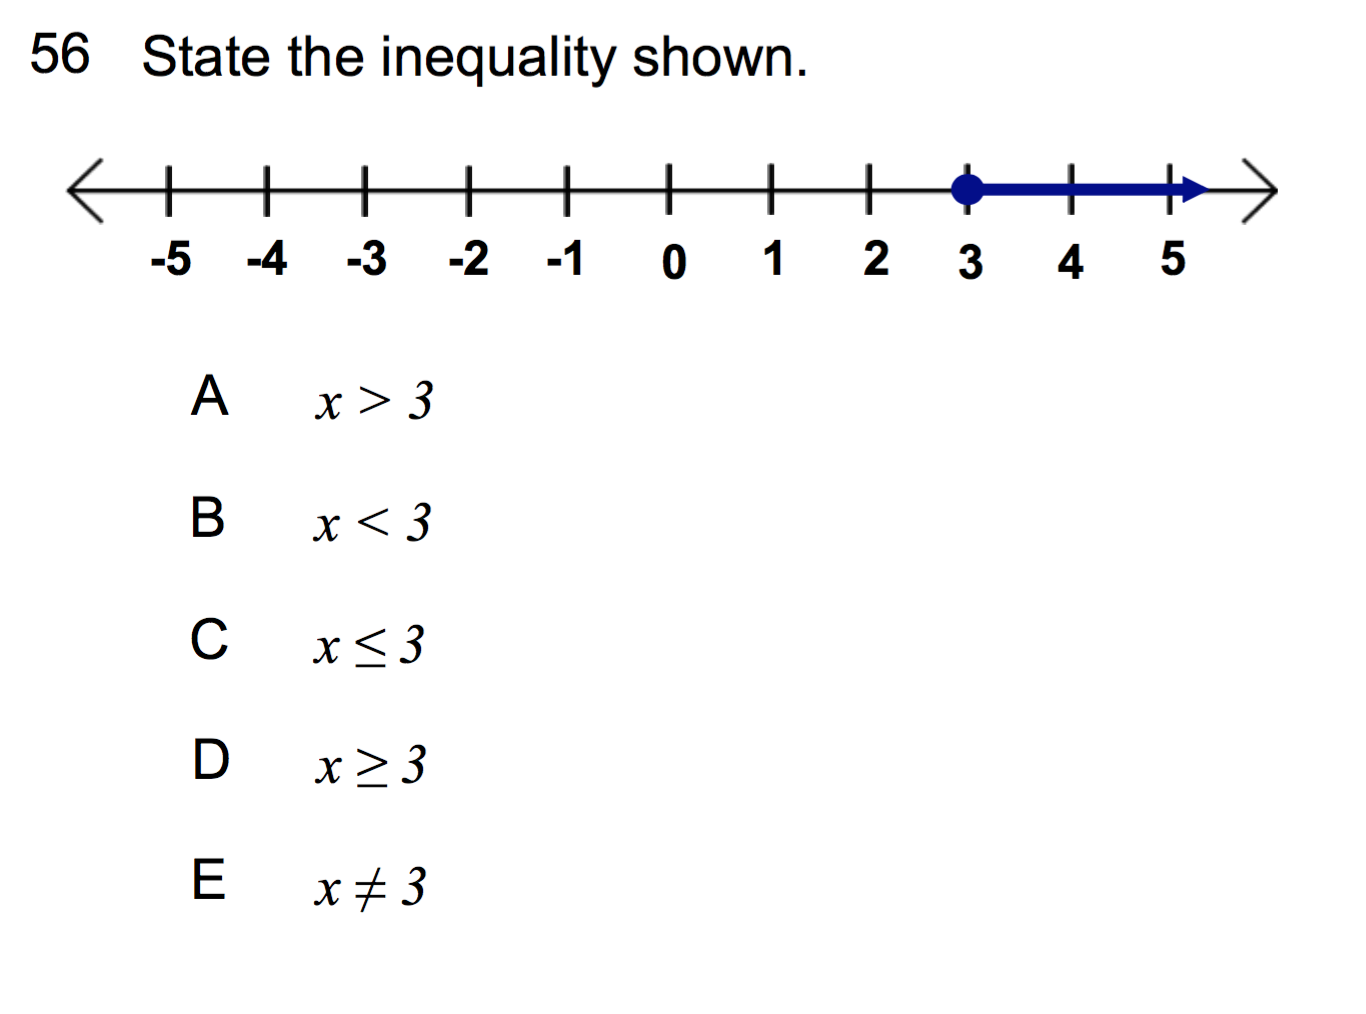
Which inequality best represents the graph seen here?
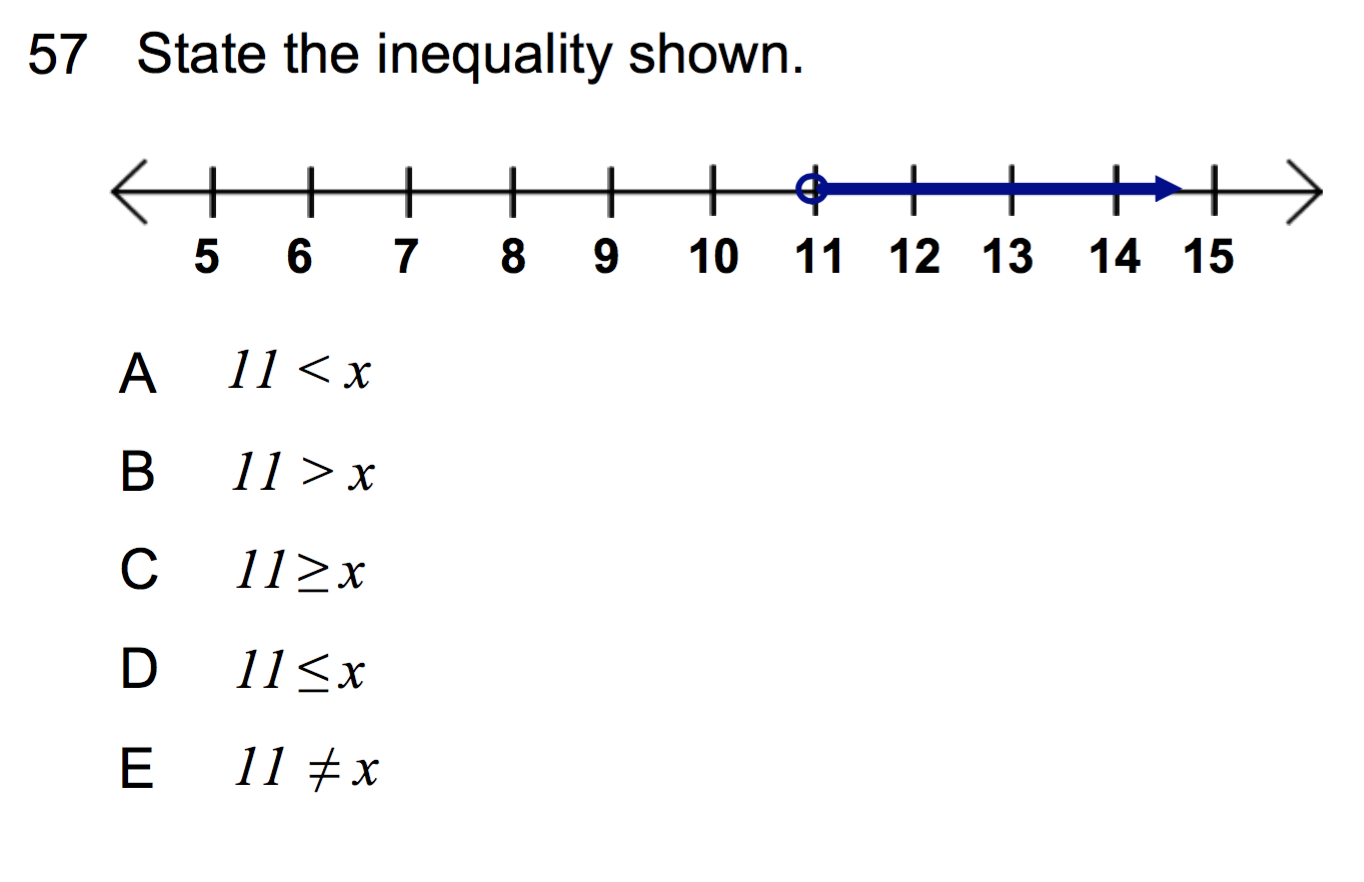
Which inequality best represents the graph seen here?
Which inequality best represents the graph seen here?