Unit 16 Test Graphing Data
star
star
star
star
star
Last updated over 6 years ago
17 Nsɛmmisa
1
1
1
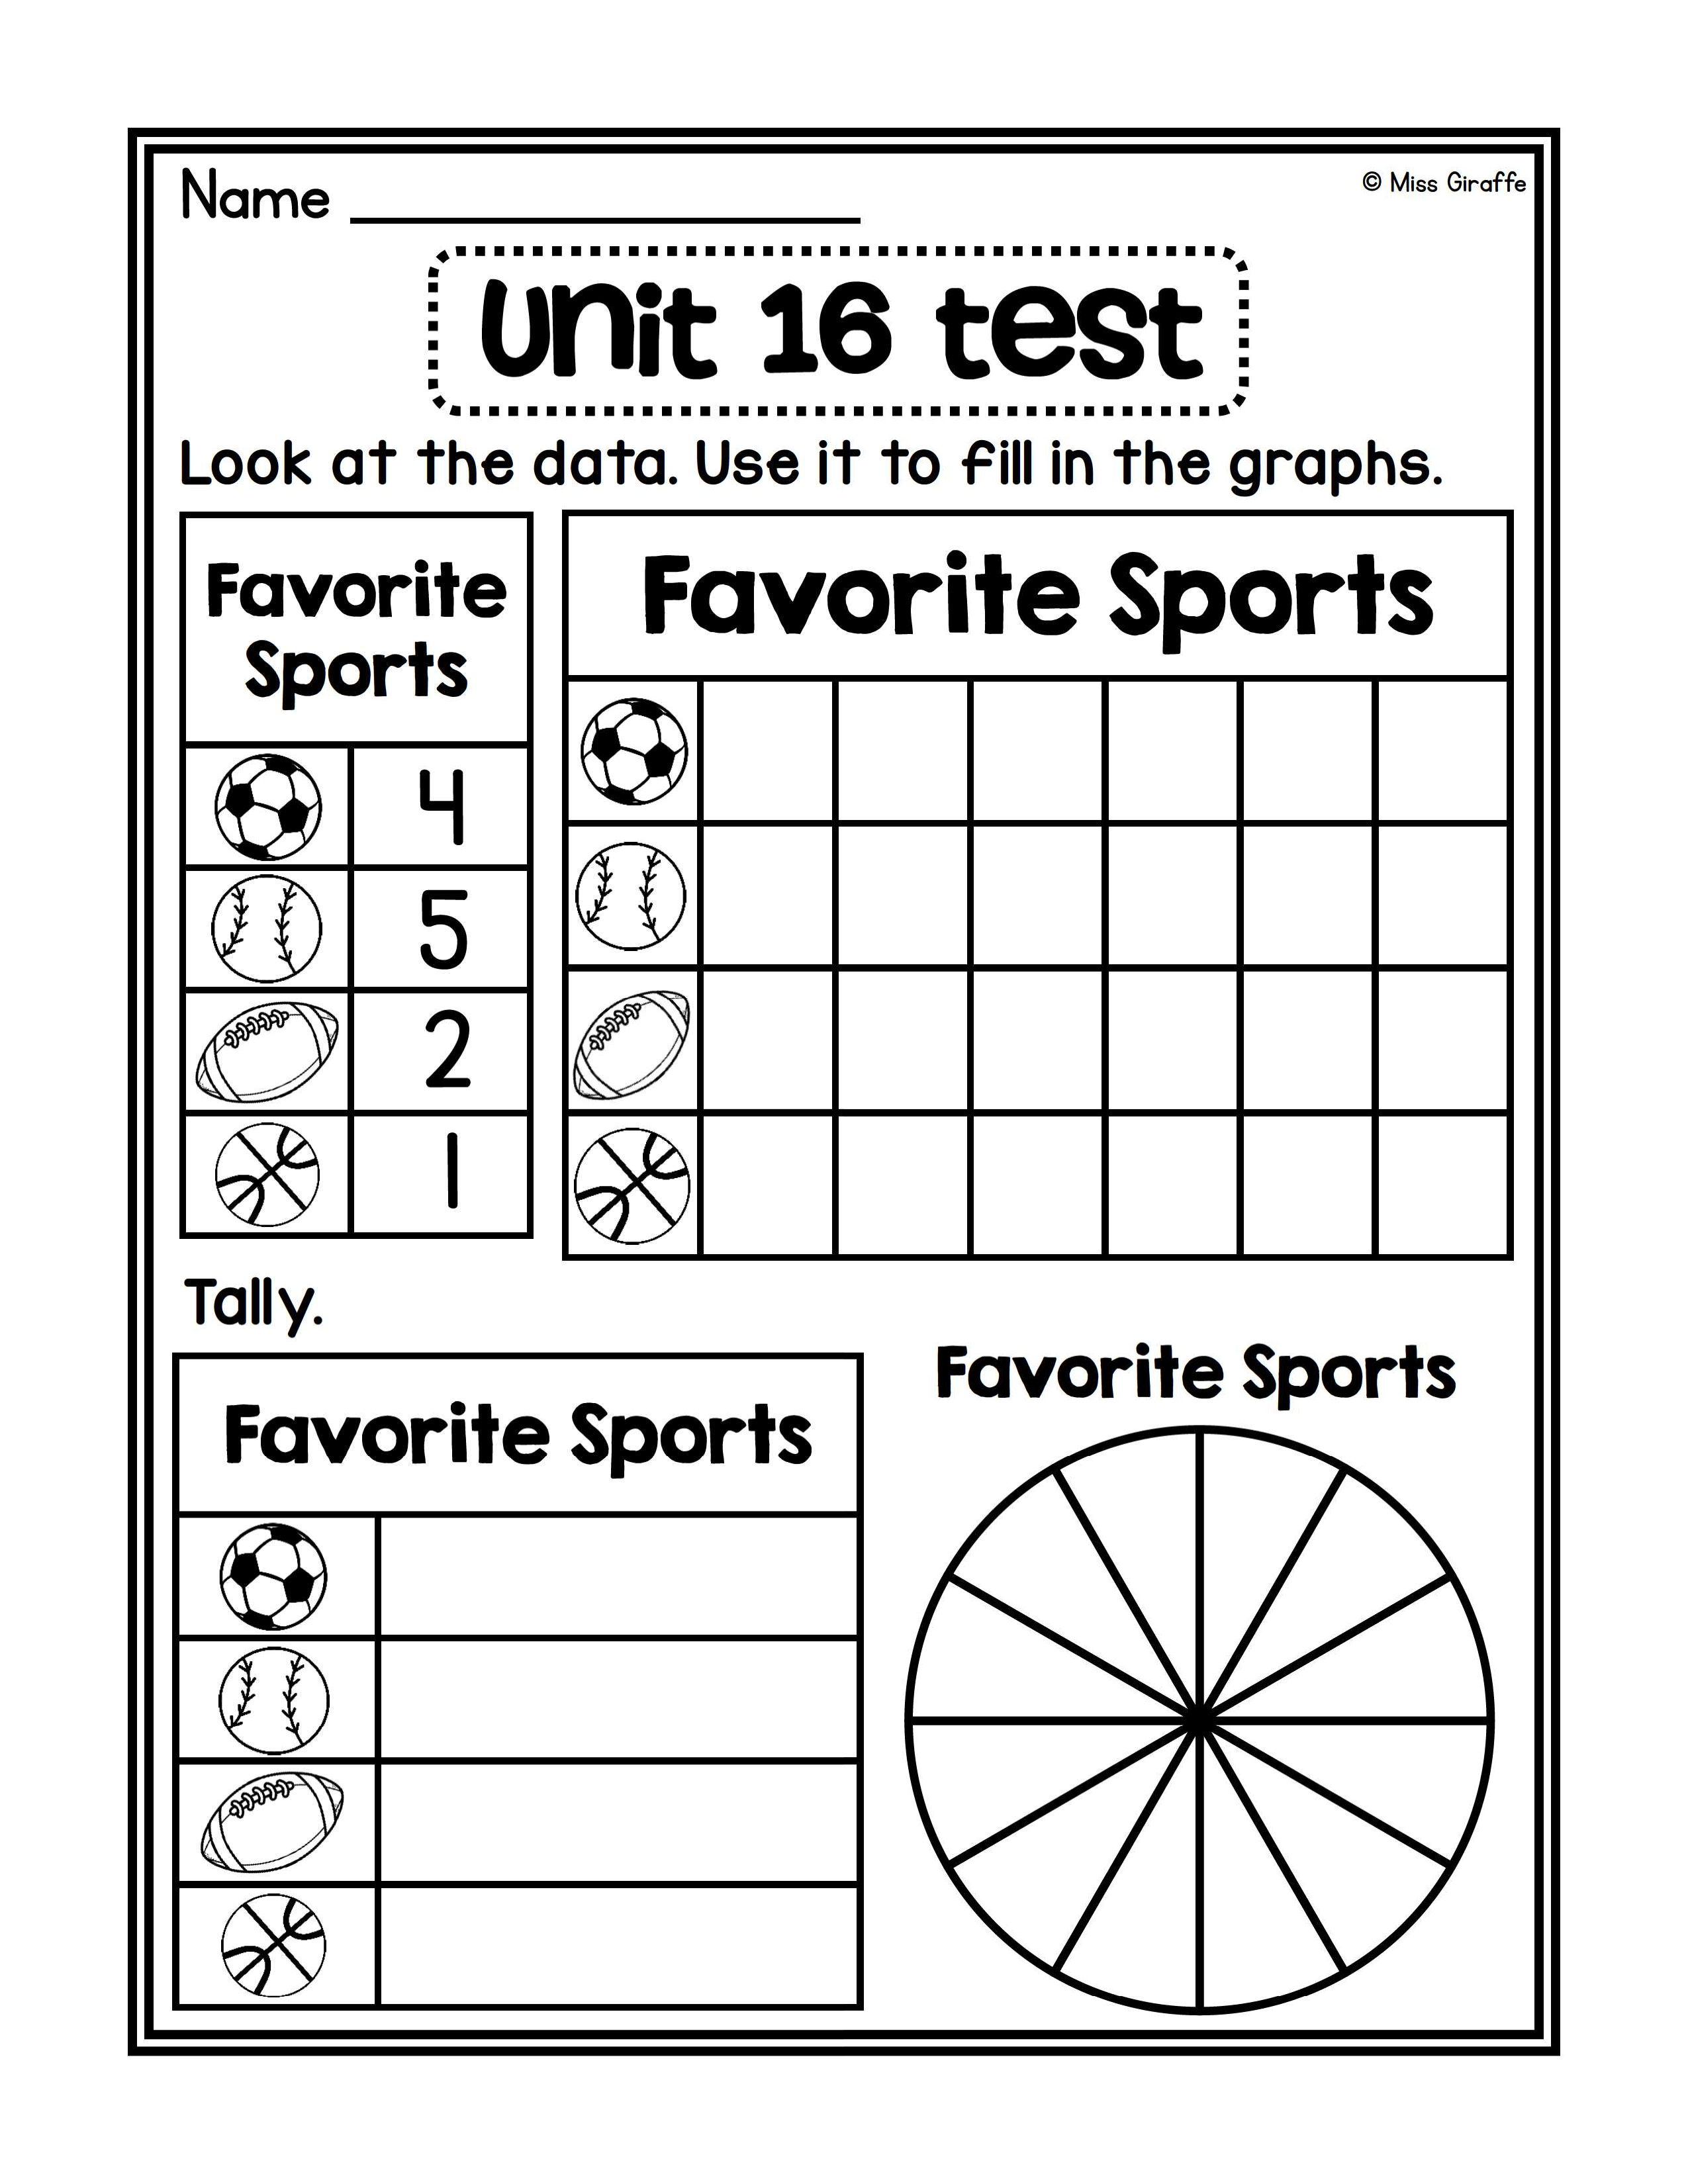
Color in the correct number of boxes using the draw tool.
Use the draw tool to make tallies for each sport.
Use the draw tool to color in the pie chart.
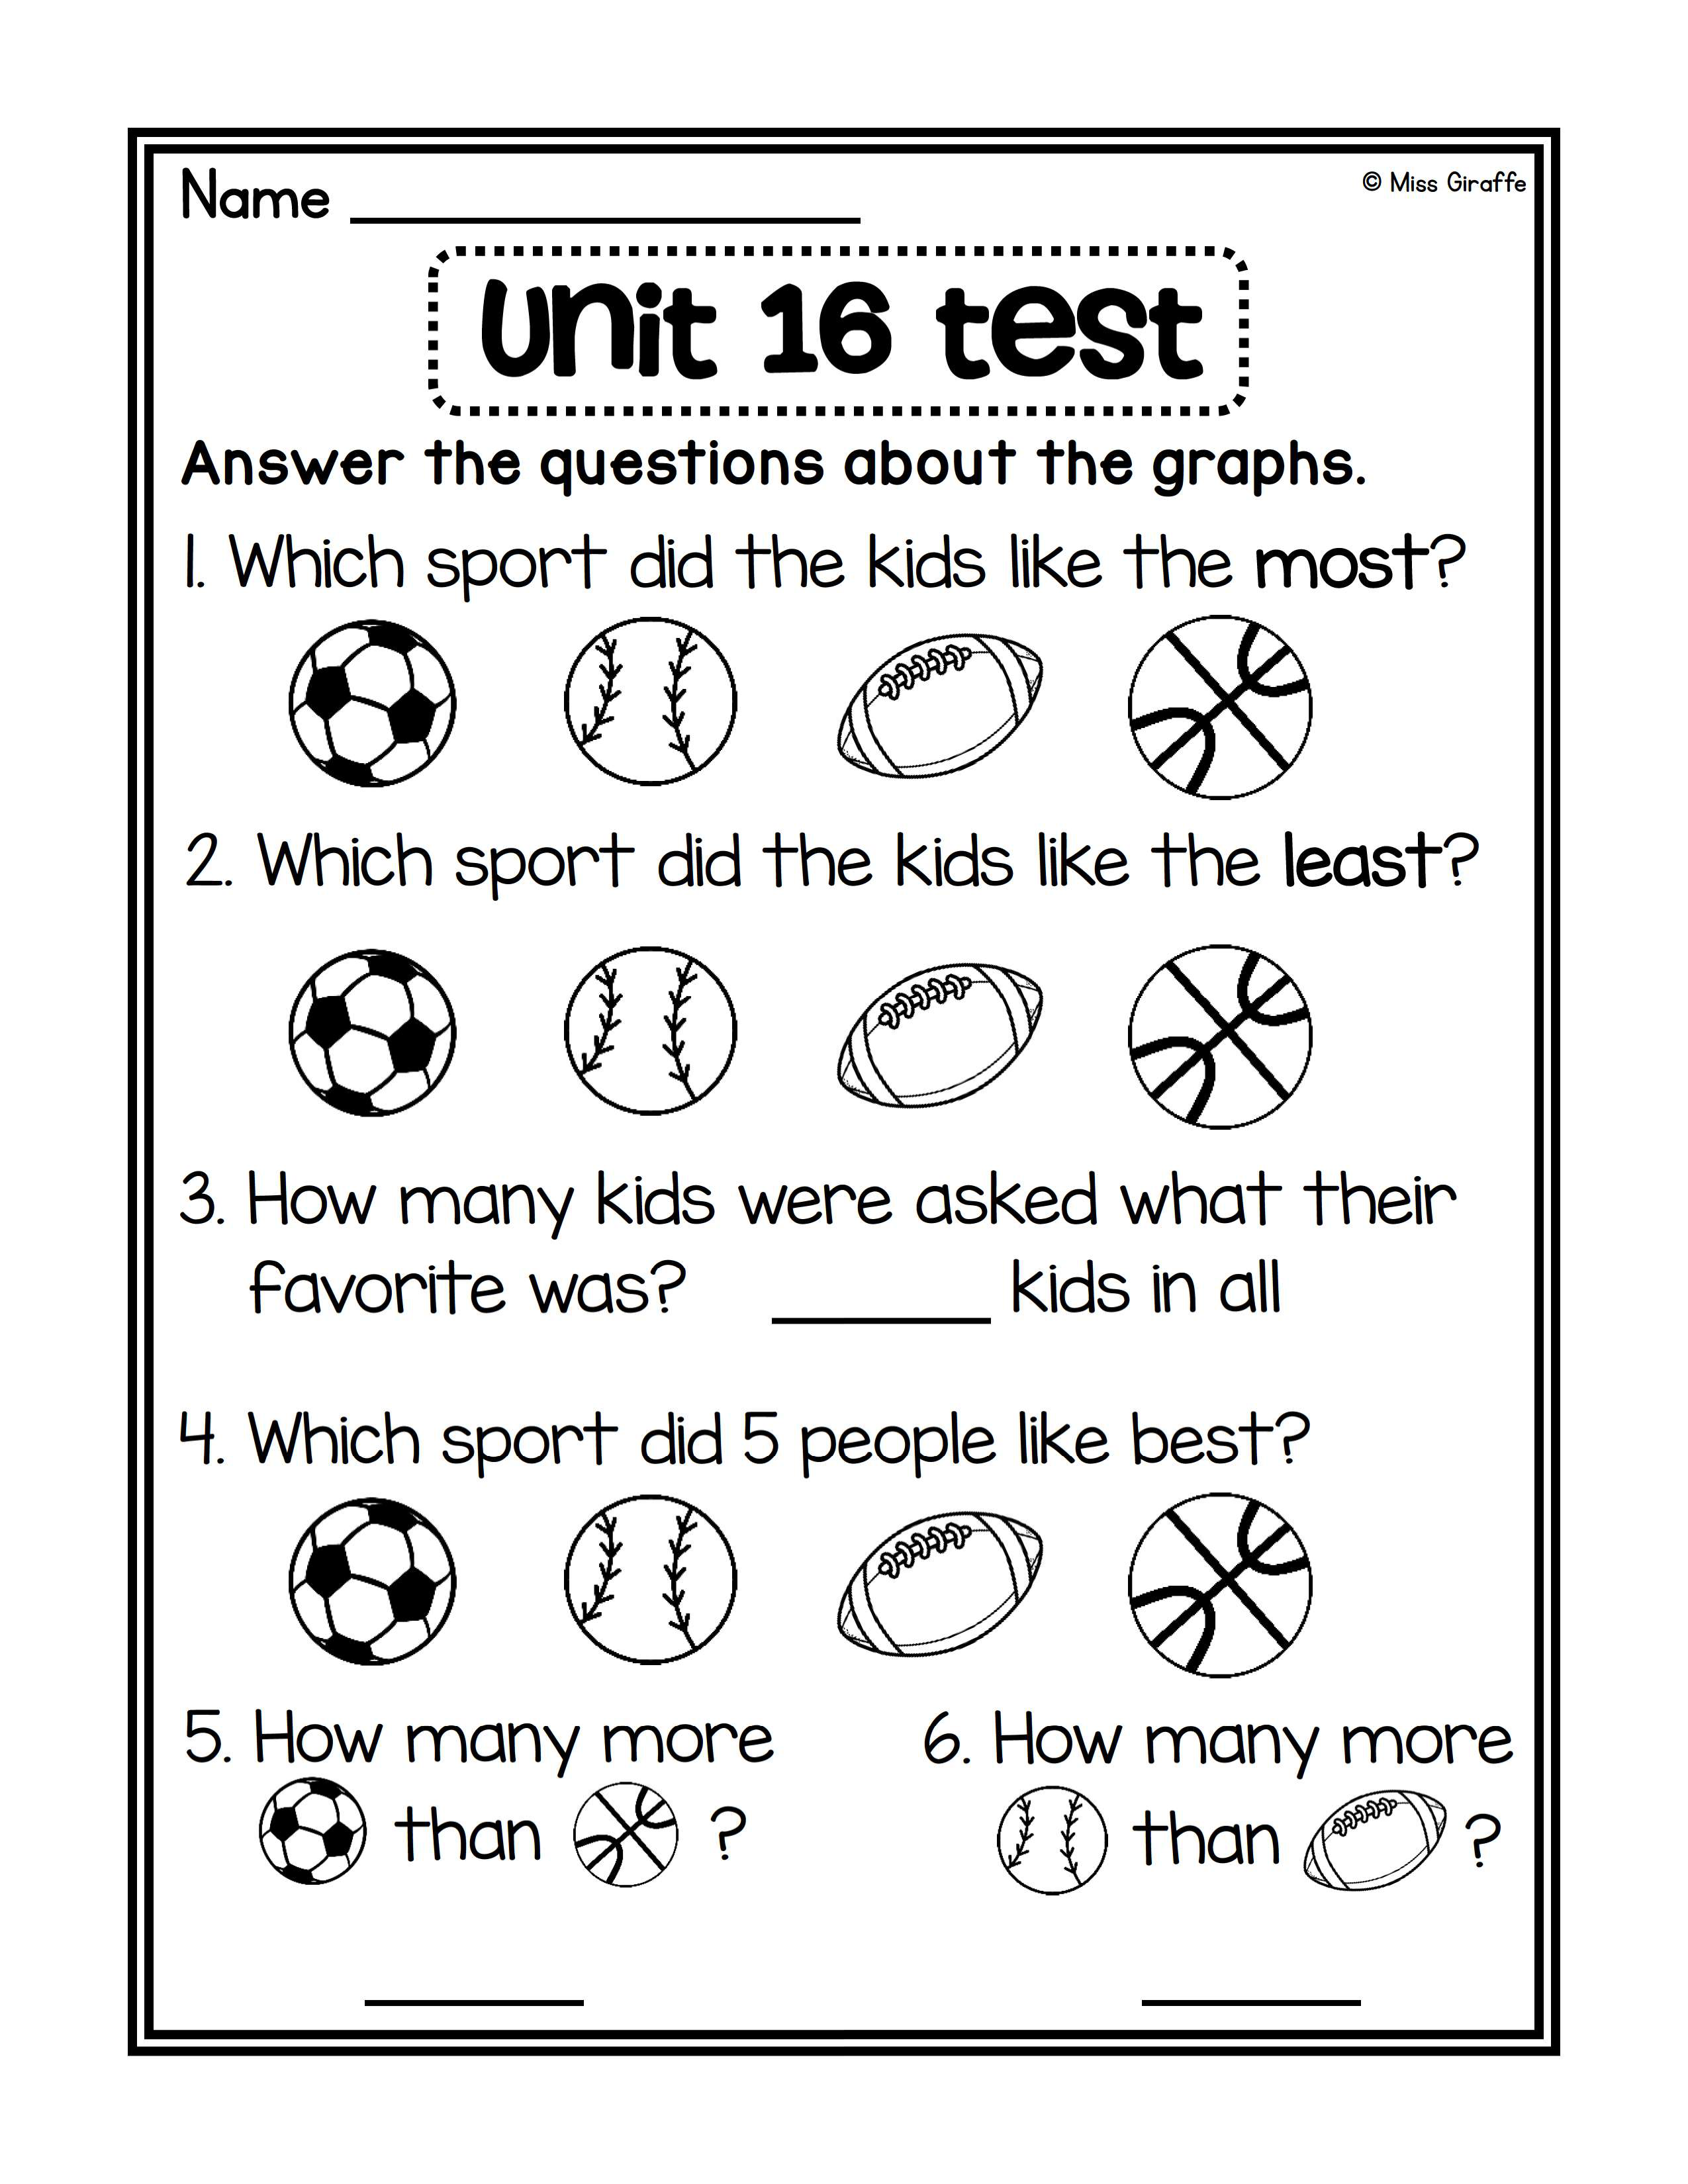
How many kids were asked what their favorite was?
How many more soccer than basketball?
Which sport did the kids like the most?
Which sport did the kids like the leas?
Which sport did 5 people like best?
How many more baseball than football?
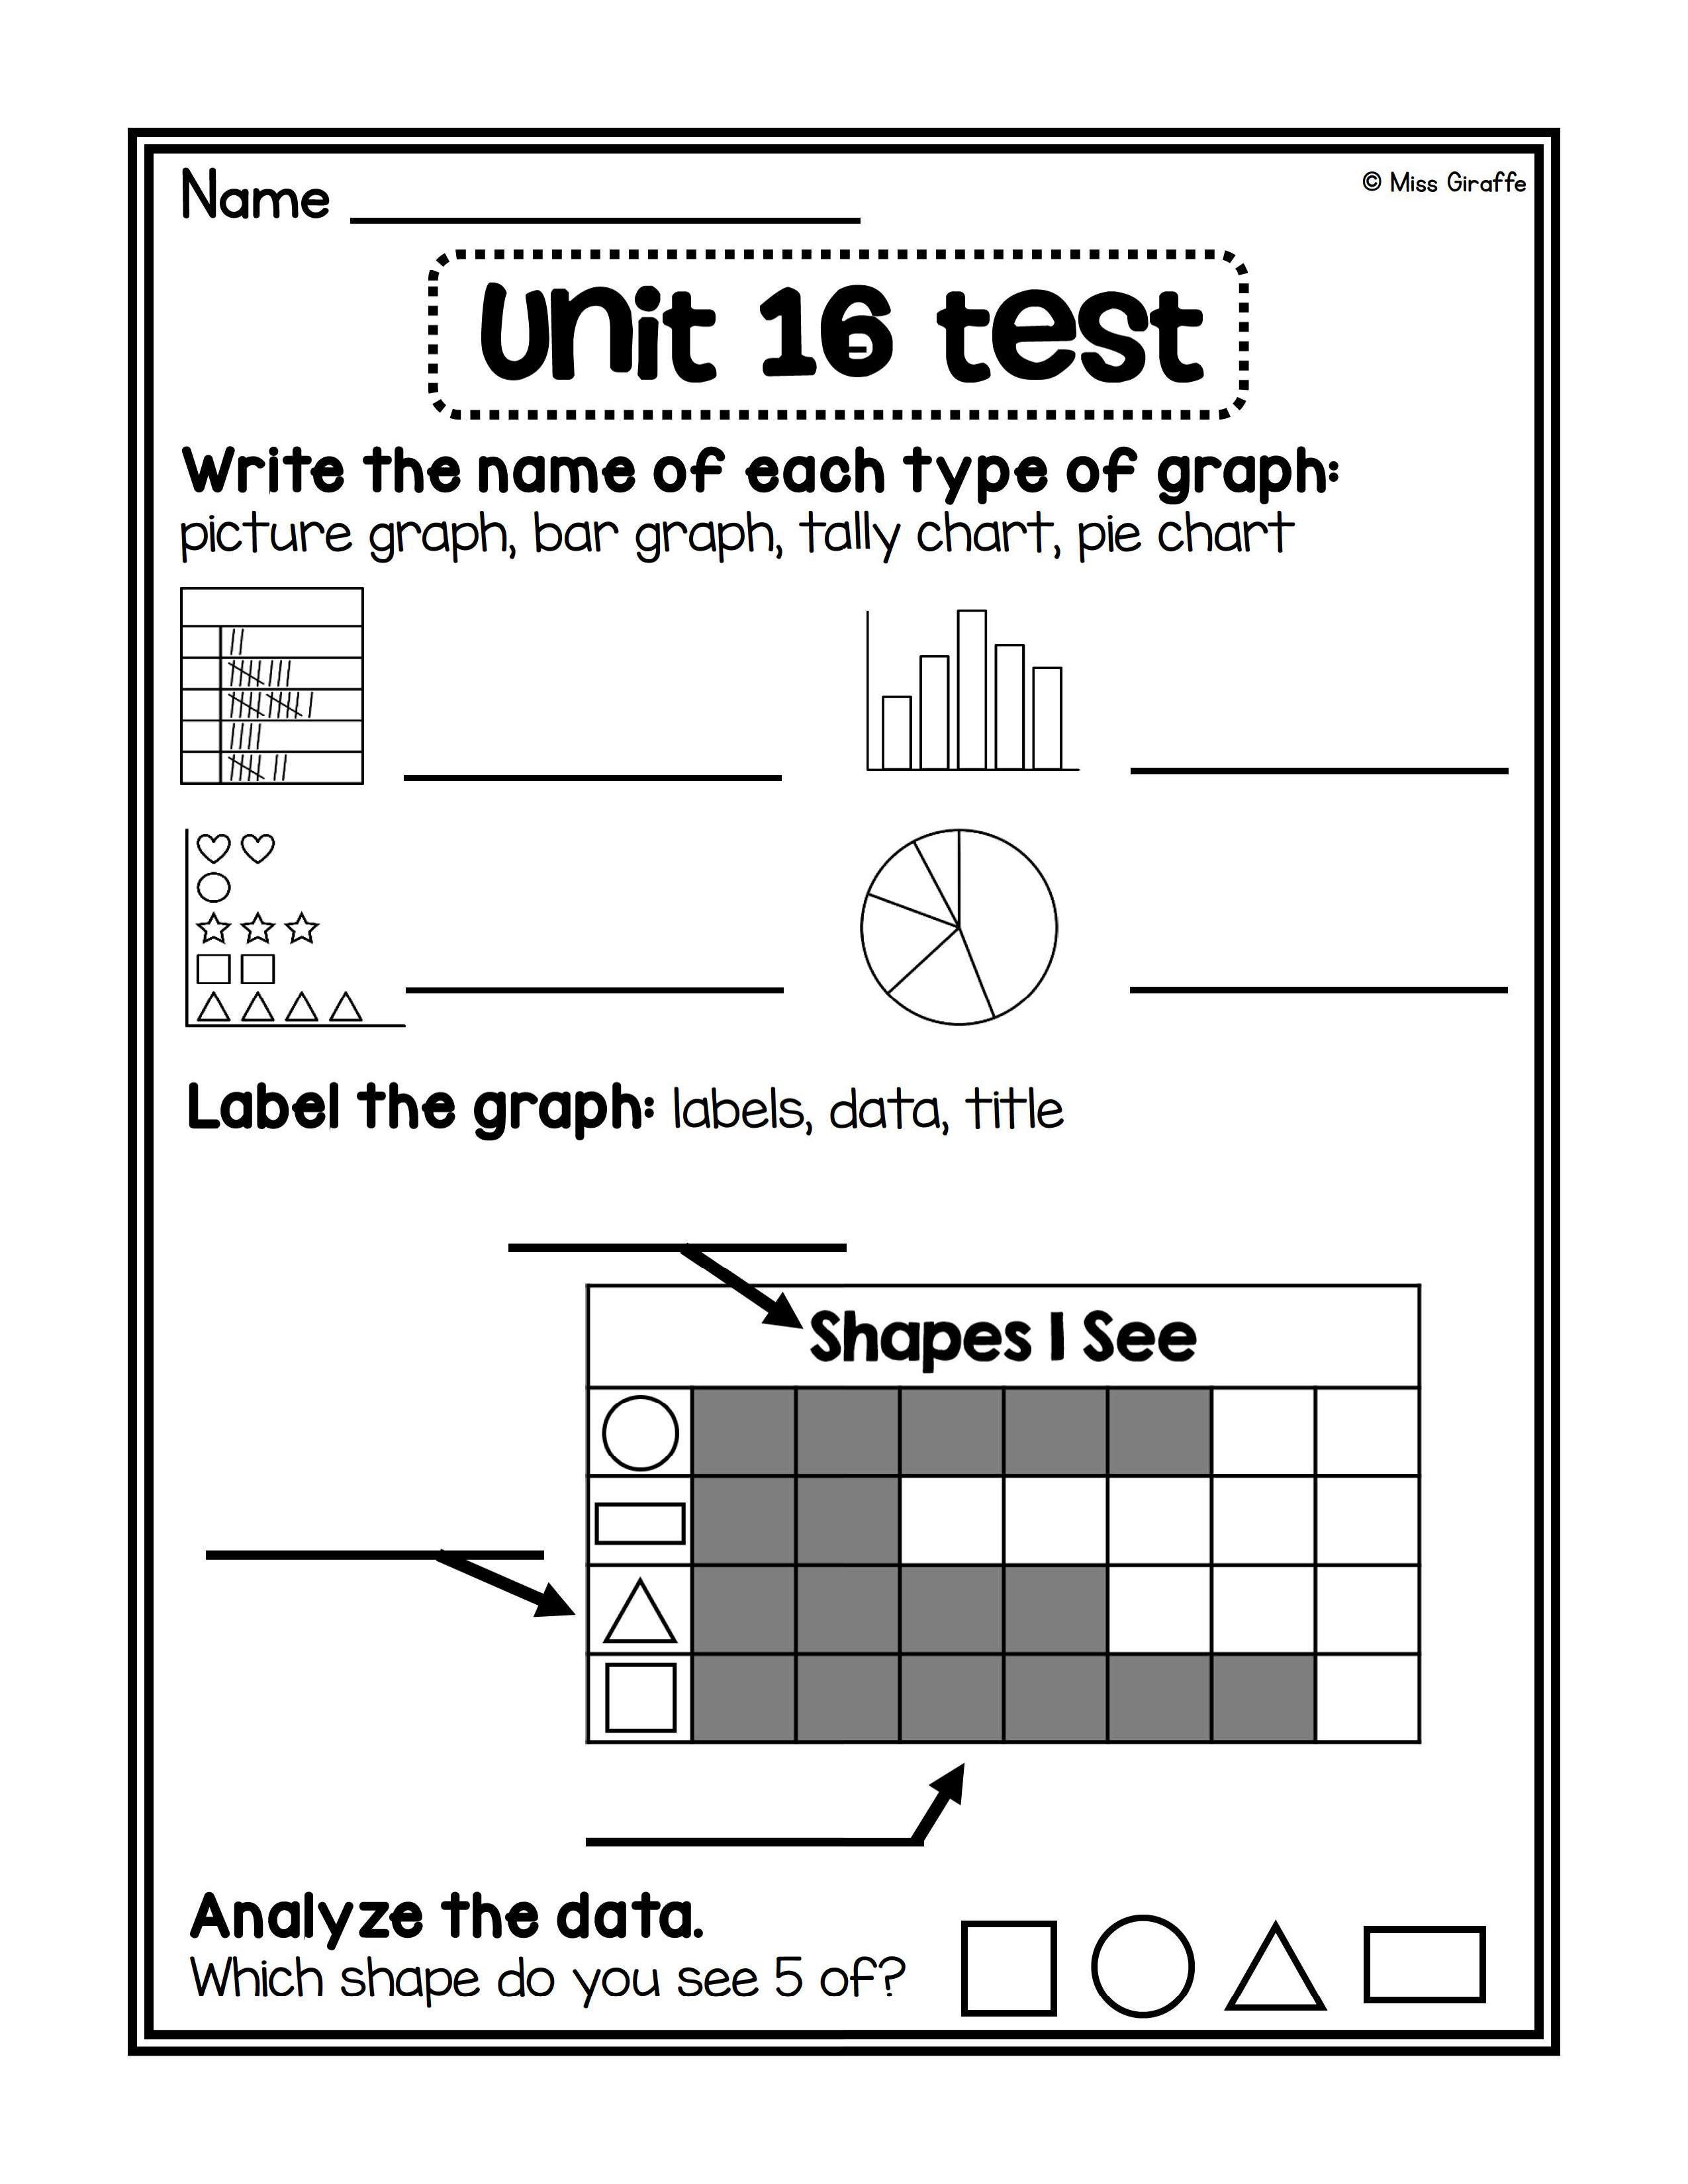
What kind of graph is this?
What kind of graph is this?
What kind of graph is this?
What kind of graph is this?
Label this part of the graph
Label this part of the graph
Label this part of the graph
Which shape do you see 5 of?