5.9 A C Module 15 Frequency Tables and Bar Graphs Test HBE
star
star
star
star
star
Posljednje ažuriranje over 6 years ago
9
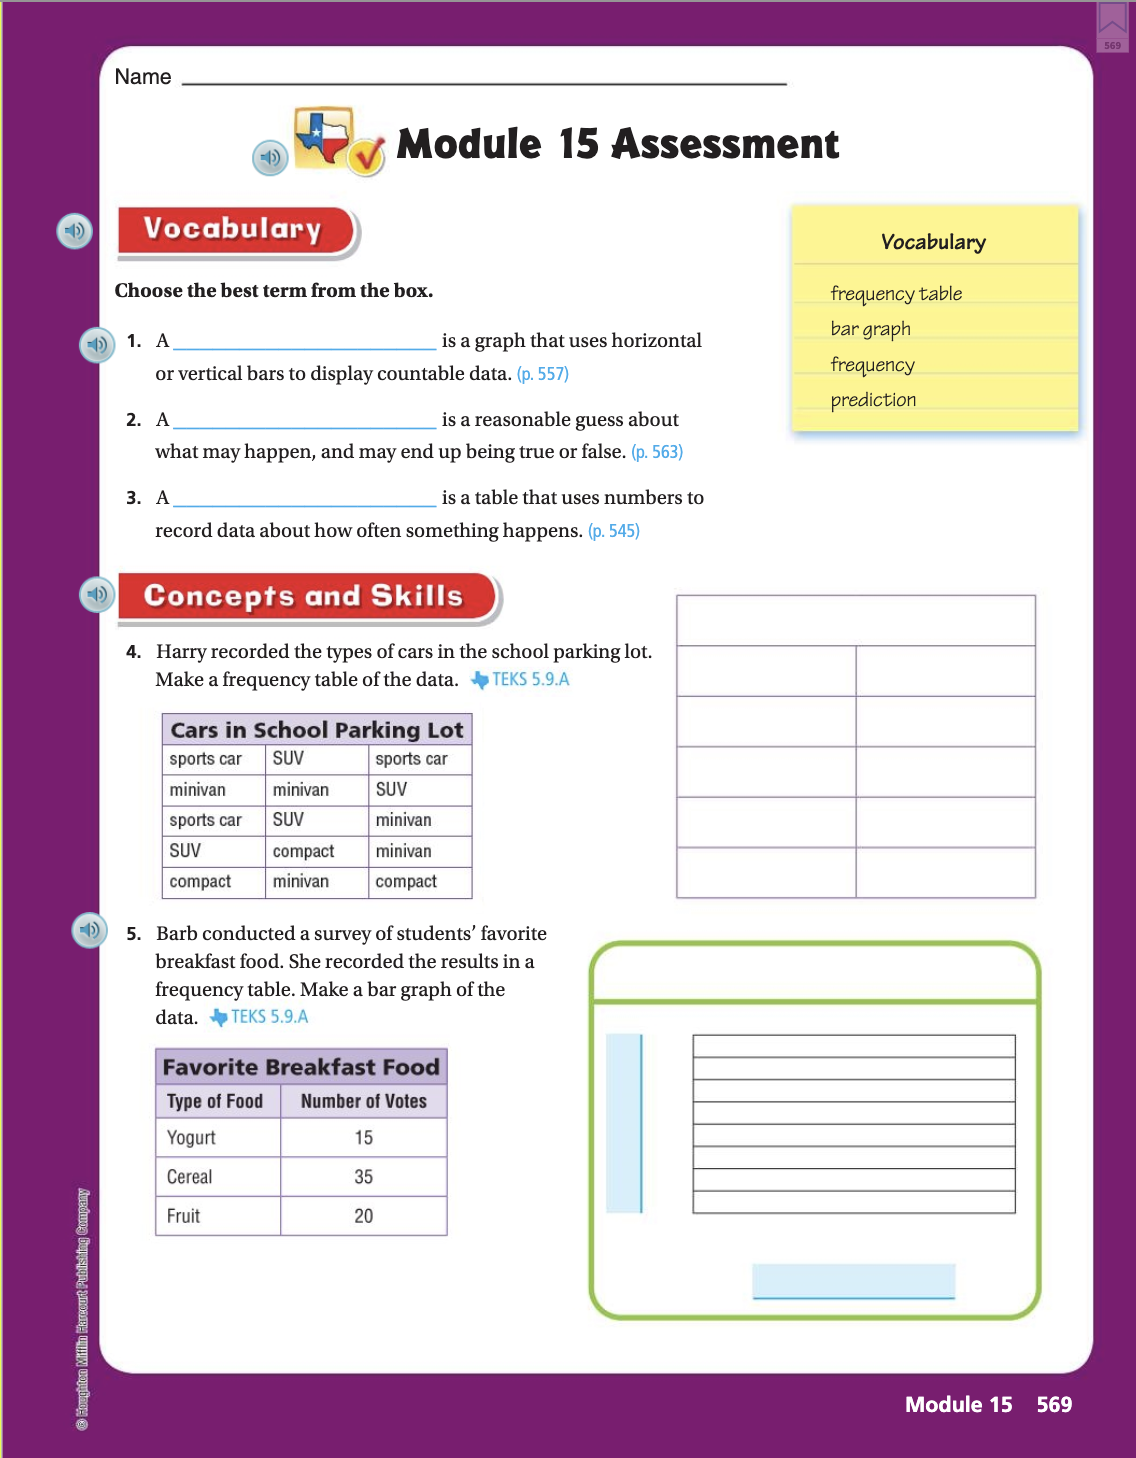
Create the frequency table. Click on "show your work" then click the "T" then click on a box to type, then click "done."
085.00
A _____ is a graph that uses horizontal or vertical bars to display countable data.
A _____ is a reasonable guess about what may happen, and may end up being true or false.
A ____ is a table that uses numbers to record data about how often something happens.
Create the bar graph. Click on "show your work" then click the "T" then click on a box to type, then click "done."
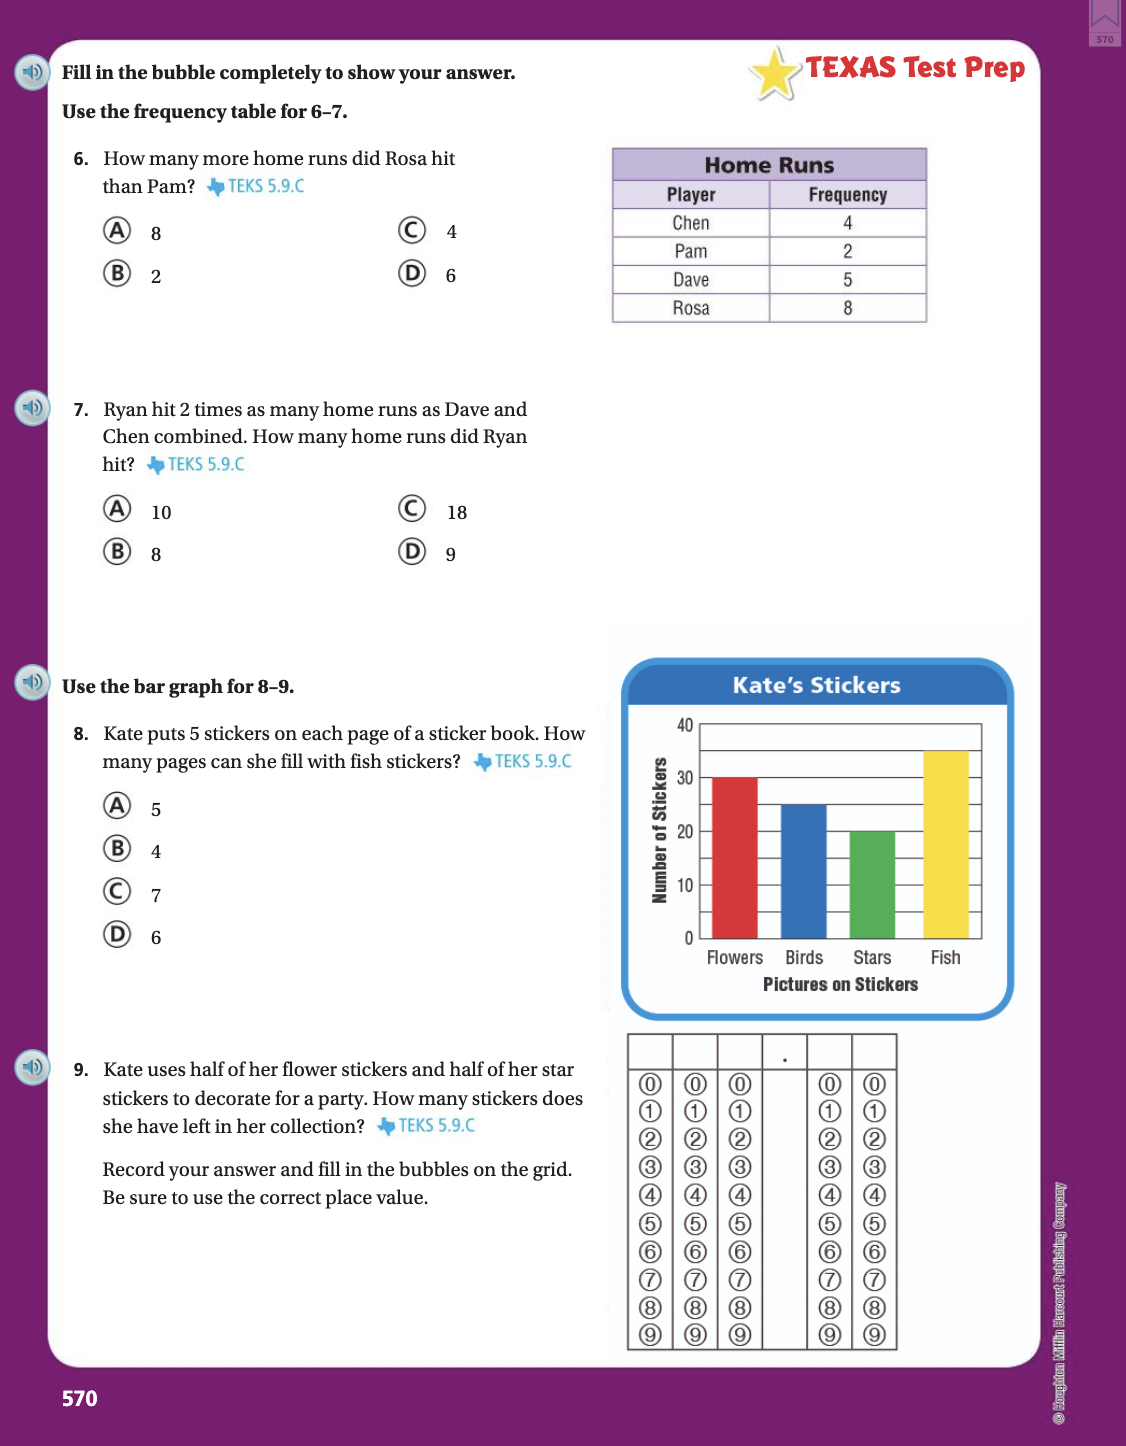
How many more home runs did Rosa hit than Pam?
Ryan hit 2 times as many home runs as Dave and Chen combined. How many runs did Ryan hit?
How many pages can she fill with fish stickers?