Unit 6 - TEST
star
star
star
star
star
Posljednje ažuriranje 3 months ago
35
1

1
1
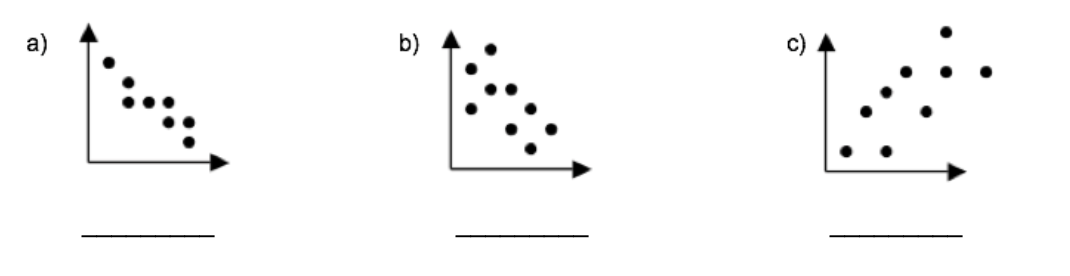
Describe the association seen on the scatterplot.
As the age of a car increases, its value decreases.
Which scatter plot best represents this relationship?

For each graph, value is the variable on the y-axis and car age is the variable on the x-axis.
What type of association is indicated in the scatterplot?
Based on these results, if a team practices 4 hours per week next season, which is the best estimate of the number of debates the team can expect to win?

Choose the BEST answer
Which of the following most closely approximates the equation of the line of best fit for the data?
FEEL FREE TO DRAW A LINE OF BEST FIT IN THE SHOW YOUR WORK SPACE TO HELP YOU ANSWER THIS QUESTION!
Describe the association seen on the scatterplot.
Describe the association seen on the scatterplot.
Talk about what the slope means in this problem!
Use the value in your explanation!
Talk about what the y-intercept means in the problem!
Use the value in your explanation!
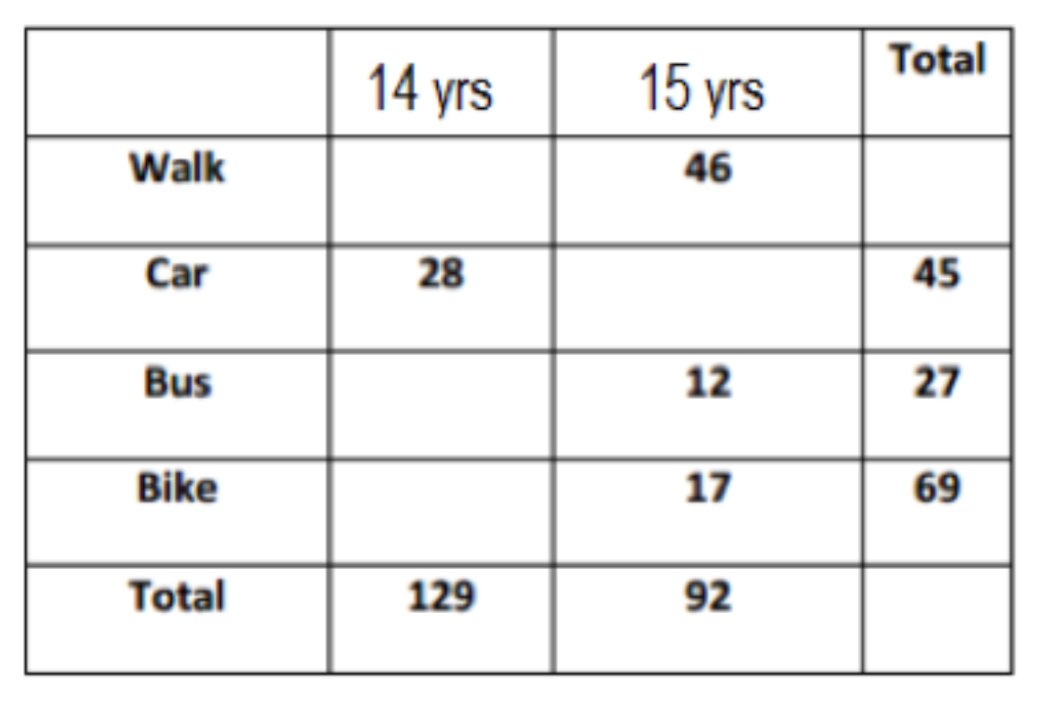
Use this space to fill the table first.
What percentage of 14 year-olds walk to school?
Enter a percentage like 50%. Round your answer to the nearest whole percentage.
What percentage of 15 year-olds walk to school?
Enter a percentage like 50%. Round your answer to the nearest whole percentage.
What percentage of students who walk to school are 15 year-olds?
Enter a percentage like 50%. Round your answer to the nearest whole percentage.
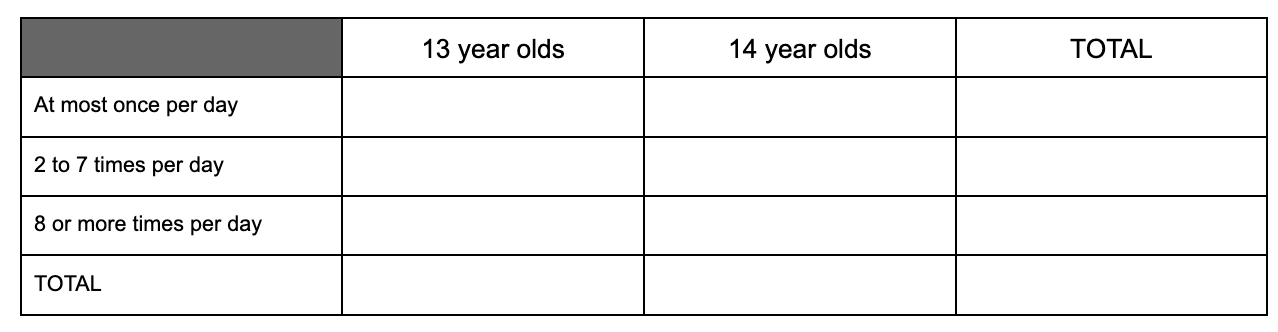
Students were asked to report their age and how many times a day they typically wash their hands.
Of the 738 13 year-olds, 66 said they wash their hands at most once a day, 583 said two to seven times per day, and 89 said eight or more times per day.
Of the 14 year-olds, 2 said they wash their hands at most once a day, 160 said two to seven times per day, and 42 said eight or more times per day.
Use this space to fill that table first.
What percentage of those surveyed are 14 years old?
Enter a percentage like 70%. Round your answer to the nearest whole percentage.
What percentage of those who wash their hands 8 or more times per day are 13 year olds?
Enter a percentage like 70%. Round your answer to the nearest whole percentage.
What is the percentage that those who are 13 wash their hands 8 or more times a day?
Enter a percentage like 70%. Round your answer to the nearest whole percentage.
