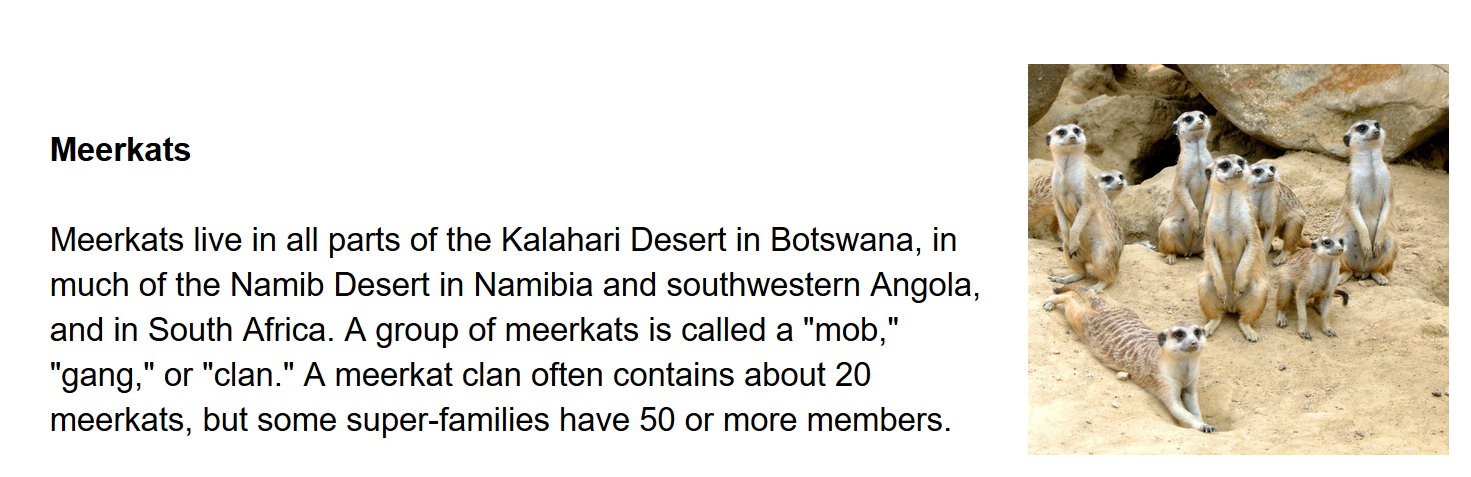
Meerkat Graph
star
star
star
star
star
Last updated over 6 years ago
7 Nsɛmmisa
Hyɛ no nsow a efi ɔkyerɛwfo no hɔ:
Coordinate Plane
1
1
1
1
1
1
1
Coordinate Plane
The following table shows the height of a typical meerkat at different times during the first 20 months of life. Use the text tool to fill in the missing ordered pairs.
Graph the meerkat heights from the ordered pairs you made in the last question. You may want to write them down on paper so you don't have to switch your screen a lot.
Should the points on the graph be connected? Explain why or why not.
What does the point (0, 3) mean for a typical meerkat's height?
How tall do you think a typical meerkat gets? Why?
At what age do meerkats reach their full height? How do you know from this graph?
If this graph were about a human instead of a meerkat, at what age do you think the height would stop increasing?