5.9 C Module 16 Data Analysis with bonus Test HBE
star
star
star
star
star
Last updated over 6 years ago
11 Nsɛmmisa
1
5.9.A
1
5.9.C
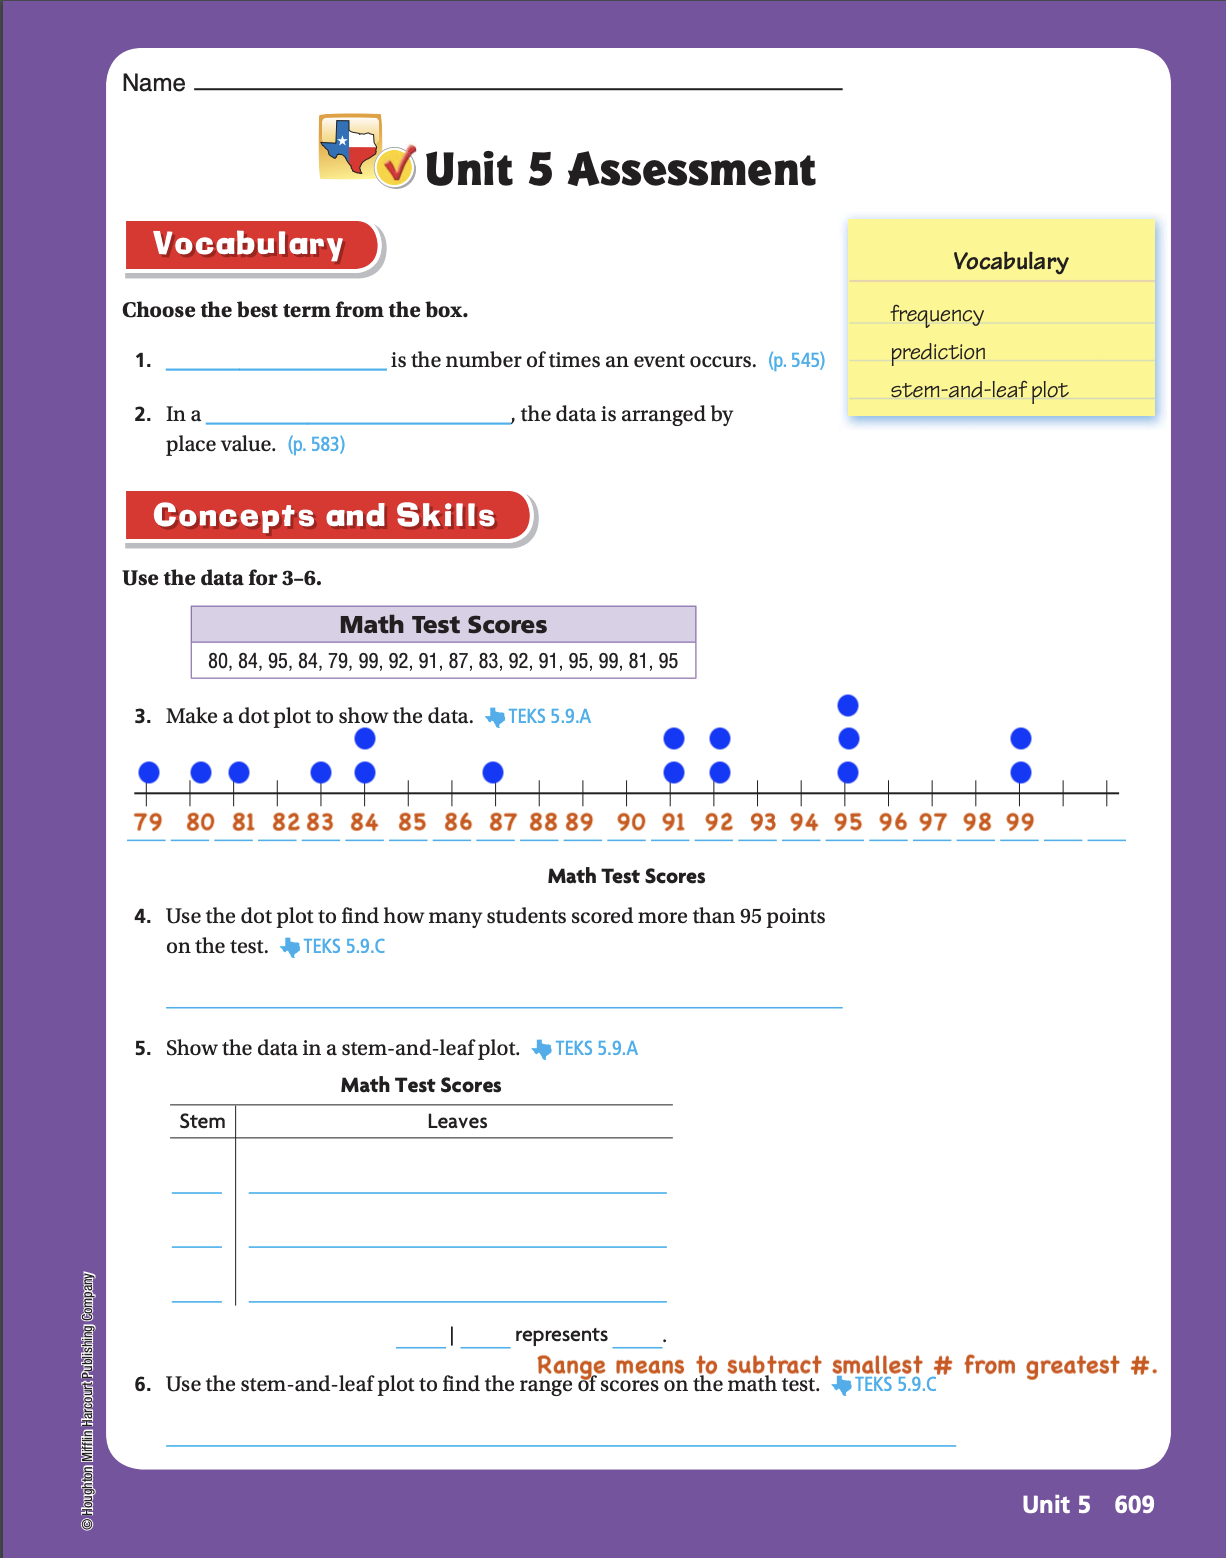
_______is the number of times an event occurs.
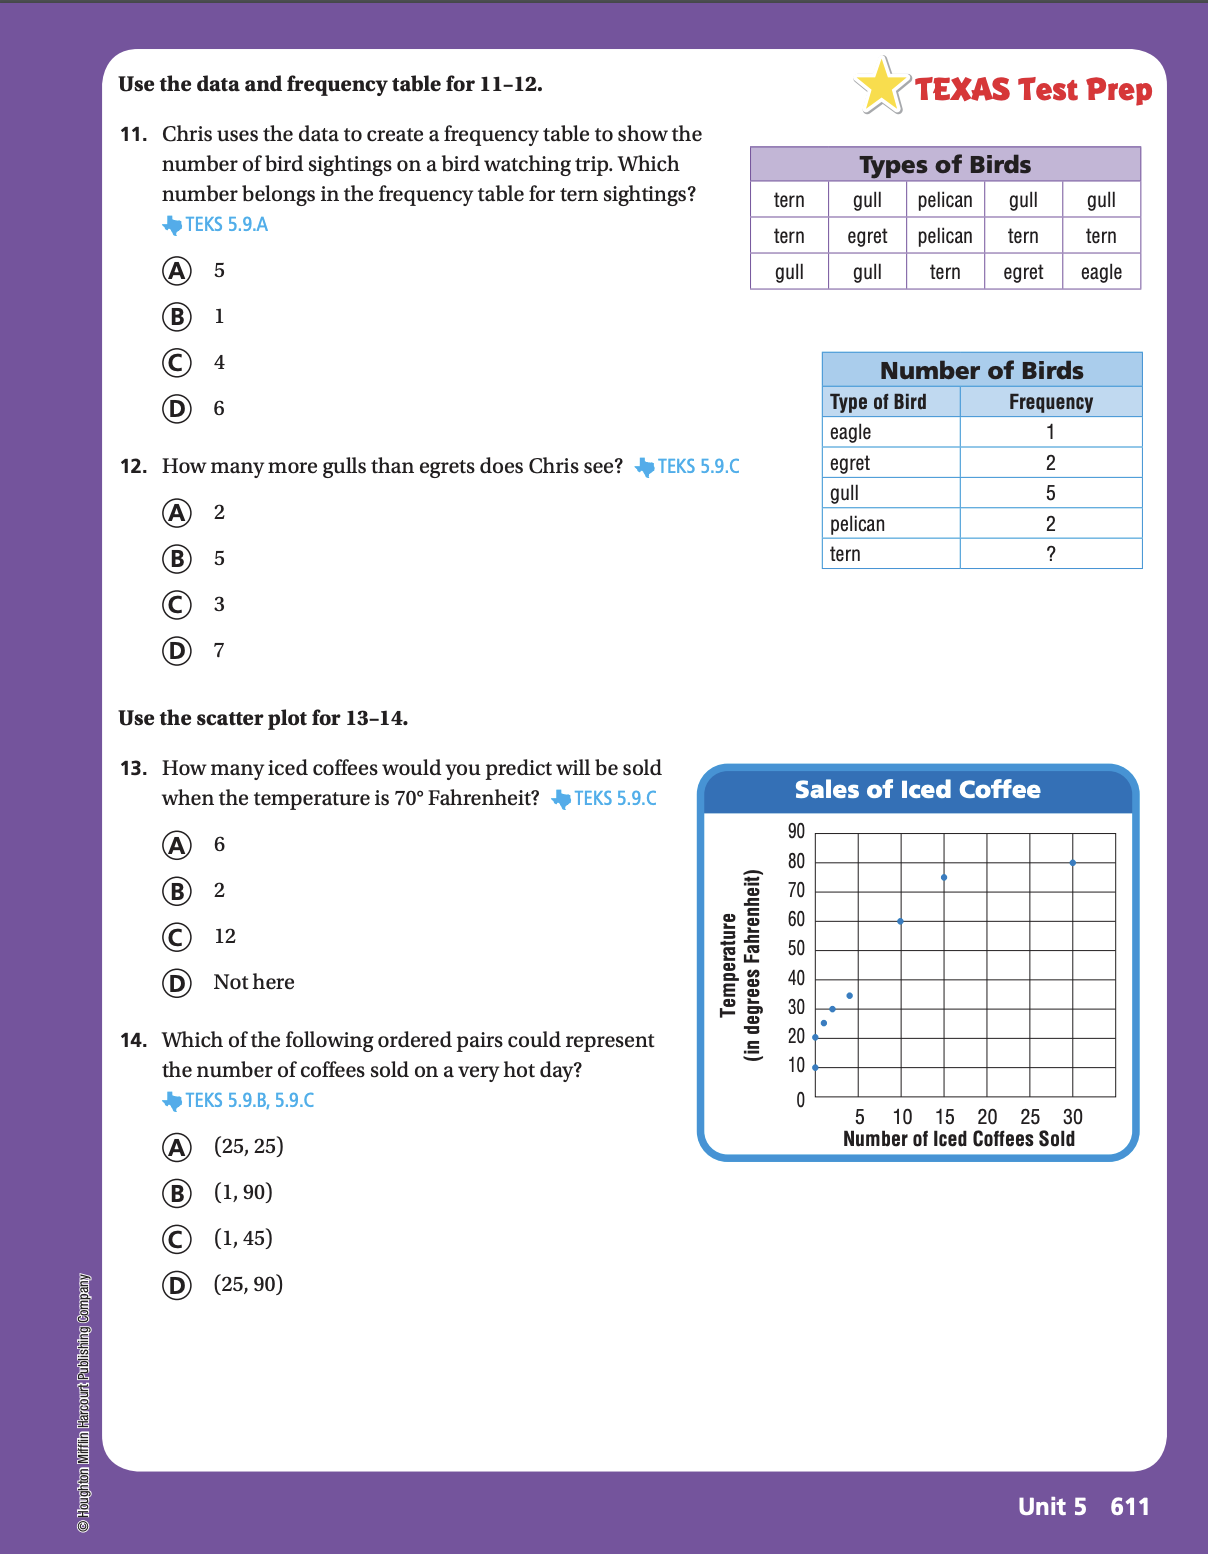
Which number belongs in the frequency table for tern sightings?
How many iced coffees would you predict will be sold when the temperature is 70* Farenheit?
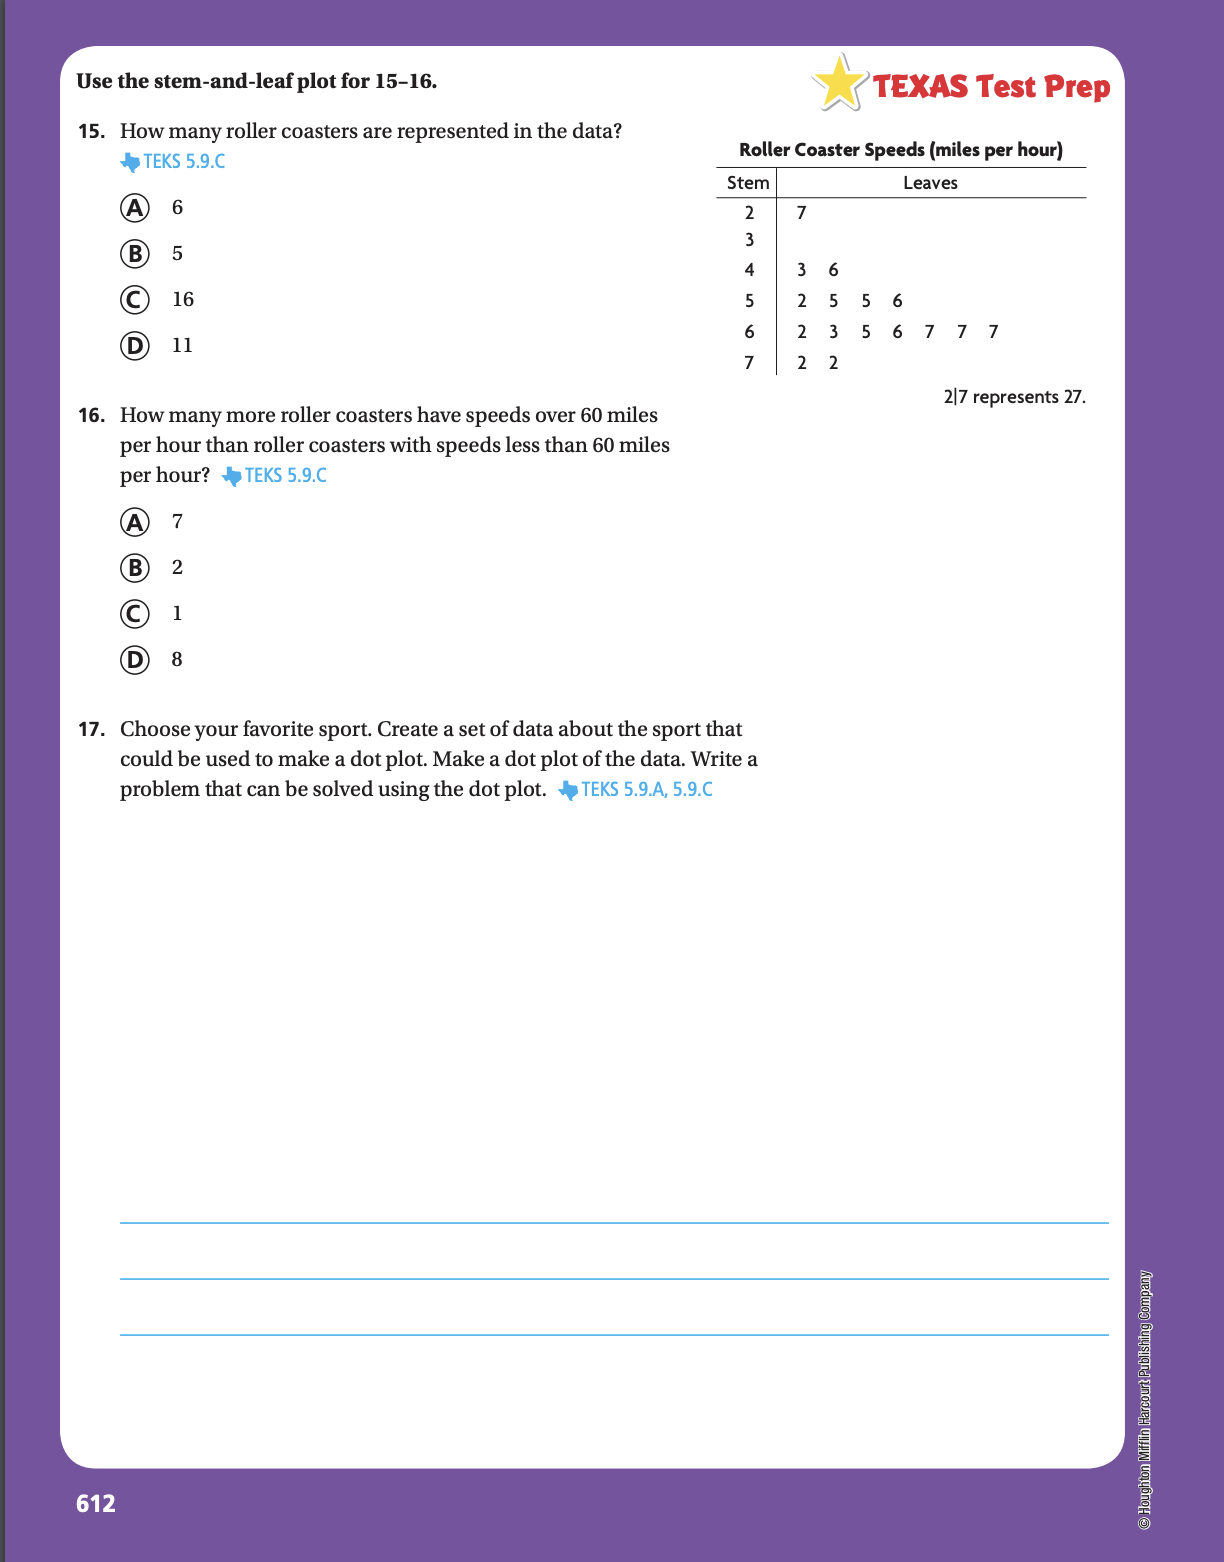
How many roller coasters are represented in the data?
How many students scored more than 95 points on the test?
Use the stem-and-leaf plot to find the range of scores on the math test.
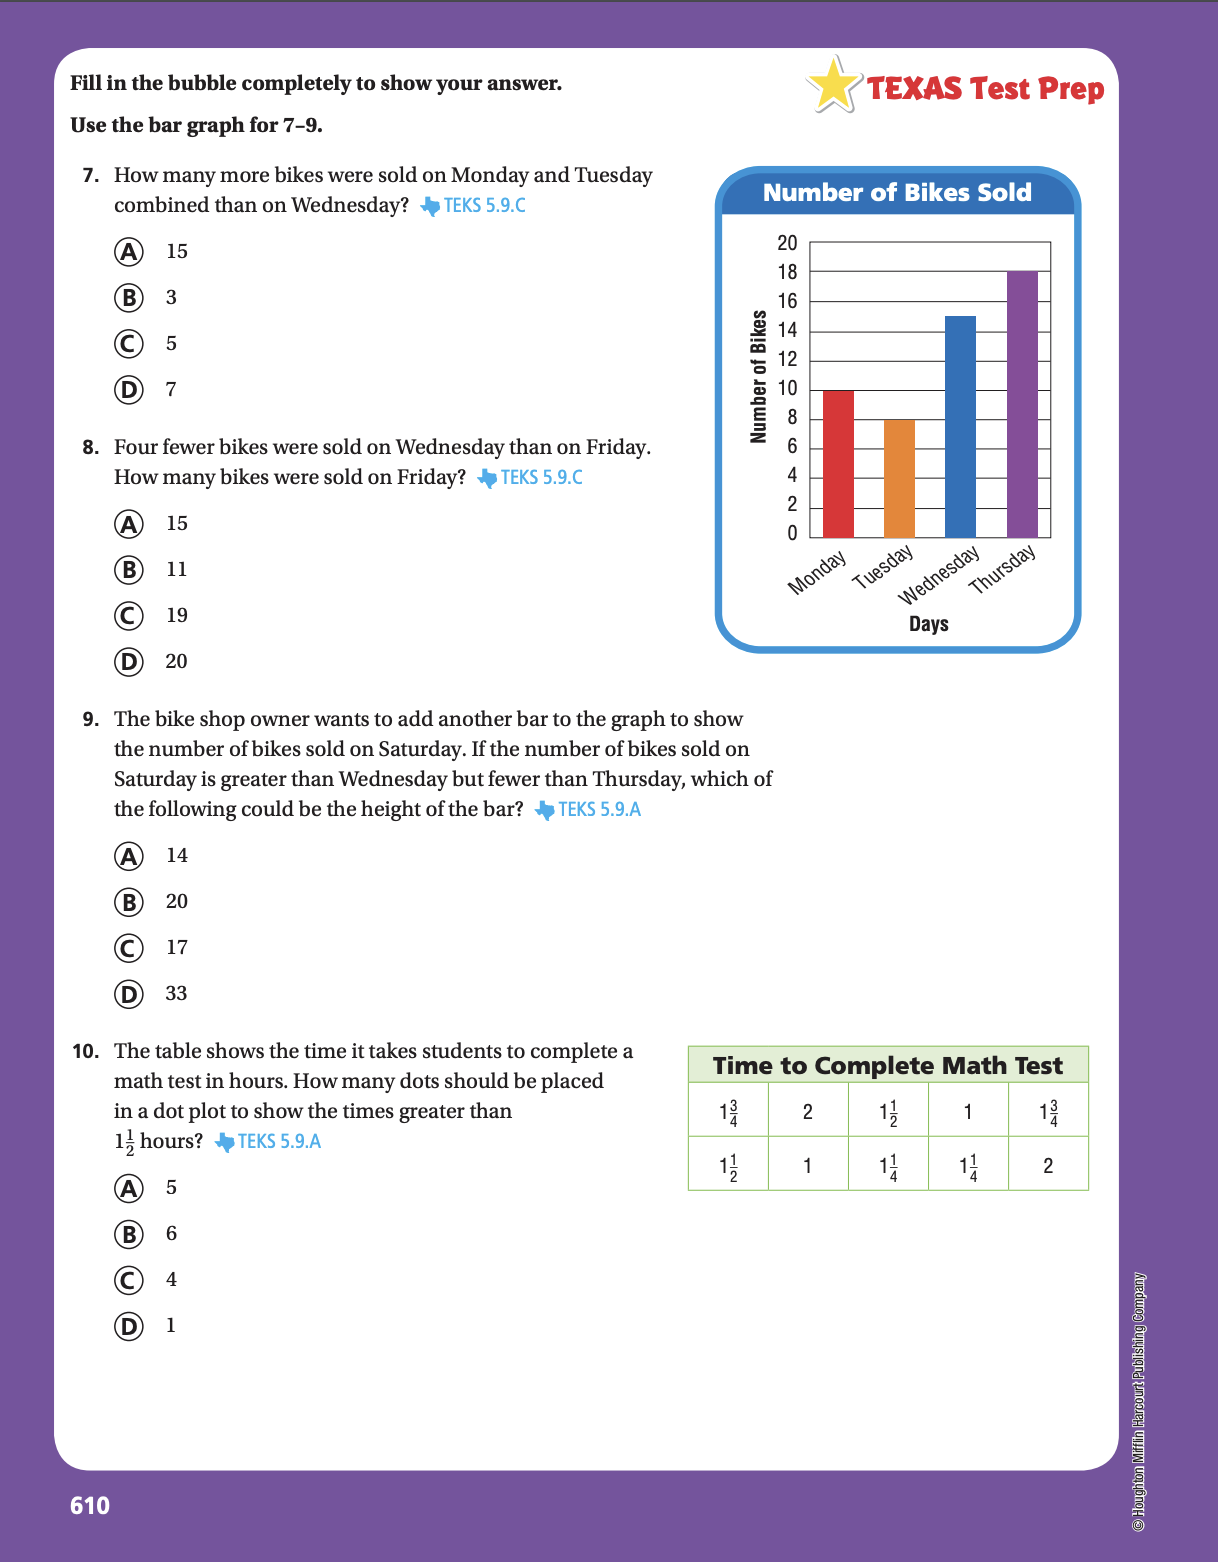
How many more bikes were sold on Monday and Tuesday than on Wednesday?
Which of the following could be the height of the bar?
How many dots should be placed in a dot plot to show the times greater than 1 1/2 hours?
BONUS QUESTION: Create a frequency table with data then create a dot plot of the data. CLICK EDIT BACKGROUND TO DRAW AND TYPE.