Algebra 2H: Rational Functions and Their Graphs
star
star
star
star
star
Last updated over 6 years ago
31 Nsɛmmisa


20
A.APR.3
20
A.APR.3
10


20
A.APR.3
20
A.APR.3


10
A.APR.3
10
F.BF.4.a
10
10
A.SSE.3.a
10
A.SSE.3.a

10
10
100
10
A.APR.3
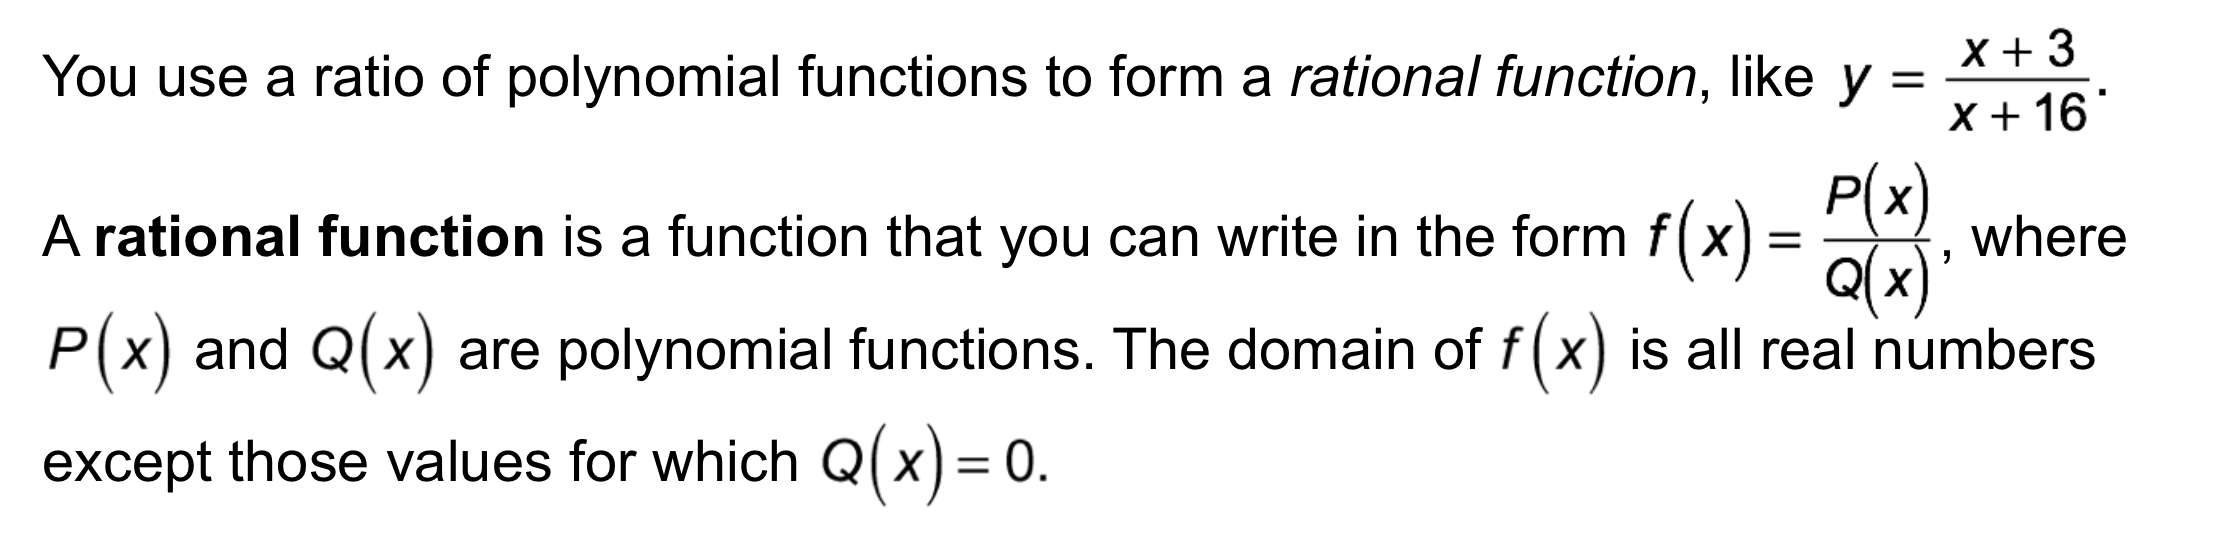
Consider the rational functions on the right.
Use the items on the left to identify each function's:
◆ Domain
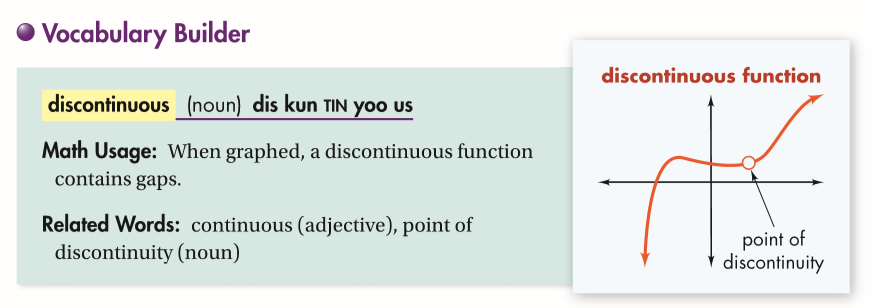
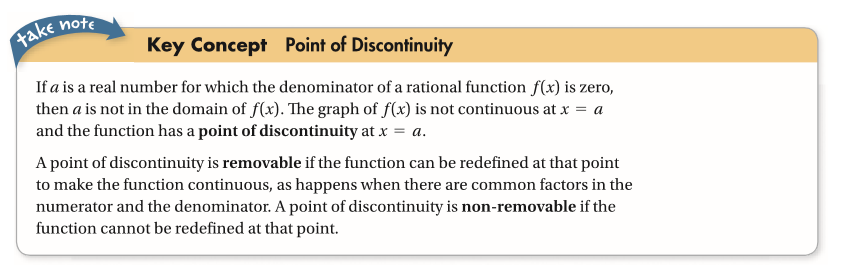
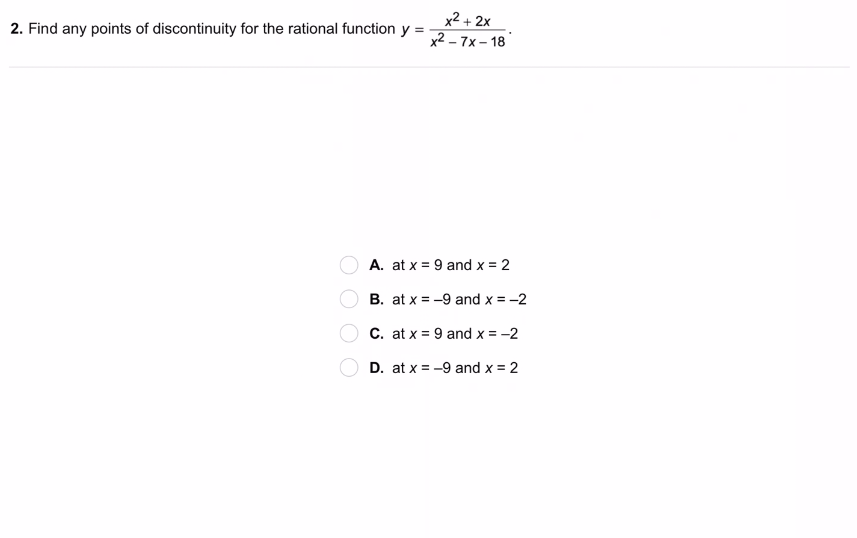
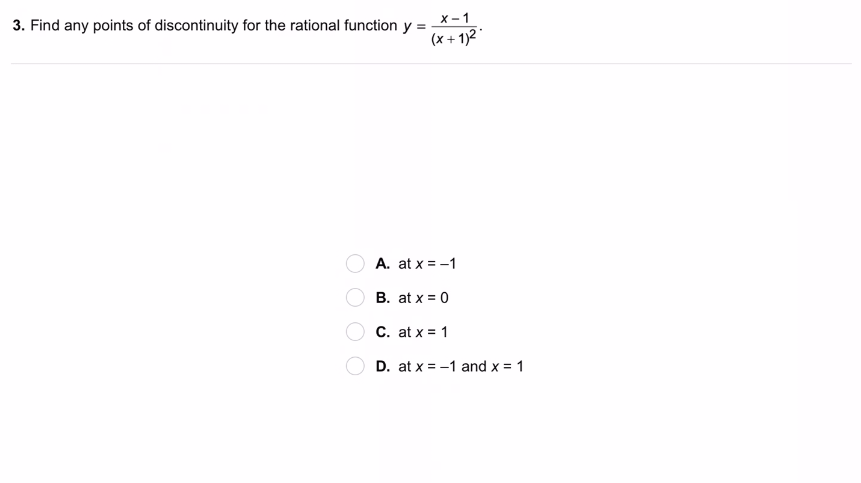
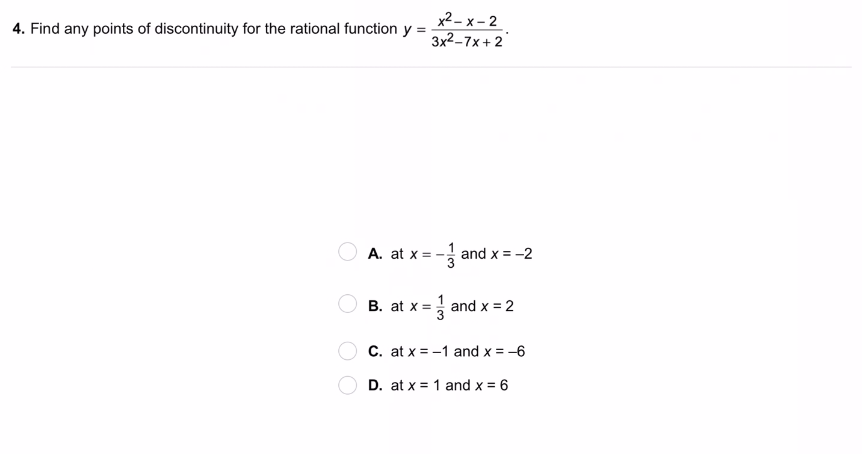
◆ Points of discontinuity (and the type of discontinuity each represents: removable or non-removable)
◆ x- and y- intercepts
domain: all real numbers
domain: all real numbers except x = ±4
domain: all real numbers except x = -2, -1
no points of discontinuity
non-removable discontinuity at x = ±4
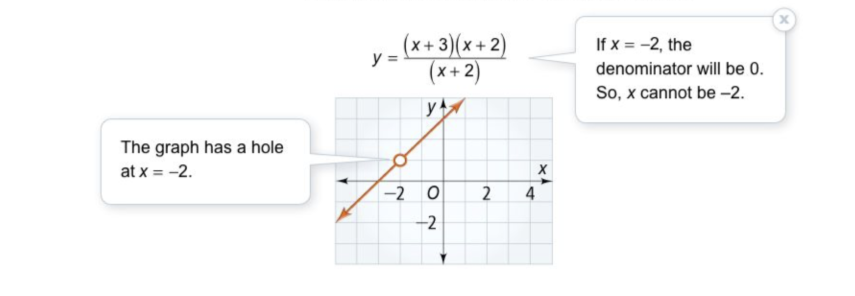
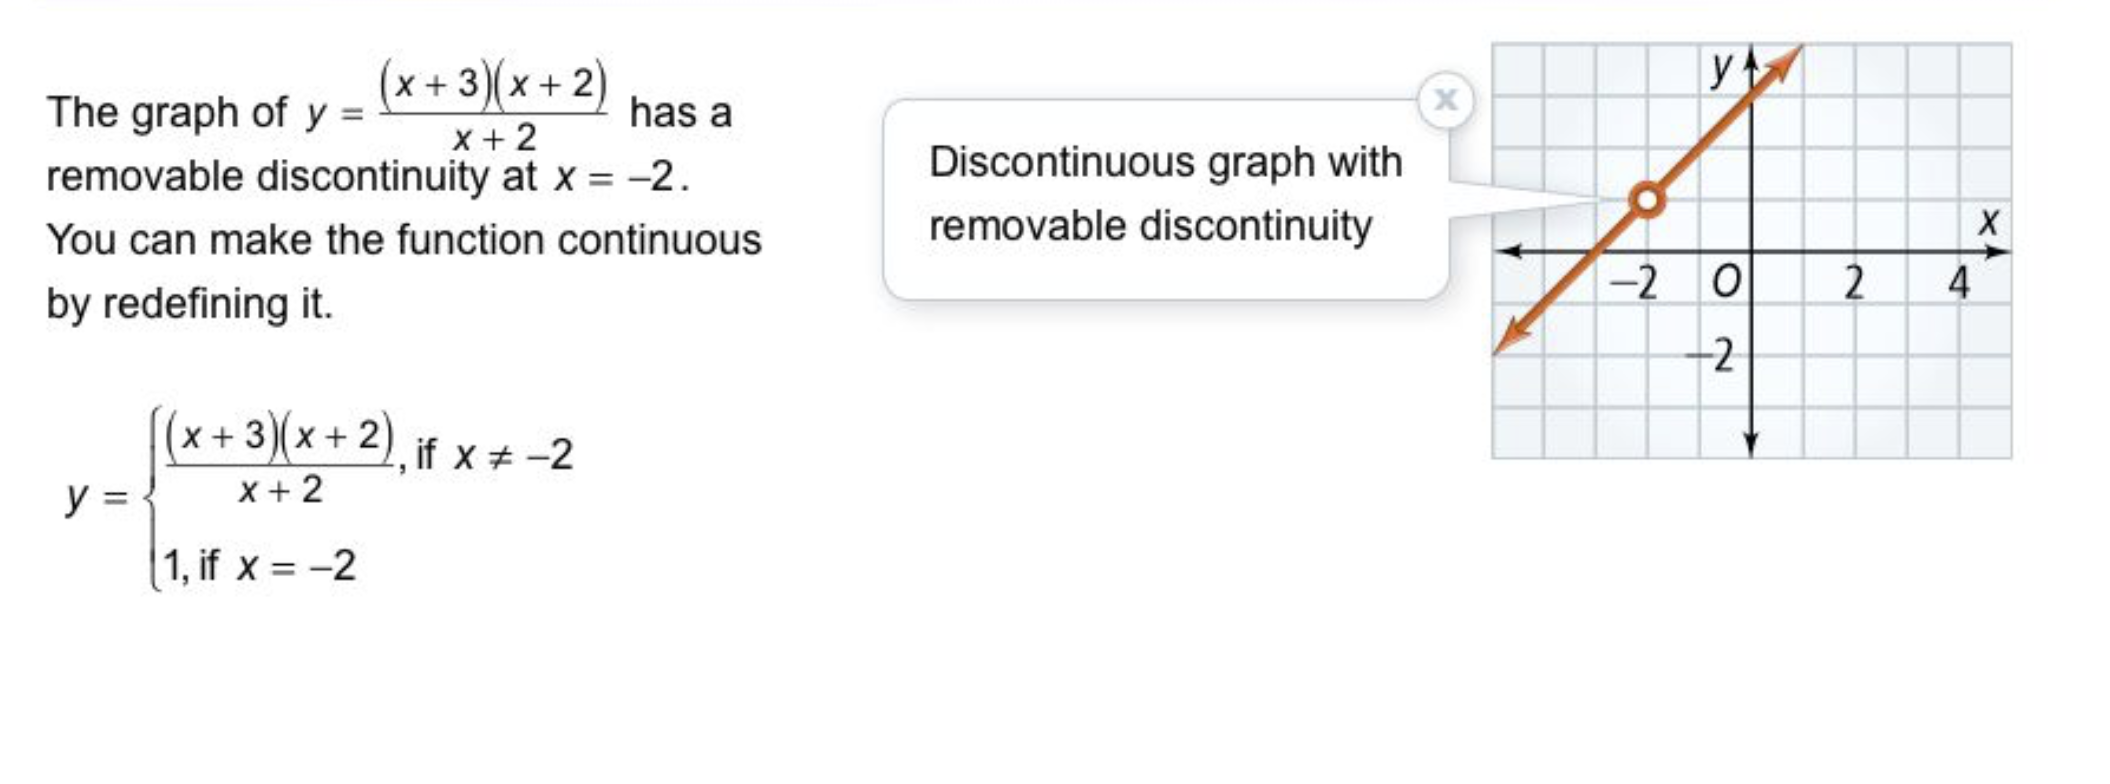
removable discontinuity at x = -2
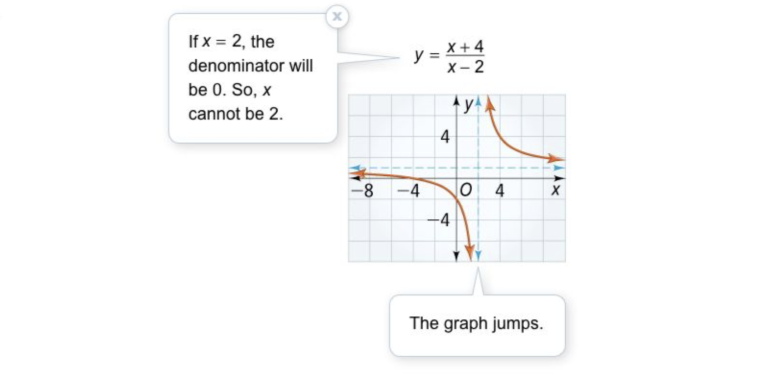
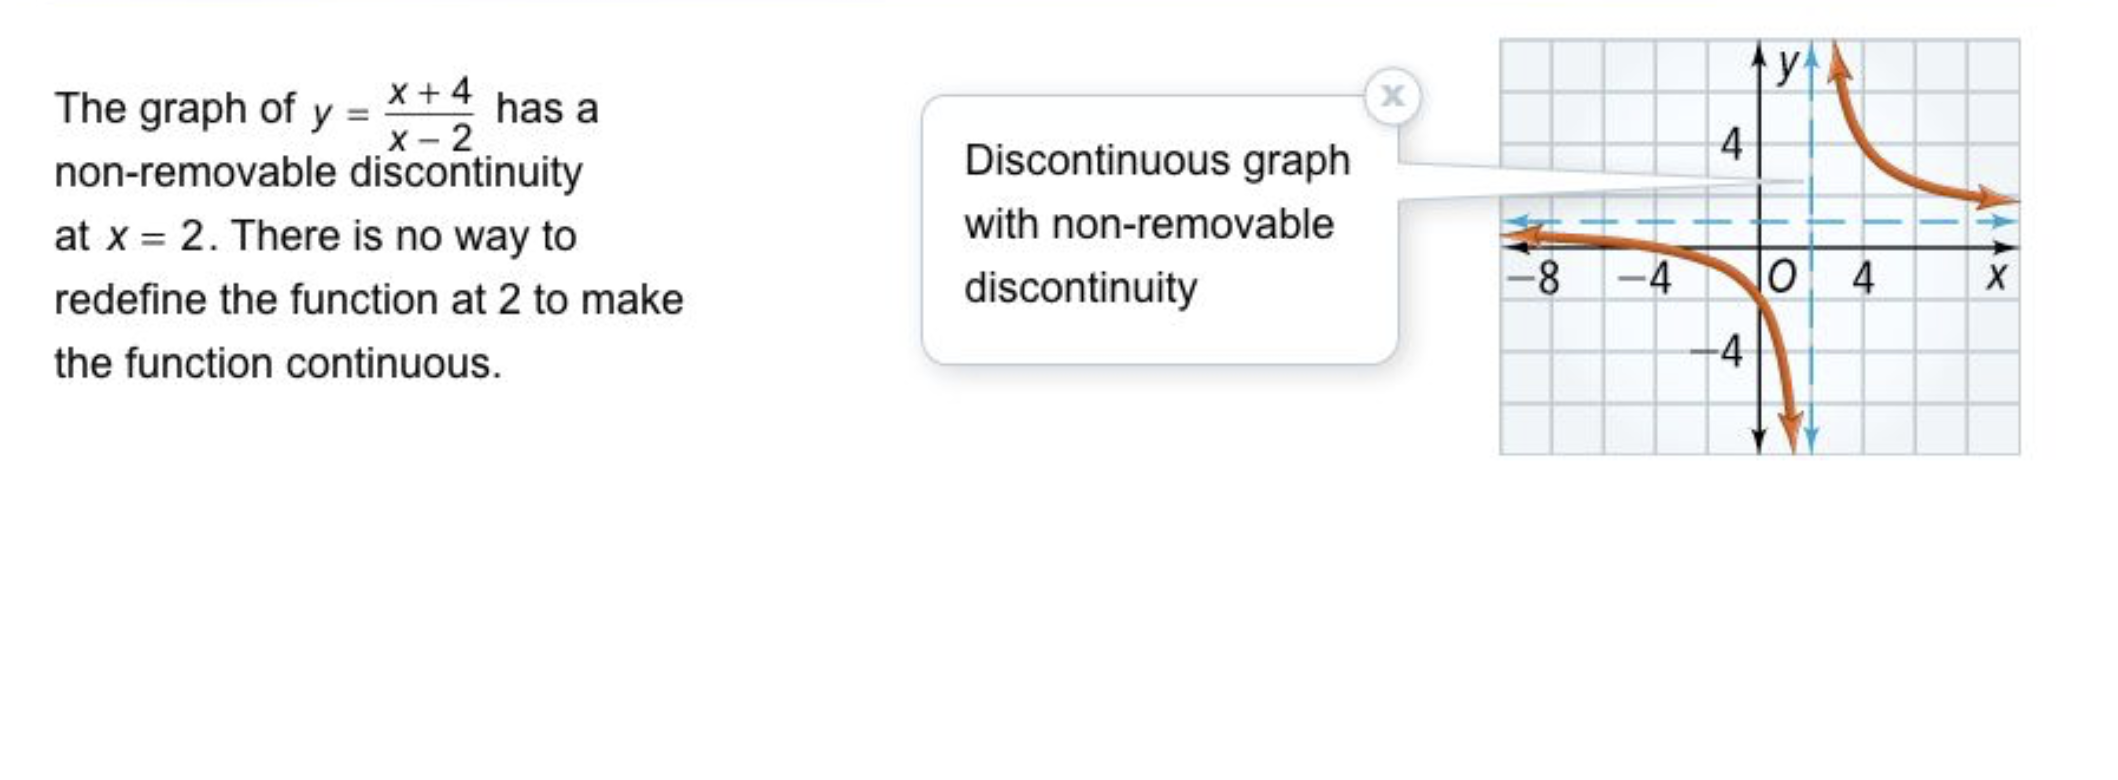
non-removable discontinuity at x = -2
removable discontinuity at x = -1
no x-intercept
x-intercept: (1, 0)
x-intercept: (-1, 0)
y-intercept: (0, -1/16)
y-intercept: (0, 1/2)
y-intercept: (0, -1/3)
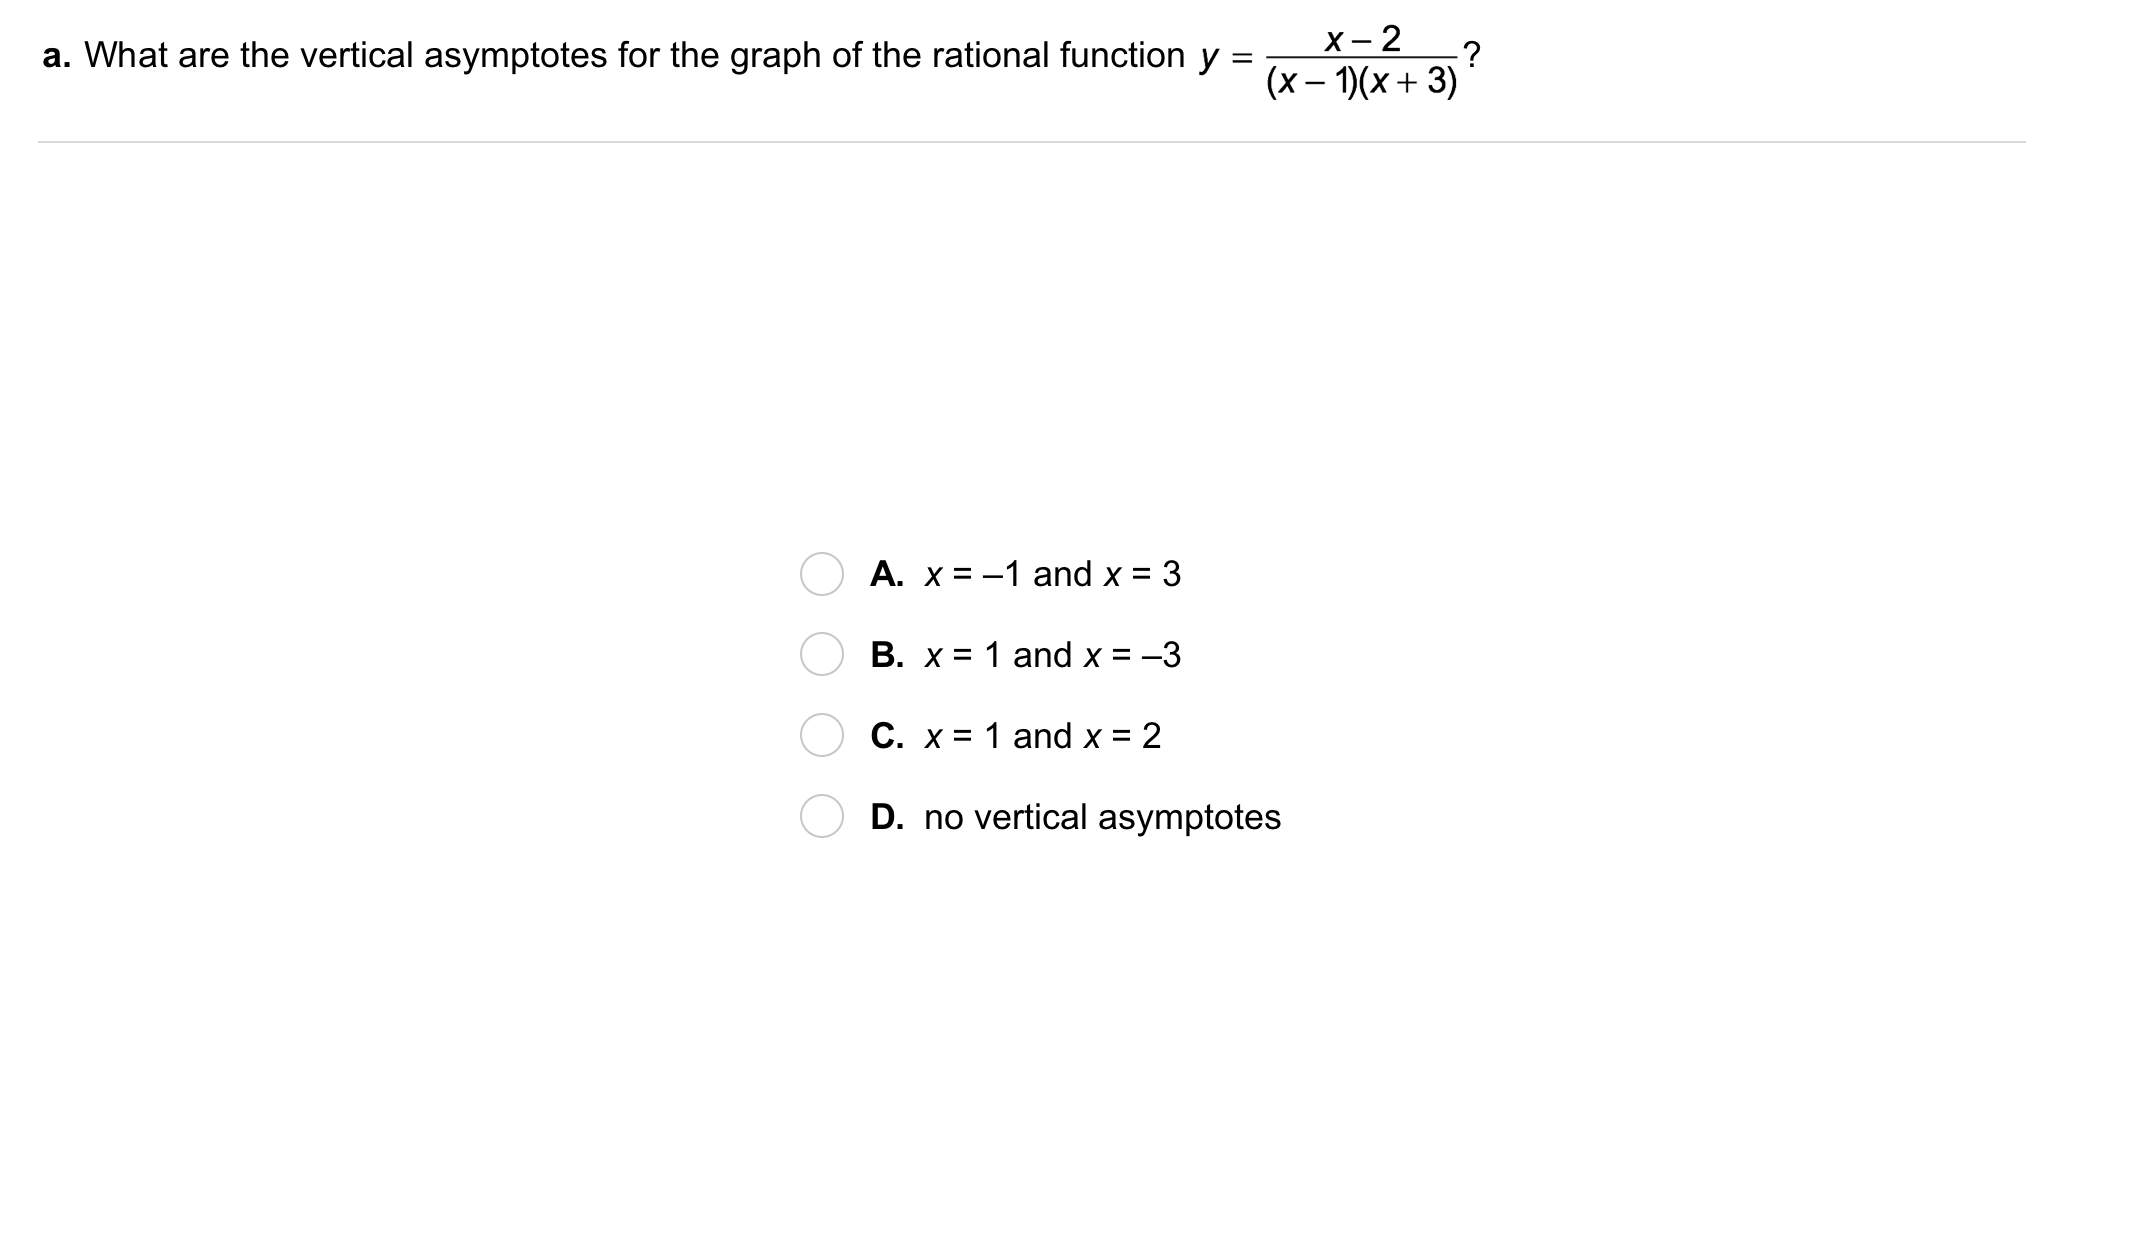
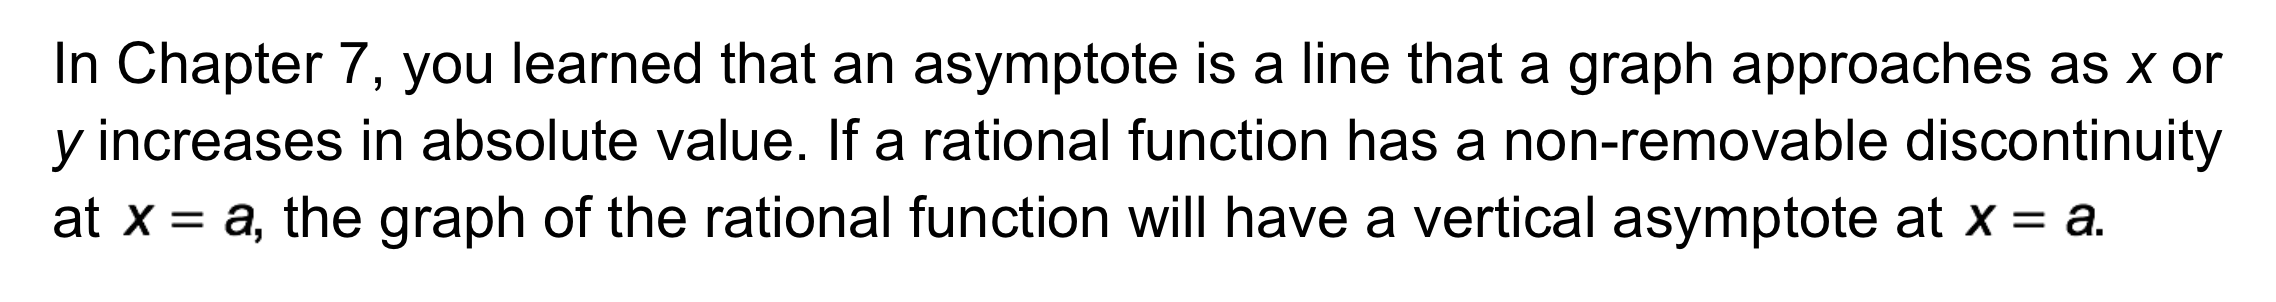
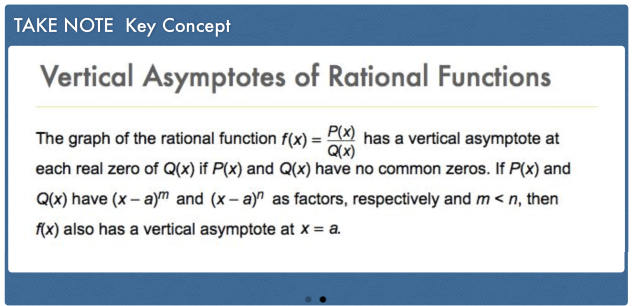
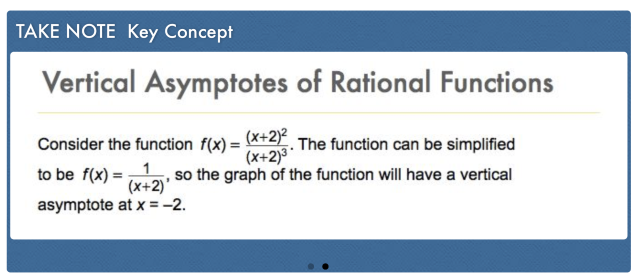
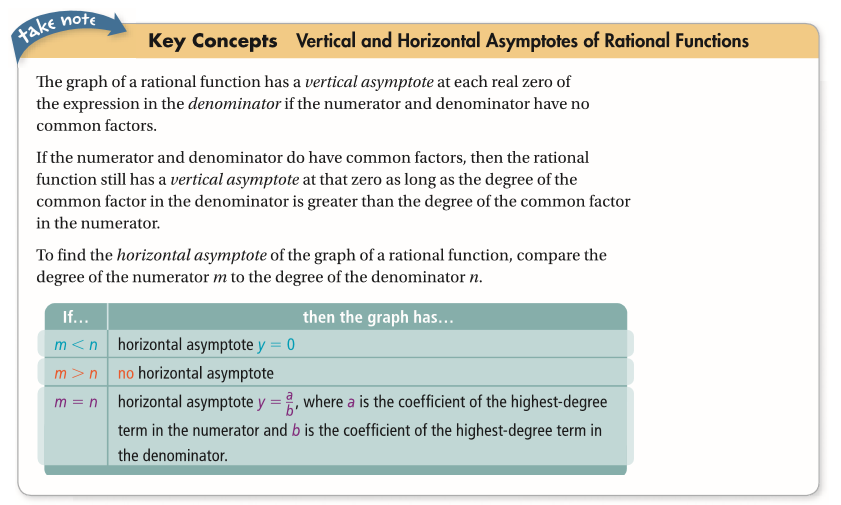
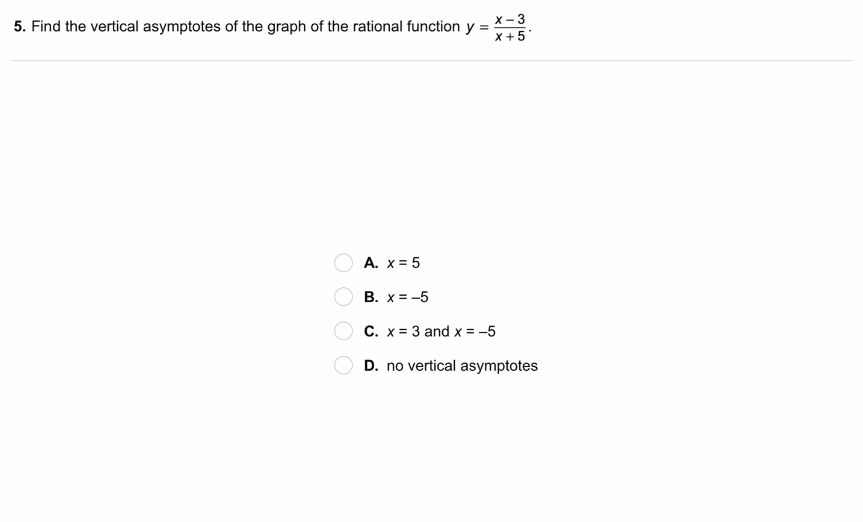
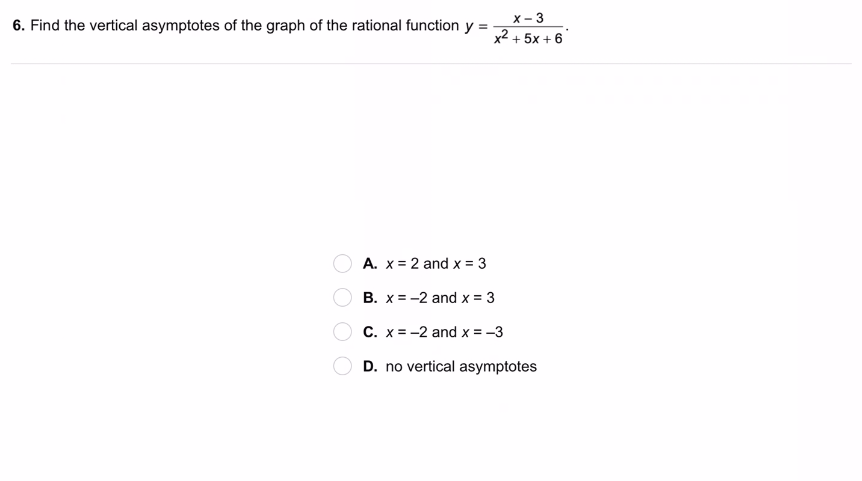
What are the vertical asymptotes for the graph of the function?

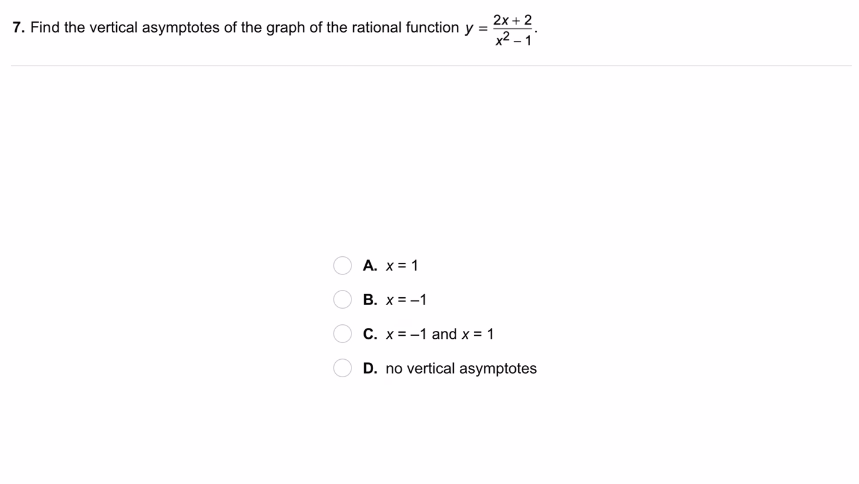
What are the vertical asymptotes for the graph of the function?
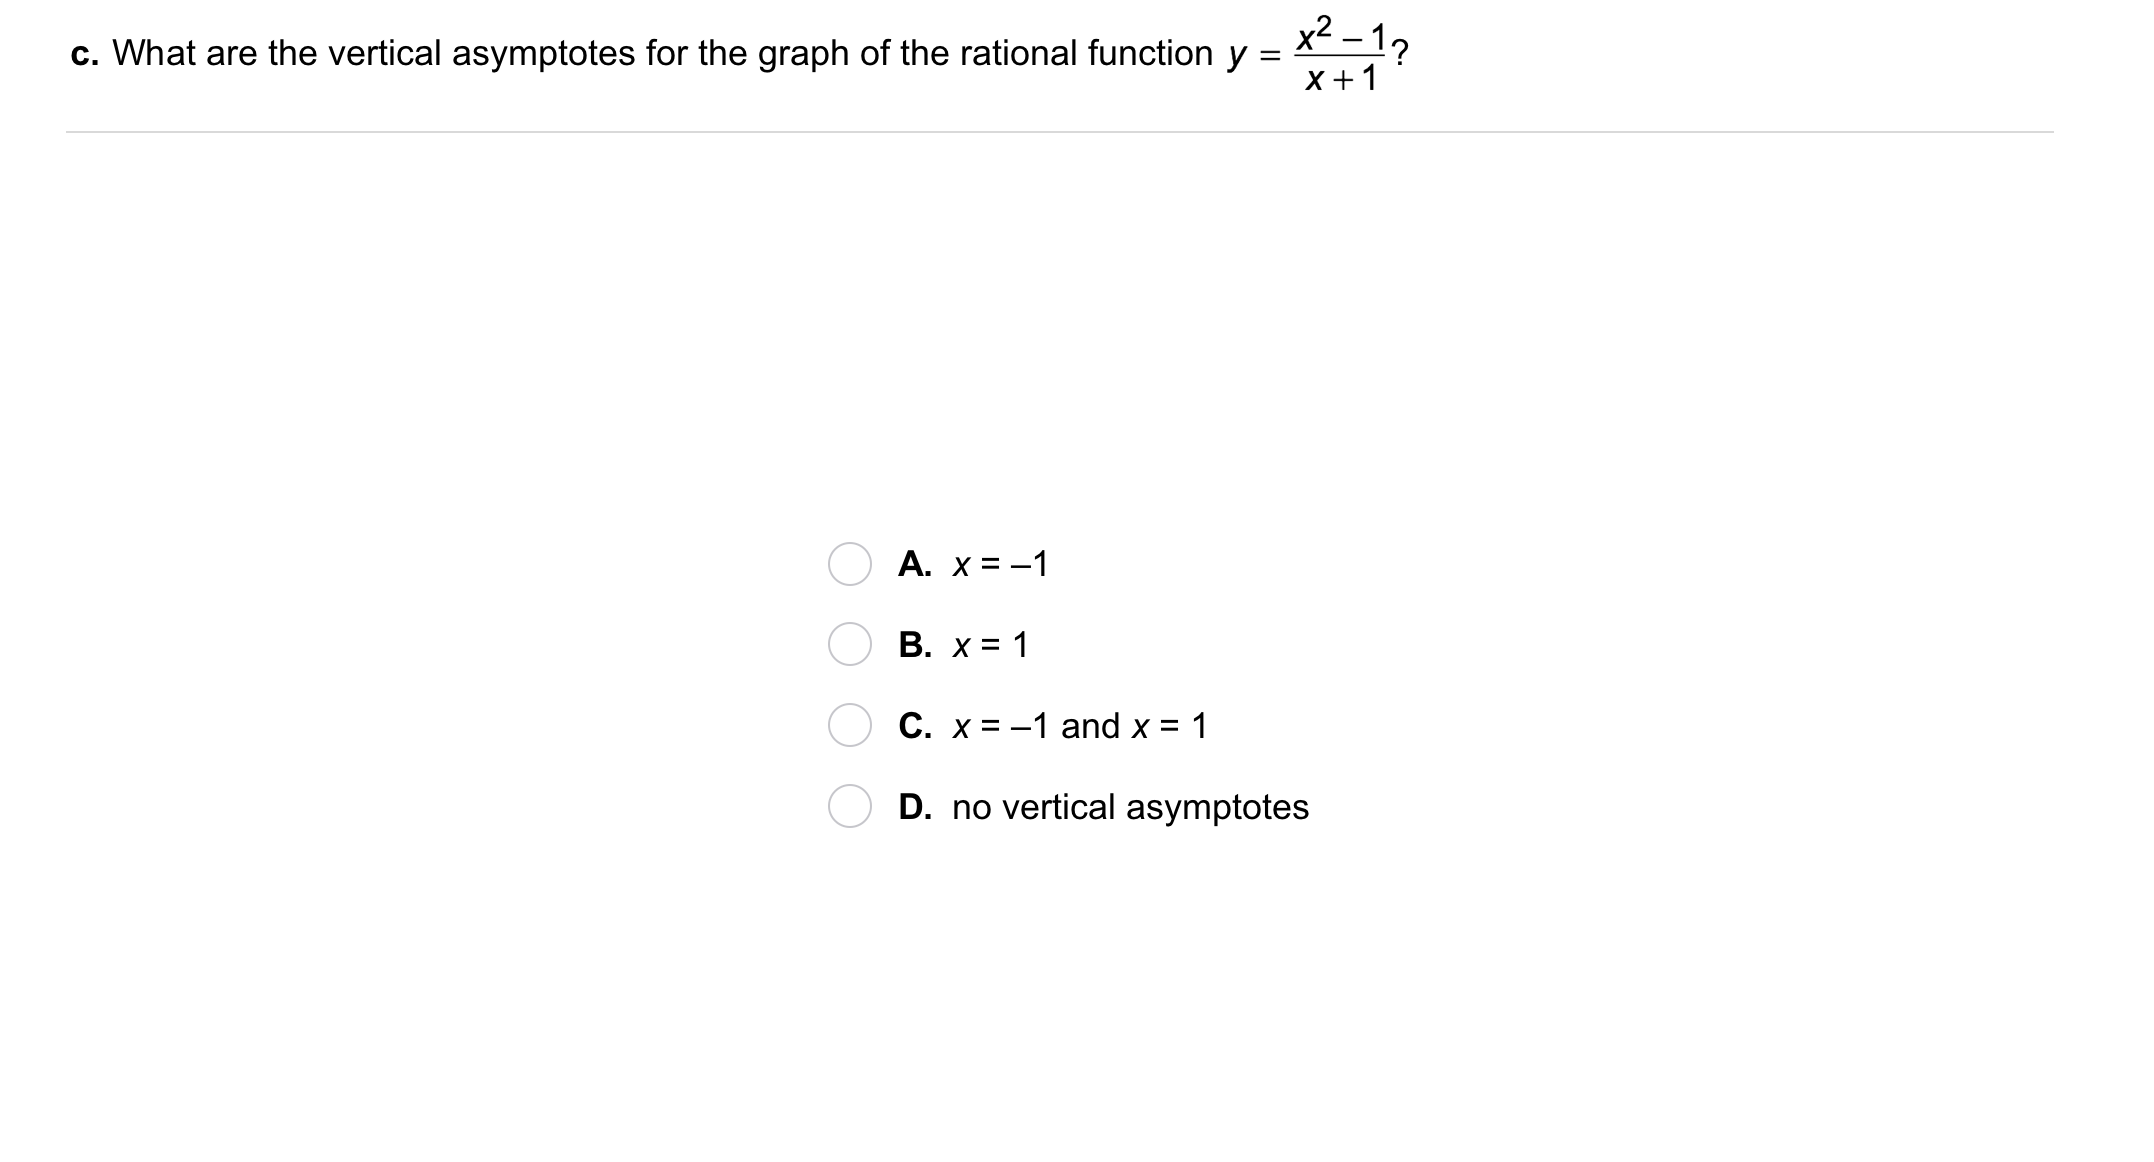
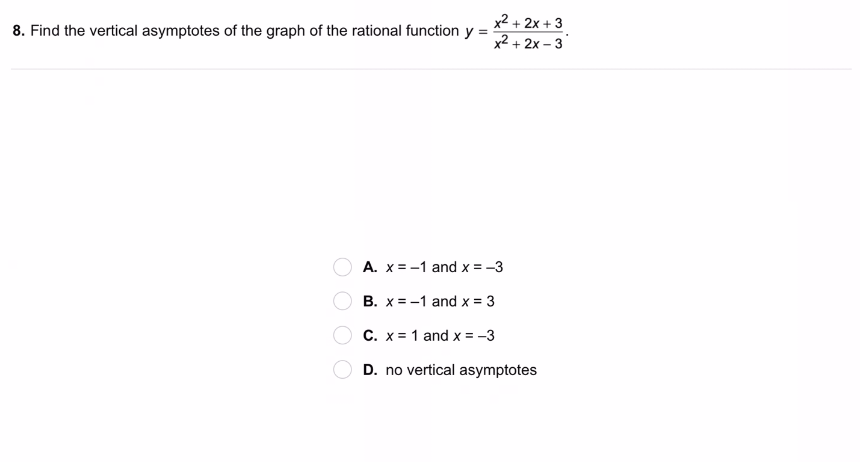
What are the vertical asymptotes for the graph of the function?
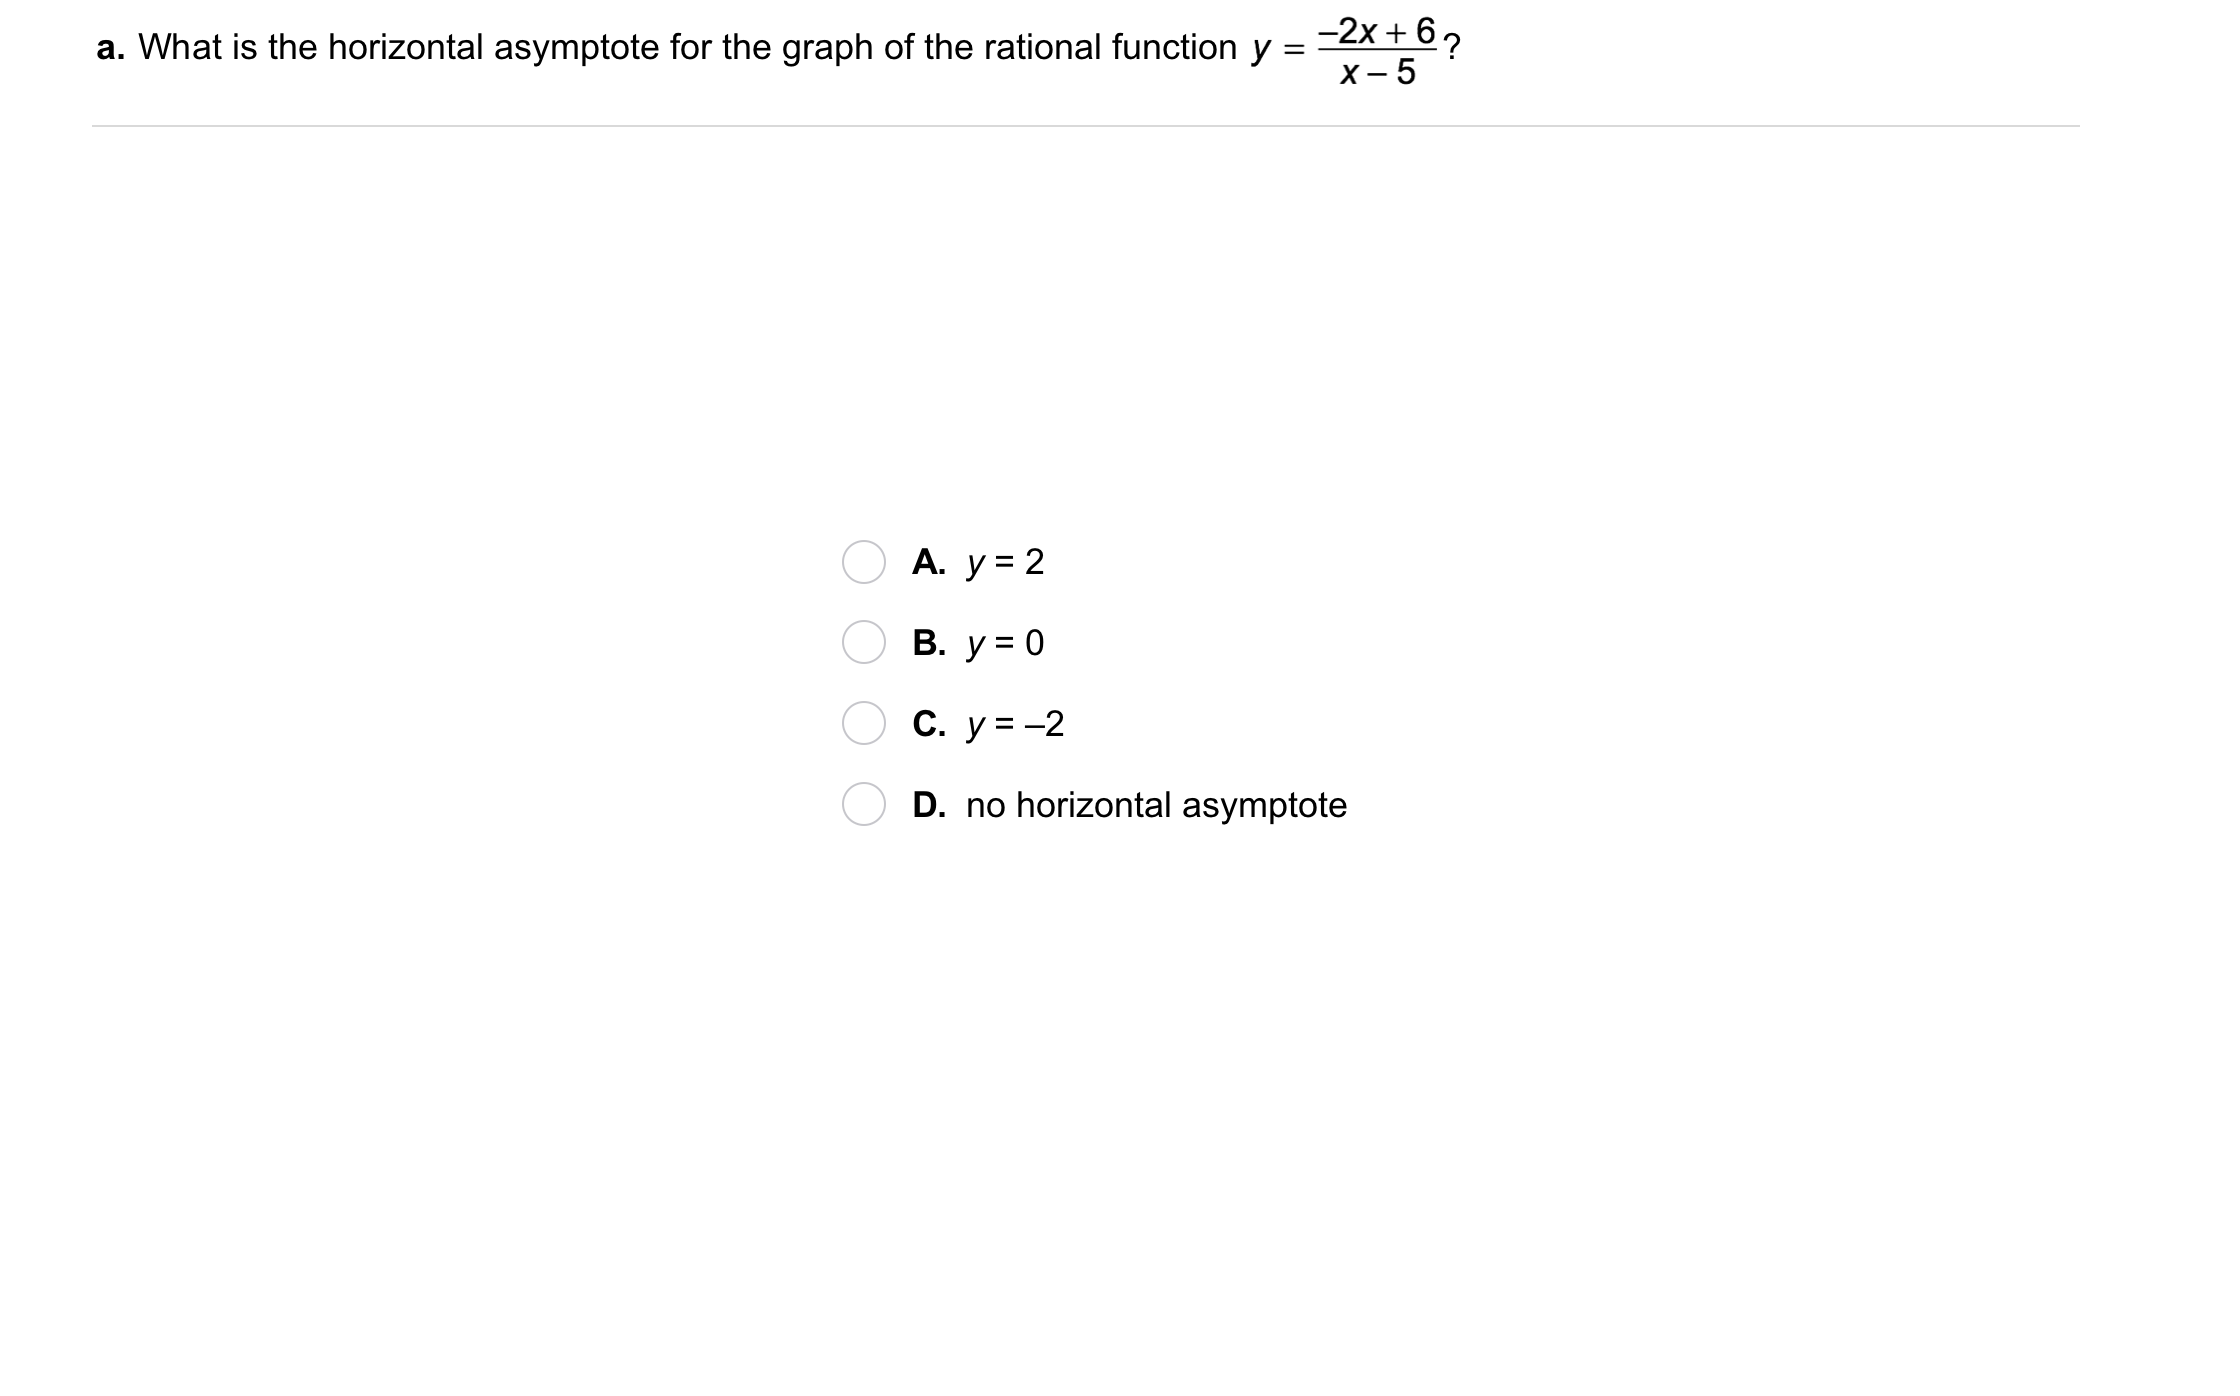
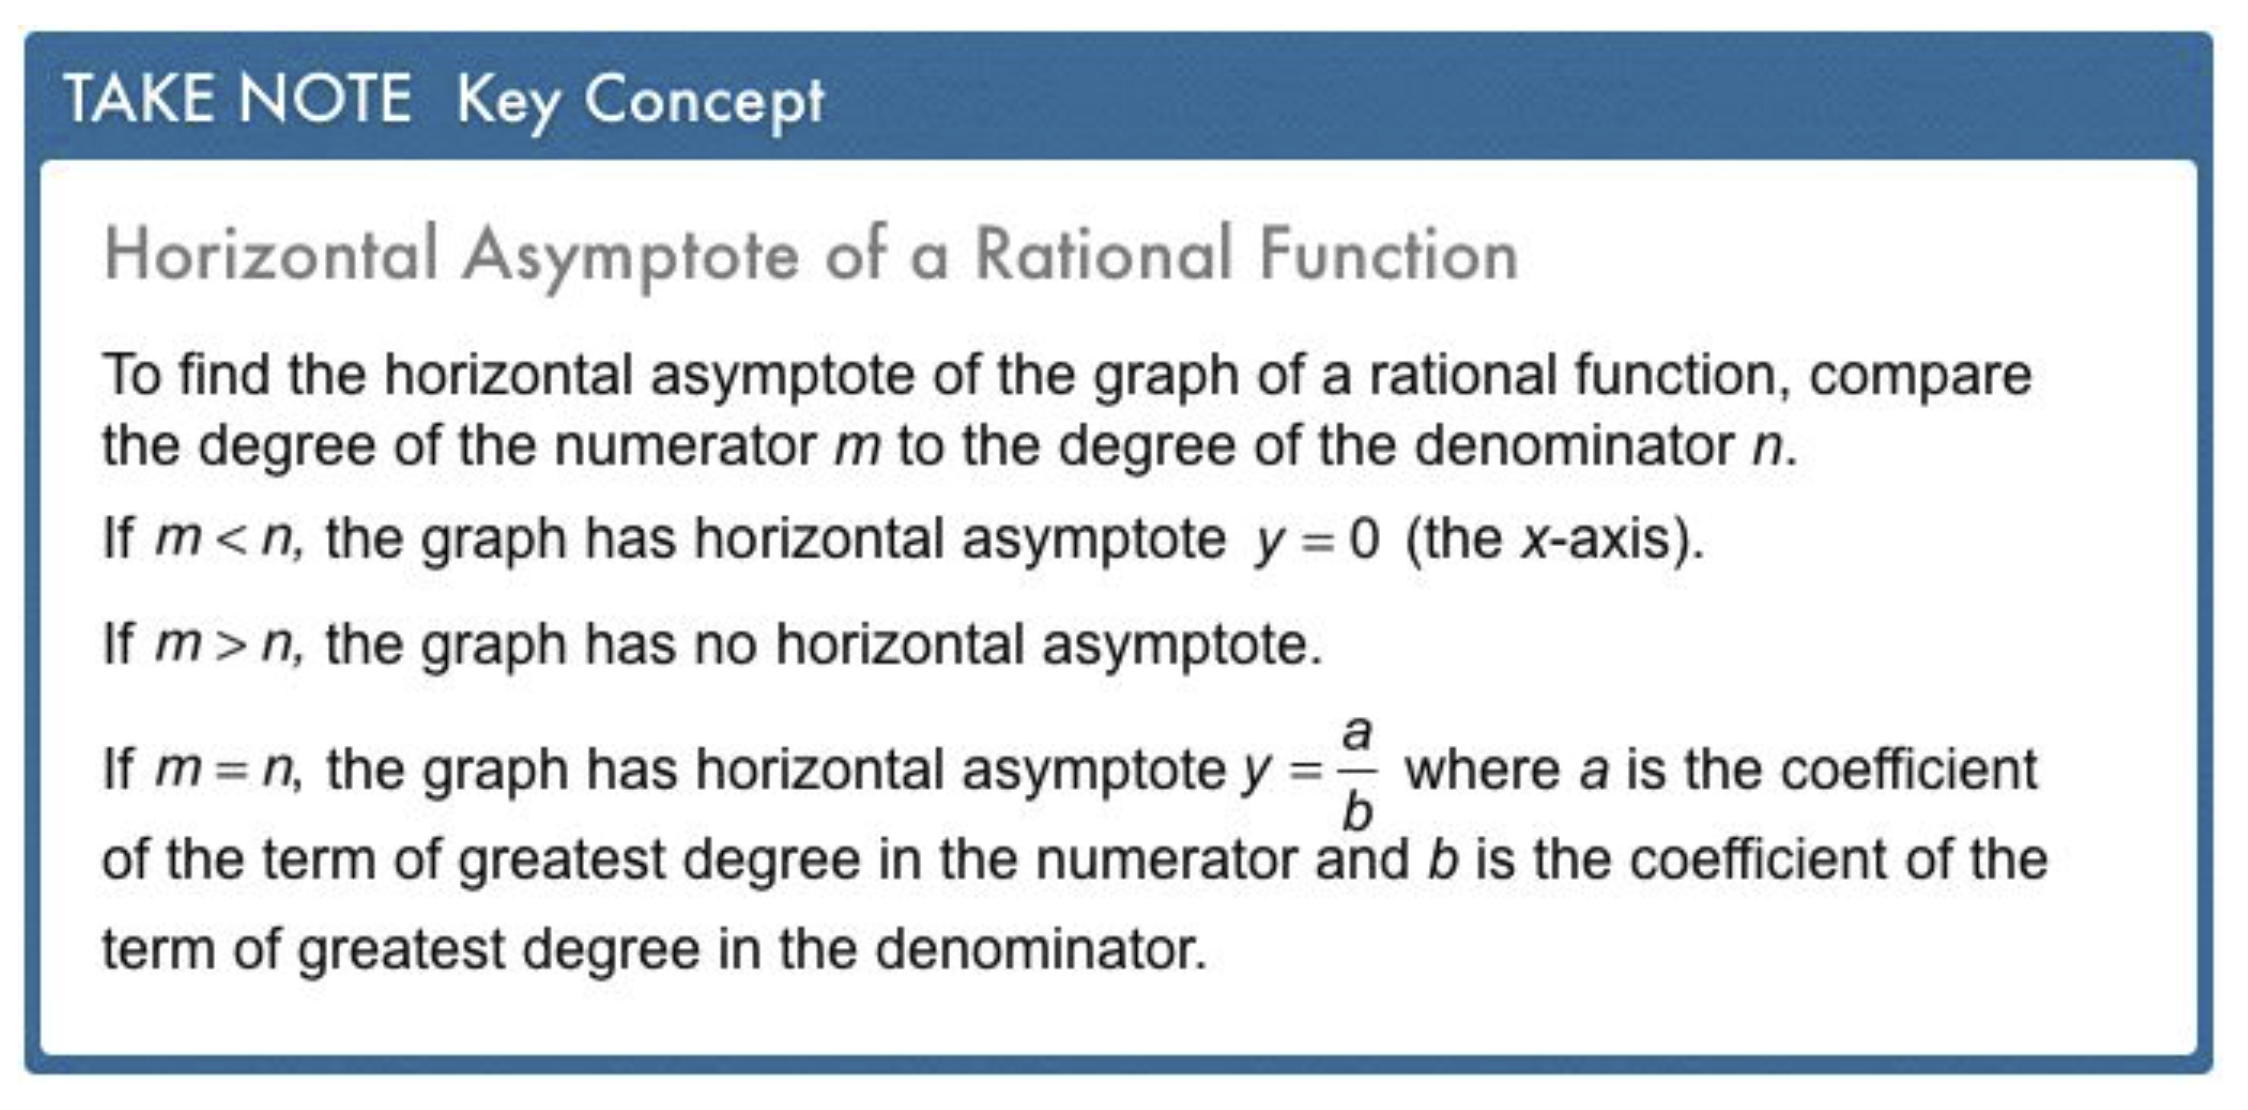
What is the horizontal asymptote for the graph of the function?
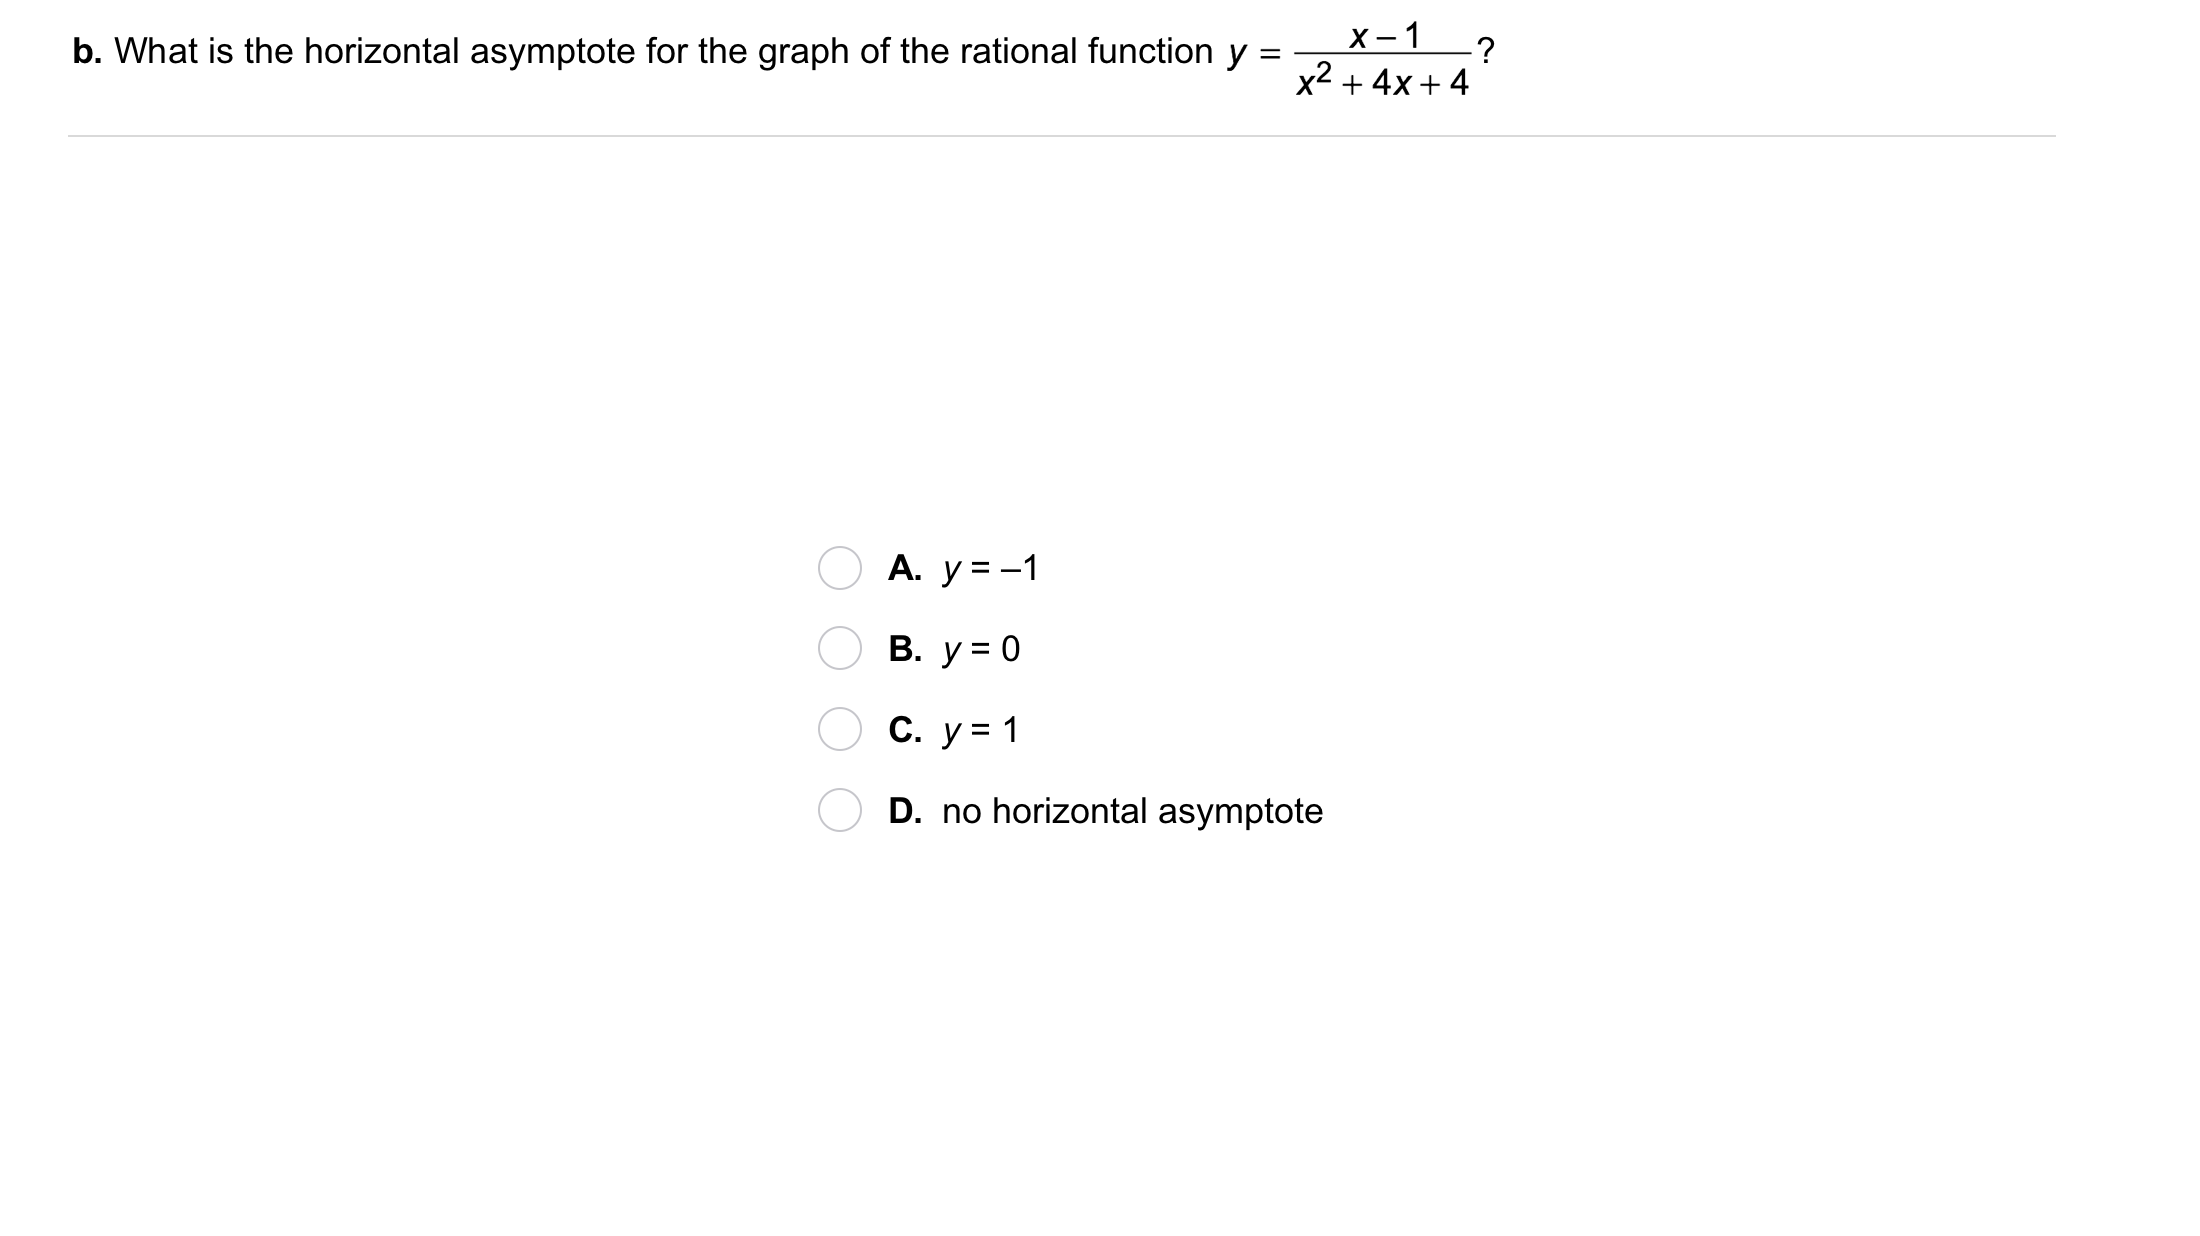
What is the horizontal asymptote for the graph of the function?
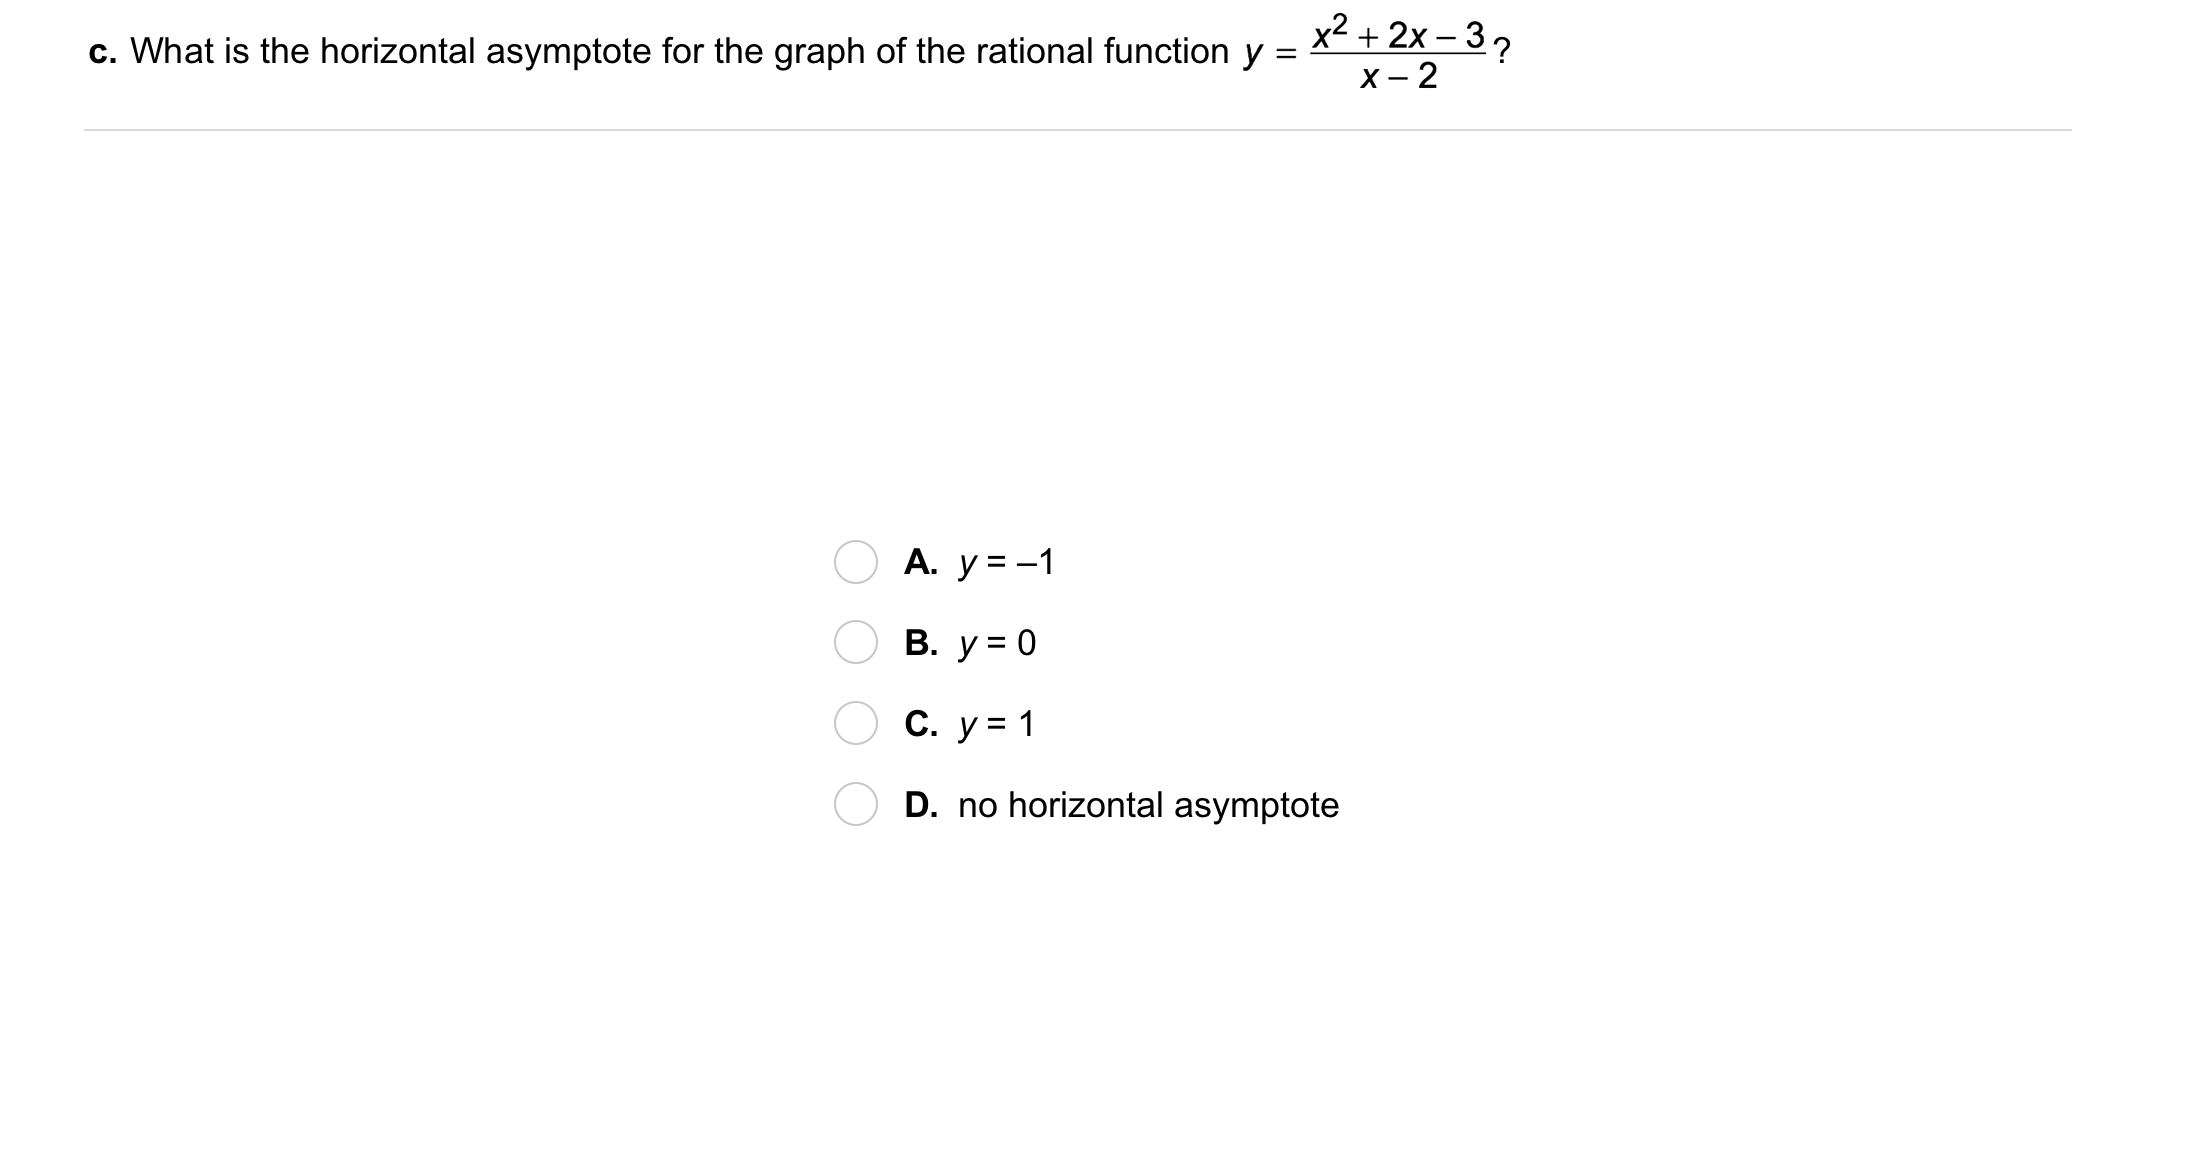
What is the horizontal asymptote for the graph of the function?
What is the graph of the rational function?
Use the techniques you've learned to graph the function by hand. Use colors that stand out and show your work on the canvas. Include all relevant graph detail.
What is the graph of the rational function?
Use the provided graphing utility to graph the function from the previous item. Zoom and pan your graph to establish an appropriate viewing window.
Please do not edit the original graph you created on the previous item's canvas, but you may use a new color to add a second handmade graph (for full credit) on the same canvas if you feel that a more accurate graph is necessary.

Graphing:
1. Without the aid of a graphing utility, sketch a graph the equation on the canvas below using the blue ink tool.
2. Graph the equation on the embedded Desmos graphing calculator above.
3. Sketch a copy of the Desmos graph on the canvas below using the red ink tool.
4. Consider any discrepancies between the graphs.
Be sure to include relevant graph detail: label axes, indicate units on both axes, and use arrows to represent end behavior, as appropriate.
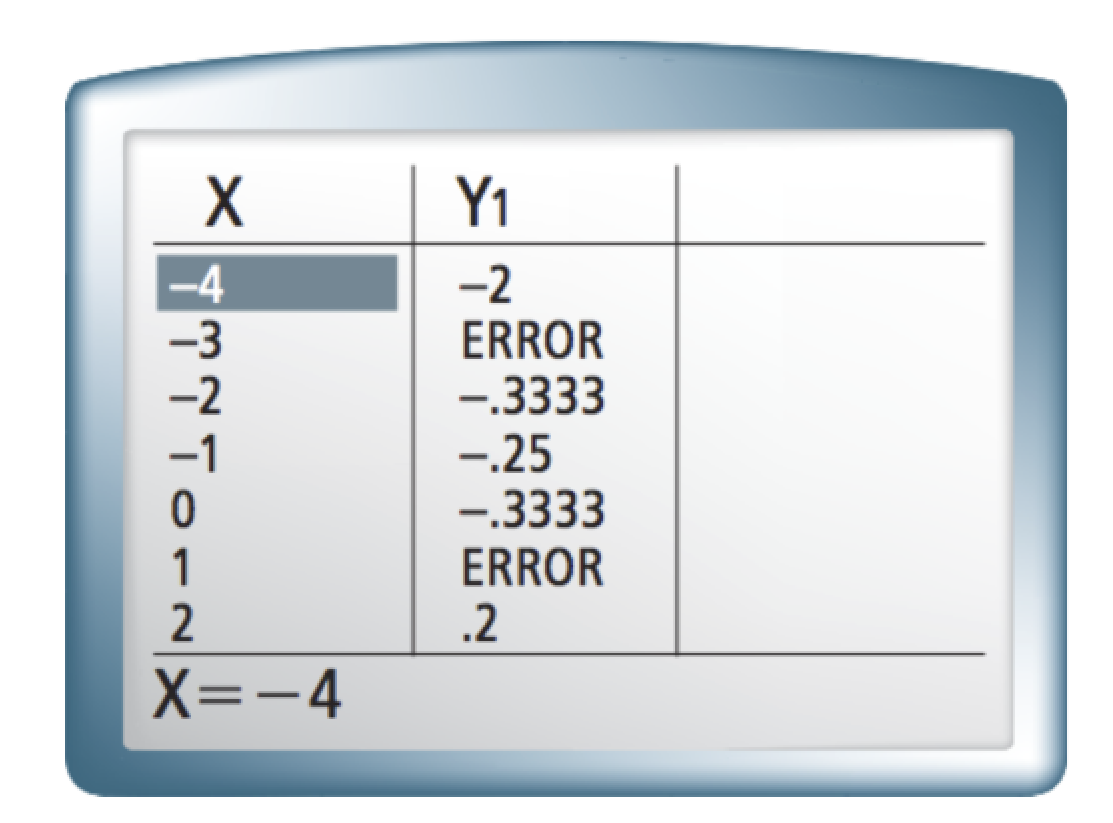
Reasoning: Assume that there are no more ERROR values in the 1 column. What is the lowest possible degree of the denominator?
Review Lesson 8-2: Match a graph of asymptotes from the left with each equation on the right.


Review Lesson 6-7: Find the inverse of the function.
Review Lesson 1-5: Solve the inequality. Graph the solution.
Select BOTH the correct solution AND correct graph from the options below.
Review Lesson 4-4: Factor the expression completely.
Review Lesson 4-4: Factor the expression completely.
Vocagulary Review: Categorize each statement as true or false.
A polynomial can be named by its degree.
A polynomial with one term is called a binomial.
True
False
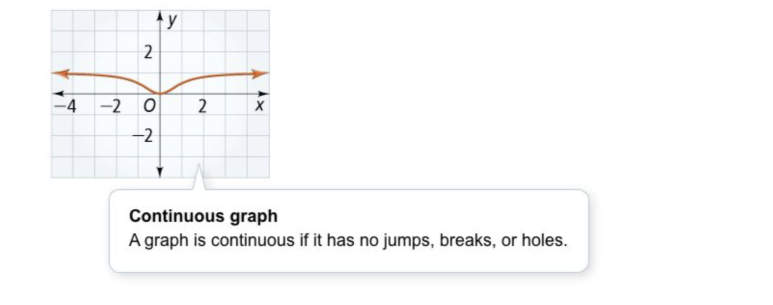
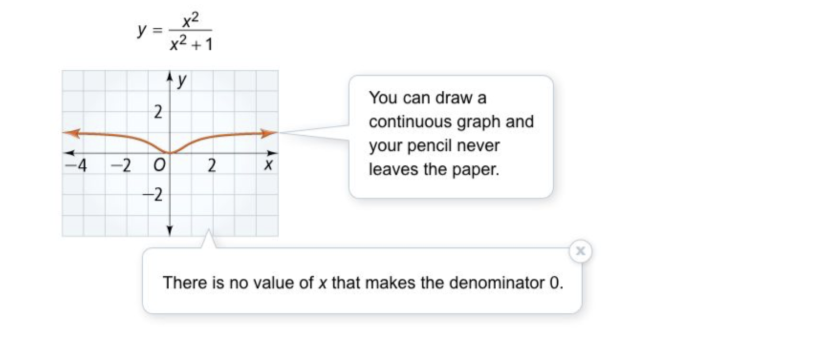
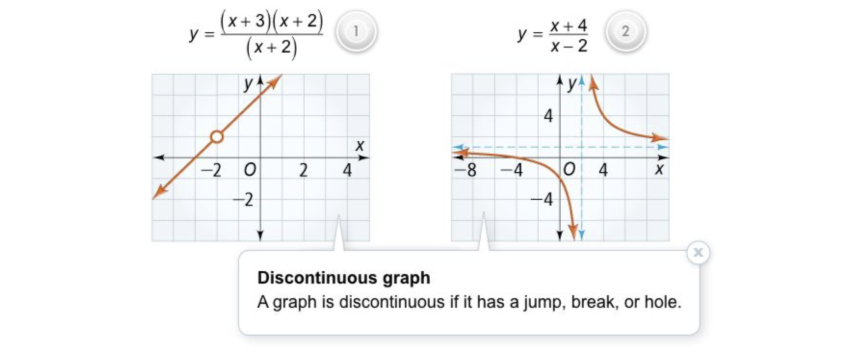
Use Your Vocabulary: Categorize each graph as continuous or discontinuous.


Continuous
Discontinuous
Notes: Take a clear picture or screenshot of your Cornell notes for this lesson. Upload it to the canvas. Zoom and pan as needed.
For a refresher on the Cornell note-taking system, click here.
Reflection: Math Success