Two Variable Statistics Retake
star
star
star
star
star
Last updated over 6 years ago
10 Nsɛmmisa
1
1
1
1
1
1
1
1
1
1
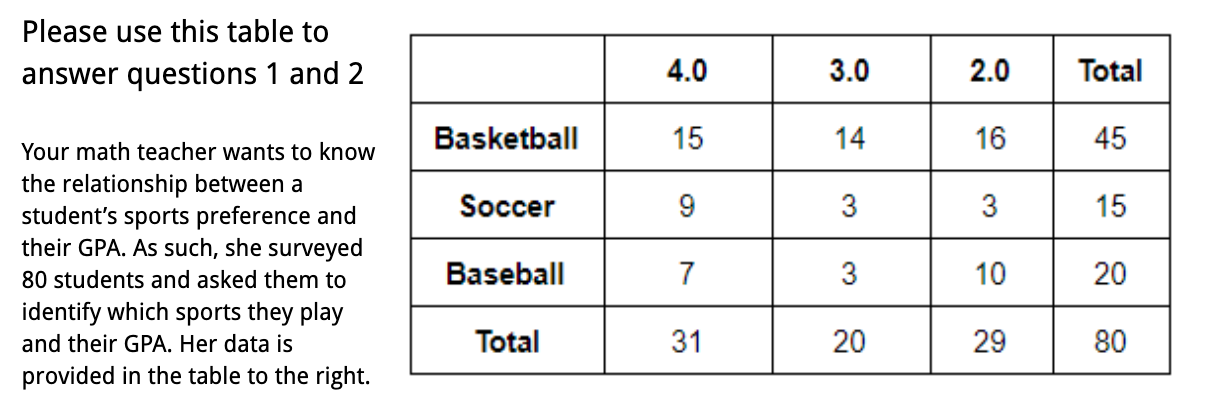
What percent of students with a 4.0 average play soccer? (Please write it as a percent and round to the nearest whole number)
What proportion of soccer players have a 4.0 average?
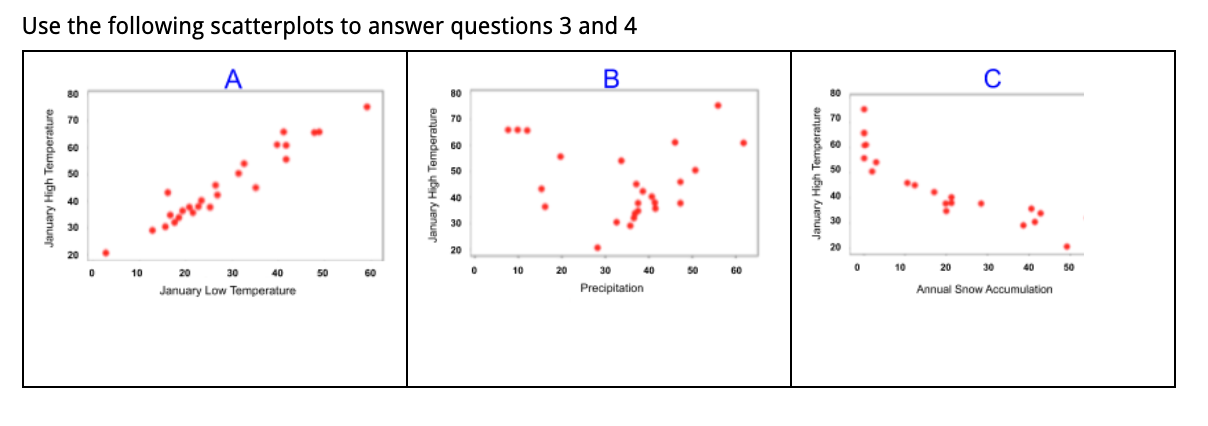
Which scatterplot shows the weakest linear association (r value closer to 0)? Explain your choice.
Which scatterplot shows a strong linear association (r value close to 1 or -1)? Explain your choice.
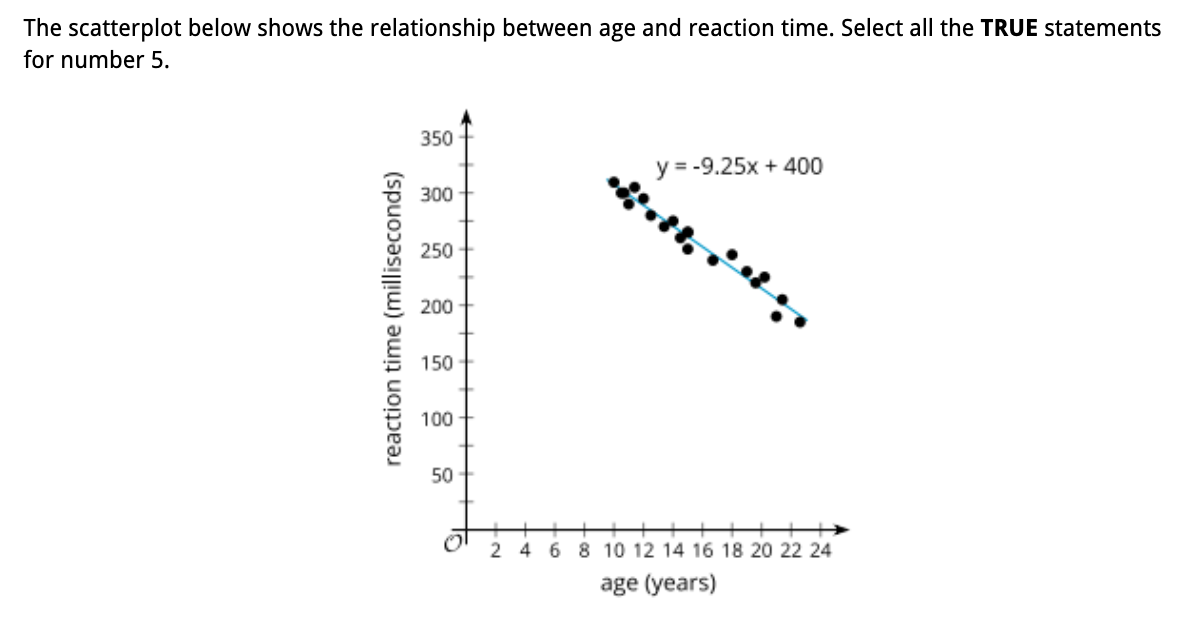
Select all TRUE statements based off the image above.
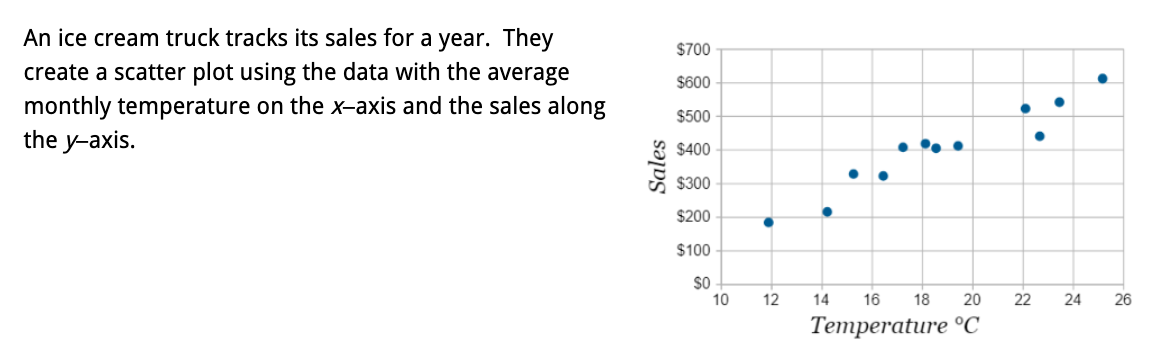
The data in the graph above suggest a linear association. Which of the functions best represents the equation of the line of best fit?
Interpret the slope of the equation you just selected above.
You can use this template to help you if needed:
As the ________ (x-axis) increases by 1, the __________ (y-axis) increases/decreases by ______ (slope).
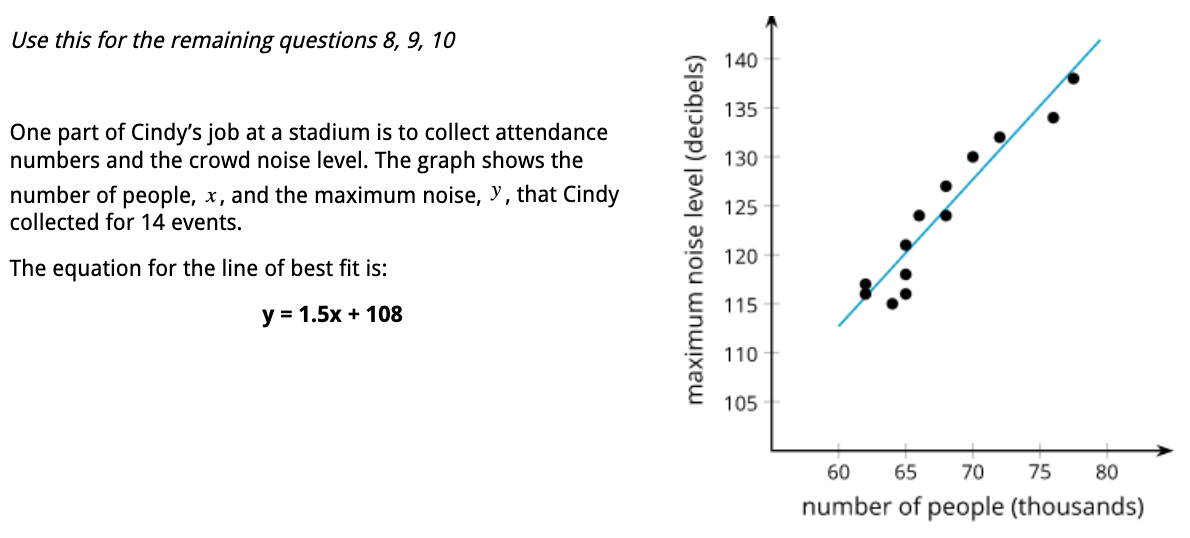
Use the given linear model y= 1.5x + 108 to predict what the noise level would be if 60 people attended.
Explain the meaning of the slope of the line in context.
Describe the correlation between the variables as either strong or weak and as either positive or negative. Explain your reasoning.