4/23 Using Mean and MAD to make comparisons
star
star
star
star
star
Last updated over 6 years ago
12 Nsɛmmisa

1
1
1
1
1
1
1
1
1
1
1
1
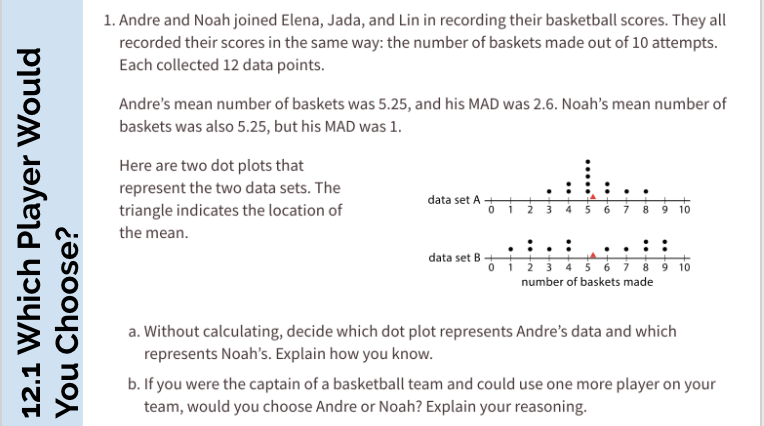
1a) Without calculating, decide which dot plot represents Andre’s data and which represents Noah’s. Explain how you know.
1b) If you were the captain of a basketball team and could use one more player on your team, would you choose Andre or Noah? Explain your reasoning.
Calculate the MAD and then Draw a dot plot with his data and put a triangle on the mean
2c) Compare the eighth-grade student’s mean and MAD to Noah’s mean and MAD. What do you notice?
2d) Compare their dot plots. What do you notice about the distributions?
2e) What can you say about the two players’ shooting accuracy and consistency?
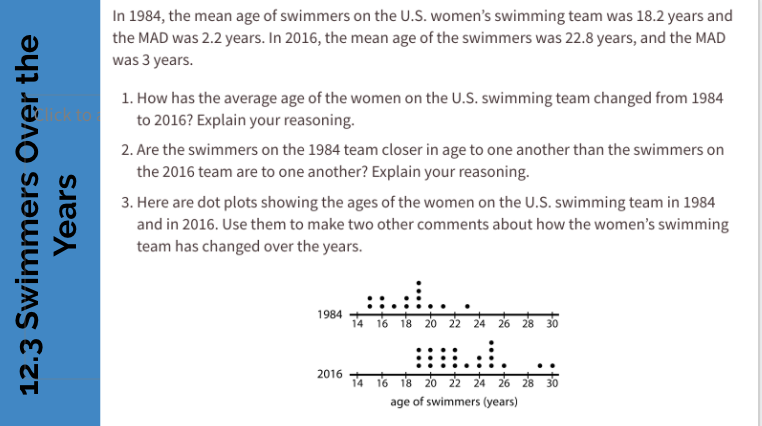
1) How has the average age of the women on the U.S. swimming team changed from 1984 to 2016? Explain your reasoning.
2) Are the swimmers on the 1984 team closer in age to one another than the swimmers on the 2016 team are to one another?
3)
![]()
Here are dot plots showing the ages of the women on the U.S. swimming team in 1984 and in 2016. Use them to make two other comments about how the women’s swimming team has changed over the years.
Which group of students has the greatest variability in their travel times?

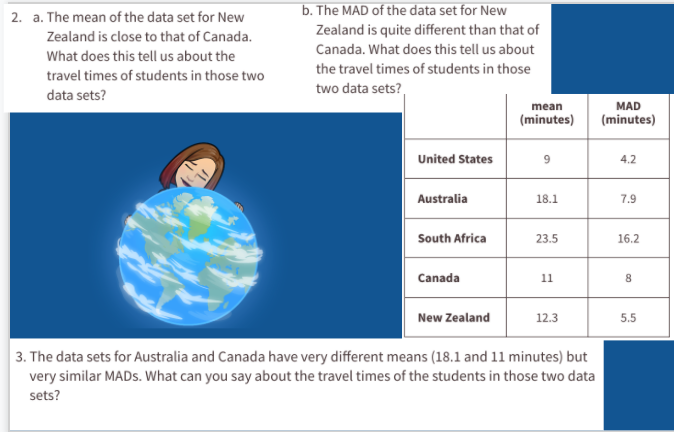
2a) The mean of the data set for New Zealand is close to that of Canada. What does this tell us about the travel times of students in those two data sets?

2b) The MAD of the data set for New Zealand is quite different than that of Canada. What does this tell us about the travel times of students in those two data sets?
