Changes in supply and demand
star
star
star
star
star
Last updated about 6 years ago
5 Nsɛmmisa

1
1

1

1
1
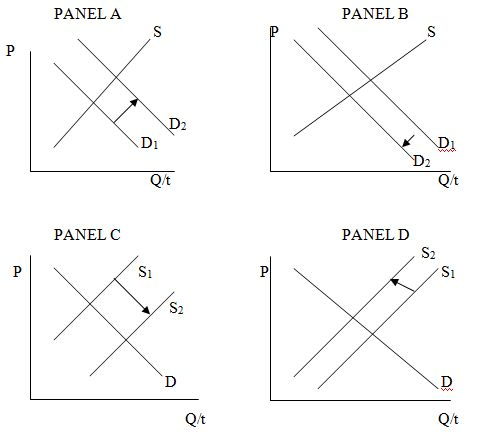
Which graph above is depicting what has happened to the market for oil as people continue to isolate?
Which graph above is depicting what will happen to the oil market if many producers go bankrupt?
If many oil producers do go out of business, what will be the impact on equilibrium price and quantity?
With the dramatic increase in the demand for oil tanker ships, what has happened to equilibirum price and quantity of ships?
Using graph 8 above if consumers return to driving and flying soon and oil producers release their excess capacity simultaneously, what happens to equilibrium price and quantity of oil?